[Front page] [Contents] [Previous] [Next] |
Waste Statistics 1997
6. Waste fractions and status compared to objectives for year 2000
6.1 Residues from waste incineration plants
6.2 Waste from building and constuction activities
6.3 Households
6.3.1 Domestic waste
6.3.2 Bulky waste
6.3.3 Garden waste
6.3.4 Household waste per capita
6.4 Waste from manufacturing industry
6.5 Waste from institutions, trade and offices
6.6 Residues from coal-fired power plants
6.7 Sludge from municipal wastewater treatment plants
6.1 Residues from waste incineration plants
Residues from waste incineration plants are not included in statements of total waste generation presented so far, as waste would otherwise be counted twice.
Figure 7 shows amounts of residues (slag, fly ash, and flue gas cleaning products) from waste incineration in 1997, stated in tonnes, as well as treatment option.
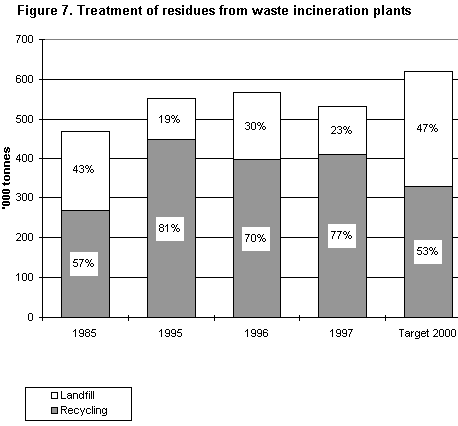
Sources: ISAG reports 1995, 1996 and 1997, and the Government's Plan of Action for waste and recycling 1993-97.
In Table 13, amounts of residues removed from waste incineration plants are detailed further. Amounts of residues from waste incineration naturally depend on amounts of waste incinerated. The table shows that amounts removed from waste incineration plants decreased by 26,000 tonnes from 1996 to 1997. 150,000 tonnes were landfilled in 1997, which is 42,000 tonnes less than in 1996. Recycling of residues from waste incineration plants in 1997 amounted to some 407,000 tonnes, which is almost 24,000 tonnes more than in 1996.
| Table 13. Slag, fly ash and flue gas cleaning products removed from waste incineration plants in 1995, 1996 and 1997 related to treatment option. Tonnes | |||
| 1995 | 1996 | 1997 | |
| Slag removed from waste incineration plants | 491,300 |
509,200 |
493,800 |
| Fly ash and flue gas cleaning products removed from waste incineration plants | 63,300 |
71,900 |
61,300 |
| Total removed from waste incineration plants | 554,600 |
581,100 |
555,100 |
| Landfilled slag from waste incineration plants | 64,500 |
126,300 |
87,100 |
| Landfilled fly ash and flue gas cleaning products from waste incineration plants | 44,400 |
45,300 |
36,600 |
| Fly ash and flue gas cleaning products exported for landfilling | 2,564 |
21,103 |
26,510 |
| Total landfilled from incineration plants | 111,464 |
192,703 |
150,210 |
| Slag from waste incineration plants registered as delivered to reprocessing plants | 121,900 |
101,800 |
106,100 |
| Slag from waste incineration plants estimated as delivered directly to recycling | 304,900 |
281,100 |
300,600 |
| Total recycling from waste incineration plants | 426,800 |
382,900 |
406,700 |
| Fly ash and flue gas cleaning products removed from waste incineration plants and estimated as in storage. | 16,336 |
5,497 |
- 1,810 |
Source: Calculations based on ISAG reports 1995, 1996, and 1997 and registrations according to EU Regulation on shipments of waste.
6.2 Waste from building and construction activities.
In 1997, waste from the building and construction sector amounted to a total of 3,427,000 tonnes, which is an increase of 11 per cent or 339,000 tonnes compared to 1996-amounts. Such an increase is not surprising, as activities in the building and construction sector have been increasing since the beginning of 1996 and seem to have peaked in early 1998. It is therefore to be expected that waste arisings from this sector will also be considerable in next year's statistics, though perhaps not quite as large as in 1997.
As it can be seen from Figure 8, by far the largest proportion of waste from the building and construction sector is recycled - only 1 per cent of waste is incinerated, whereas 8 per cent is landfilled. This adds up to a rate of recycling in 1997 of 92 per cent, which is an increase by 3 per cent compared to 1996. The figure also shows that objectives for year 2000 have been more than attained for construction and demolition waste, both for recycling, incineration, and landfilling.

Sources: ISAG reports 1995, 1996 and 1997, and the Government's Plan of Action for waste and recycling 1993-97.
Figure 9 shows composition of construction and demolition waste. More than half the waste is concrete and asphalt.

Source: ISAG reports 1997. Legend: clock-wise from top.
A large proportion of construction and demolition waste is reprocessed in mobile crushing plants moved around the country for various assignments. In some cases, both the owner of the crushing plant and his client report to the ISAG. The Danish Environmental Protection Agency is aware of this possible source of double counting, and great efforts are made in co-operation with reporting enterprises to subject data to quality assurance in order to avoid double counting.
6.3 Households.
It can be seen from Tables 1 and 14 that total waste generation in households in 1997 amounted to some 2,776,000 tonnes, which is almost identical to 1996.
Waste from households covers primarily the waste types domestic waste, bulky waste, and garden waste, which again can be divided into waste fractions such as paper and cardboard, bottles and glass, and food waste/other organic waste. See also Table 14 where fractions are stated, in so far as it has been possible to register them separately.
| Table 14. Waste generation in households by fraction. Stated in tonnes | 1994 |
1995 |
1996 |
1997 |
| Various burnable | 1,794,717 |
1,769,445 |
1,800,752 |
1,784,342 |
| Various non-burnable | 203,430 |
189,443 |
164,356 |
155,590 |
| Paper and cardboard | 142,668 |
173,330 |
160,469 |
183,116 |
| Bottles and glass | 69,064 |
46,157 |
64,903 |
67,771 |
| Food waste/other organic | 32,907 |
38,913 |
45,905 |
47,085 |
| Branches, leaves, grass cuttings etc. | 248,574 |
298,090 |
386,874 |
426,309 |
| Oil and chemical waste | 9,576 |
16,300 |
16,214 |
12,668 |
| Other | 73,880 |
78,098 |
127,479 |
99,181 |
| Total | 2,776,061 |
Sources: ISAG reports 1994, 1995, 1996, and 1997.
Amounts of "various non-burnable" from households have decreased for the third consecutive year. The decrease was almost 24 per cent in the period from 1994 to 1997. As this fraction is normally landfilled, this is an expression of waste from households being separated better, resulting in smaller amounts of waste for landfilling.
Amounts of separately collected paper and cardboard from households increased by 14 per cent from 1996 to 1997, whereas amounts of separately collected bottles and glass increased by around 4 per cent.
There has been a minor increase of around 3 per cent in amounts of separately collected food waste/other organic waste from households from 1996 to 1997.
Amounts of garden waste from households continued to increase. From 1996 to 1997 amounts of garden waste increased by 10 per cent. In the period from 1994 to 1997, the total increase was just above 70 per cent.
Developments and treatment of different waste types are detailed below.
6.3.1 Domestic waste
Domestic waste from households covers waste that results from normal consumption in private households, i.e. paper, bottles and glass, organic food waste, and residual waste, which is collected at regular intervals, normally weekly or every second week.

Sources: ISAG reports 1995, 1996 and 1997, and the Government's Plan of Action for waste and recycling 1993-97.
Table 1 shows that amounts of domestic waste from households decreased from 1,654,500 tonnes in 1996 to 1,620,800 tonnes in 1997, corresponding to a decrease of 2 per cent.
Domestic waste recycling remained at a level of 15 per cent of total amounts, whereas 80 per cent was incinerated in 1997 against 77 per cent in 1996. Landfilling decreased from 8 per cent to 5 per cent in 1997, see also Figure 10.
Figure 10 also shows that the objective for year 2000 of 40 to 50 per cent recycling of domestic waste is far from being attained. By contrast, the objective for year 2000 of 0 per cent landfilling of domestic waste is closer to being attained. Domestic waste is incinerated to an increasing extent instead of being landfilled.
6.3.2 Bulky waste
In 1997, 587,700 tonnes of bulky waste were generated in Danish households, which is a decrease of 8 per cent compared to 1996, cf. Table 1. Amounts of bulky waste have doubled since 1985. This is due to a real increase in bulky waste amounts, but for a major part also to the introduction of collection schemes and bring schemes at recycling centres.
It can be seen from Figure 11 that the rate of recycling of bulky waste from households has been relatively stable since 1985.

Sources: ISAG reports 1995, 1996 and 1997, and the Government's Plan of Action for waste and recycling 1993-97.
In 1997, 17 per cent of bulky waste was recycled which is actually less that the previous year. This means that the objective of 25 per cent recycling in year 2000 is still far ahead.
As in previous years, too much bulky waste was delivered to landfilling, but landfilled amounts expressed in per cent have been reduced significantly from 73 per cent in 1985 to 42 per cent in 1997.
6.3.3 Garden waste
Garden waste amounts collected from households reached 442,700 tonnes in 1997. This is an increase of 10 per cent compared to 1996, cf. Table 1.
Figure 12 shows treatment of garden waste. It can be seen that 97 per cent of garden waste was recycled in 1997, which is far more than stated in the Plan of Action for waste and recycling 1993-1997. Only 2 per cent was incinerated - the objective of the Plan of Action states a maximum of 15 per cent - and only 1 per cent was landfilled. Compared to 1985, garden waste has been diverted from incineration and landfilling, so that almost all garden waste is recycled today.
The remarkable increase from 1995 to 1997 of 75,000 tonnes of garden waste from households is not only attributable to actual increases. Around 20,000 tonnes derive from plants that should have reported in 1994 and 1995, but only did so as from 1996. The rest of the increase may be seen as an expression of increased use of municipal schemes for garden waste.
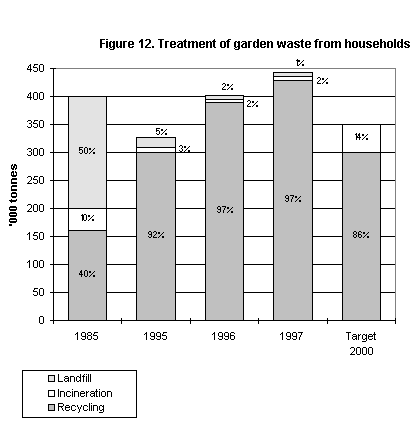
Sources: ISAG reports 1995, 1996 and 1997, and the Government's Plan of Action for waste and recycling 1993-97.
6.3.4 Household waste per capita.
Table 15 states the generation of household waste per capita and per household. The table covers both waste type and waste fraction.
As the table shows, waste generation in households stated per capita and household remained relatively stable compared to 1996, as only a minor increase of 1 and 4 kg respectively has been registered.
| Table 15. Waste generation in households in 1996 and 1997 per capita and household. Stated in kg. | 1996 |
1997 |
||
Per capita |
Per household |
Per capita |
Per household |
|
| Households total | 525 |
1,157 |
526 |
1,161 |
Of which |
||||
| Mixed domestic waste | 266 |
588 |
316 |
698 |
Separately collected |
||||
| Domestic waste/paper | 27 |
59 |
31 |
68 |
| Domestic waste/glass | 12 |
25 |
12 |
27 |
| Domestic waste/food waste | 9 |
19 |
9 |
20 |
| Hazardous waste | 3 |
7 |
2 |
6 |
| Garden waste | 76 |
168 |
84 |
185 |
| Bulky waste | 121 |
267 |
111 |
246 |
Of which |
||||
| Paper | 4 |
8 |
4 |
9 |
| Glass | 1 |
2 |
1 |
2 |
Source: ISAG reports 1996 and 1997. Population figures and number of households per 1st January 1997 have been used.
A good half of households' waste generation is collected in separate collection schemes for paper/cardboard, bottles/glass, food waste/other organic, hazardous waste, bulky waste, and garden waste. This shows that households separate their waste extensively.
Both measured per capita and per household there has been an increase from 1996 to 1997 in separate collection of paper/cardboard and garden waste, whereas amounts of separately collected bulky waste decreased.
In an evaluation of waste generation from households it is worthwhile to notice that garden waste and bulky waste make up a significant proportion of total amounts.
6.4 Waste from manufacturing industry.
The composition of waste from manufacturing industries is presented in Figure 13. It can be seen that ferrous metals, various burnable, and various non-burnable account for the largest single fractions in industrial waste.

Source: ISAG reports 1997. Legend: clock-wise from top.
Total waste generated in manufacturing enterprises in 1997 amounted to 2,736,000 tonnes, corresponding to 104,000 tonnes or 4 per cent more than in 1996.
This increase is mainly attributable to an increase in amounts of various burnable waste and ferrous metals of 60,000 tonnes and 135,000 tonnes respectively. This increase is outweighed, however, by a decrease in amounts of beet soil and sludge of 101,000 and 85,000 tonnes respectively.
The decrease in amounts of beet soil from the harvesting of sugar beets is attributed to better weather conditions in 1997 compared to 1996. However, efforts made in the sector to reduce soil sticking to beets in harvesting have also played a significant role.
58 per cent of waste from industry was recycled in 1997, corresponding to some 193,000 tonnes more than in 1996, cf. Figure 14. Amounts incinerated in 1997 remained at the same level as in 1996, whereas 26 per cent was landfilled. This means that 115,000 tonnes less waste were landfilled in 1997 compared to 1996. This is certainly the right direction, but there is still some way to go before the objective of the Plan of Action for waste and recycling of maximum of 10 per cent landfilling will have been achieved.

Sources: ISAG reports 1995, 1996 and 1997, and the Government's Plan of Action for waste and recycling 1993-97.
6.5 Waste from institutions, trade and offices.
The composition of waste from institutions, trade and offices is presented in Figure 15. It is seen that the major proportion of waste falls within the fractions various burnable, various non-burnable, and separately collected paper and cardboard.
In 1997, waste generation in institutions, trade and offices amounted to 861,000 tonnes, corresponding to a minor increase of 10,000 tonnes compared to 1996.
This modest increase covers an increase in amounts of various non-burnable waste of 47,000 tonnes, whereas amounts of various burnable waste decreased by 37,000, and separately collected bottles and glass decreased by 14,000 tonnes. Other fractions were more or less identical to 1996.

Source: ISAG reports 1997. Legend: clock-wise from top.
The increase in amounts of various non-burnable waste, which is mainly landfilled, also means that compared to 1996 there was an increase of 4 percentage points in landfilled waste from institutions, trade and offices. This means that objectives of the Plan of Action for waste and recycling for no landfilling are further away from being attained than before, cf. Figure 16.

Sources: ISAG reports 1995, 1996 and 1997, and the Government's Plan of Action for waste and recycling 1993-97.
6.6 Residues from coal-fired power plants.
Amounts of residues from coal-fired power plants vary somewhat from one year to another due to variations in exports of power to Sweden and Norway. In 1996, the generation of residues was particularly large due to large exports of power. In 1997, amounts of residues decreased again to a level of 1,775,000 tonnes.
In 1997, recycling of residues from coal-fired power plants attained 73 per cent, corresponding to 1,300,000 tonnes, whereas landfilling decreased from 30 per cent in 1996 to 27 per cent in 1997. See also Figure 17.
 Sources: ISAG reports 1995, 1996 and 1997, and the
Government's Plan of Action for waste and recycling 1993-97.
Sources: ISAG reports 1995, 1996 and 1997, and the
Government's Plan of Action for waste and recycling 1993-97.
Table 16 shows recycling options for residues from coal-fired power plants.
| Table 16. Recovery in 1997 of residues from coal-fired power plants. In '000 tonnes. | Fly ash |
Slag/ |
Gyp- |
TASP |
Sulp- |
To- |
| Cement | 311 |
311 |
||||
| Concrete | 220 |
220 |
||||
| Porous concrete | 7 |
7 |
||||
| Asphalt | 49 |
49 |
||||
| Roofing felt | 5 |
5 |
||||
| Backfilling cf. Statutory Order 568 | 34 |
111 |
145 |
|||
| Backfilling cf. Part 5 approvals (Env. Protection Act) | 169 |
5 |
174 |
|||
| Granulates | 4 |
4 |
||||
| Fertiliser | 8 |
8 |
||||
| Backfilling | 36 |
36 |
||||
| Plaster board | 306 |
306 |
||||
| Total | 795 |
116 |
306 |
40 |
8 |
1,265 |
Source: Reports from Elsam and Elkraft
75 per cent of recycled residues was used as secondary raw materials in industrial manufacture of, for example, cement, concrete, and plaster board.
The remaining 25 per cent of recycled residues was recovered either under the terms of Statutory Order no. 586 of 6th December 1983 from the Ministry of Environment and Energy, or as backfilling with special approval under the Danish Environmental Protection Act.
This means that these residues are either used in building and construction works as backfilling below buildings, roads and squares, backfilling of cable conduits and trenches, for noise barriers, or as backfilling in land reclamation works or harbour fillings.
6.7 Sludge from municipal wastewater treatment plants.
Figure 18 shows treatment of sludge from municipal wastewater treatment plants. The statement only includes sludge, excluding sand and screenings.

Sources: ISAG reports 1995, 1996 and 1997, and the Government's Plan of Action for waste and recycling 1993-97. Reports to the Danish Environmental Protection Agency on sludge applied to farmland etc. Figures for 1997 are based on data from 1996.
In 1997, amounts of sludge stated in wet weight were 1,209,000 tonnes, which is 34,000 tonnes more than in 1996.
Recycling of sludge decreased from 78 per cent in 1996 to 72 per cent in 1997, and amounts incinerated increased by 5 percentage points to 20 per cent, whereas amounts delivered to landfilling increased by one percentage point to 8 per cent.
[Front page] [Contents] [Previous] [Next] [Top] |