[Front page] [Contents] [Previous] [Next] |
Benzene from traffic
3. Air quality measurements
3.1 Air quality
3.2 Air quality measurement programme
3.3 Data analysis
Air quality data
Air quality data are available for Jagtvej in Copenhagen and Albanigade in Odense.
An overview of the available data is shown in figure 7.
Figure 7 At the top are shown periods of available data on analyses of BTX in petrol from Statoil’s refineri, Shell’s refineri and petrol stations in Roskilde. Below are shown periods of available data on air quality (CO, NOx and BTX) from Odense (Albanigade and urban background) and Copenhagen (Jagtvej and urban background). LOOK HERE |
3.1 Air quality
Concentration levels
Table 1 gives an overview of the measured concentrations of benzene and toluene at Jagtvej in Copenhagen and Albanigade in Odense. The EU limit value for benzene will probably be 5 µg/m3 as an annual average, which means that this value was exceeded in 1998 at Jagtvej and close to be exceeded at Albanigade.
Table 1 Statistical parameters based on hourly results for benzene and toluene in 1998 measured at Copenhagen/1257 and Odense/9155. All values are given in µg/m3. The values from Odense/9155 are based on only 8 months results. Lifetime risk and guideline value are from WHO, 1997. The 7 days maximum is calculated as a moving average based on 24 hour averages, (Kemp and Palmgren, 1999). |
||||||||
| Spe- cie |
Sta- tion |
Ave- |
Me- |
98- |
99.9 perc. (hour) |
Max 7 days |
Life |
Guide- |
| Ben- zene |
Copen- hagen/ 1257 |
7.0 |
5.3 |
21 |
41 |
- |
4.4 - 7.5 , 10-6 |
- |
| Odense/ 9155 |
4.8 |
2.8 |
20 |
43 |
||||
| Tolu- ene |
Copen- hagen/' 1257 |
23 |
17 |
80 |
158 |
47 |
- |
260 |
| Odense /9155 |
16 |
9.3 |
75 |
150 |
34 |
|||
Correlation CO:BTX
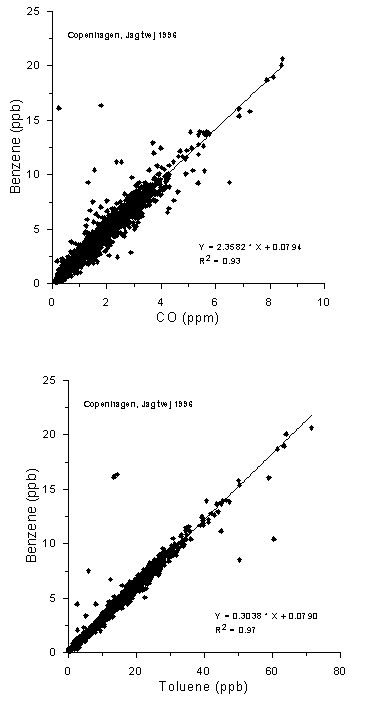
The aromatic compounds showed year by year a very high correlation with CO (e.g. between benzene and CO in 1996, Figure 8), indicating that they were emitted from petrol fuelled vehicles. This was expected since the contribution of CO from diesel vehicles was relatively low at Jagtvej and the emission of aromatic VOCs from diesel fuelled vehicles were expected to be unimportant. The main emission of aromatic compounds from diesel vehicles is expected to be heavier hydrocarbons and PAHs.
Urban background
Because benzene was measured at the street only, the urban background concentrations was estimated by the measured urban background concentration of CO. The experimentally determined benzene/CO ratio was used to estimate the benzene concentration at the urban background location. Different ratios have been used for the periods depending on the benzene content in petrol, see chapter 4.
|
Figure 8 The concentrations of benzene versus CO and the concentrations of benzene versus toluene measured as 1 h averages at Jagtvej in Copenhagen, May-December 1996. |
3.2 Air quality measurement programme
Air quality monitoring
Traditional measurements of nitrogen oxides (NOx), O3, CO, and SO2 were performed continuously as ½ hour averages at two sites in central Copenhagen as part of the National Urban Air Quality Monitoring Programme (LMP) (Kemp and Palmgren, 1999). One site, which was established in 1987, is at kerb side about 3 m above ground at the street of Jagtvej; which is a relatively narrow two-lane street (street canyon) with approx. 22,000 vehicles/day of which 6-8% is heavy diesel traffic. The other site, which was established in 1991, is at the roof of a Copenhagen University building (H.C. Ørsted Institute) approx. 20 m above street level and a few hundred meters NE of Jagtvej. This rooftop monitoring site was chosen to provide information on the urban background concentrations in central Copenhagen. At this monitoring site meteorological data from a 10 m mast on top of the building also provided the necessary meteorological data, of which the most important for this purpose are wind speed and direction. The same type of monitoring was routinely carried out at Albanigade in Odense, a street with 1-2 storey houses at both sides. The traffic density here is approximately 20,000 vehicles/day of which 10-12 % is diesel vehicles.
BTX measurements
Continuous monitoring of benzene, toluene, ethylbenzene and xylene was performed by an automatic gas chromatograph (BTX-monitor, Chrompack). The monitor analysed 20-minutes samples every half hour. One hour averages were estimated by two 20 minutes averages per hour. Every fifth day a span gas was added to the monitor to control the stability. It always took place during night time. The uncertainty of the gas concentration was 10% and the uncertainty of the gas supply was estimated to 10%. The general absolute uncertainty is thus estimated to be less than 30%. However, the stability of the instrument probably was better, which means that the trends are estimated much better. These measurements were initiated in 1994 in Copenhagen and in 1997 in Odense. They were performed at the street sites only, Jagtvej and Albanigade.
Traffic statistics
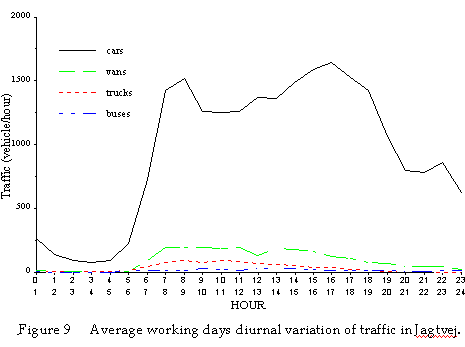
Automatic traffic counts have been carried out by the Danish Road Directorate in 1994/95 at Jagtvej, classified in light and heavy vehicles as 1 hour averages. Supplementary manual traffic counts provided additional split-up of traffic in four vehicle categories: passenger cars, vans, trucks and buses; these data are discussed more in chapter 4. The passenger cars dominate the traffic with a diurnal variation obviously different from the other vehicle categories (Figure 9). At Albanigade there was relatively more diesel traffic than at Jagtvej.
|
Figure 9 Average working days diurnal variation of traffic in Jagtvej. |
3.3 Data analysis
Modelling
Atmospheric pollution dispersion models are usually used for calculation of air quality based on known theoretical relationships between emissions, meteorology and air concentrations. On the other hand, combining model calculations with ambient pollution measurements allows in-situ estimations of emissions.
Considering dispersion in streets of non-reactive or only slowly reactive car exhaust gases, the chemical transformations can be disregarded, and we formulate the problem in the following way,
C = F(meteorology) Q + Cbackground 1
where C is the concentration of a particular pollutant in the street, Q
is the emission of pollutants from the traffic in the street and F(meteorology) is a
function describing dispersion processes.
Cbackground is the contribution to pollution concentrations in the street from
all other sources than the traffic in the street.
Operational Street Pollution Model
The dispersion function F(meteorology) is calculated using a street pollution model, in our case, the Operational Street Pollution Model (OSPM). OSPM describes the dispersion in a street canyon based on meteorological parameters, mainly wind speed and direction above roof tops. In comprehensive tests on measurements from a number of monitoring sites, OSPM has shown to give a satisfactory description of the air pollutant dispersion in urban streets (Berkowicz et al., 1996).
Inverse calculations
The inverse of Equation (1) can be used for calculations of the hourly emissions from the traffic, provided that both street and background concentrations are available on an hourly basis.
Qh = (Ch - Ch,background)/F(meteorology) 2
The index h refers to a particular hour of the day.
Data treatment
Using different regression methods, Equation (2) has been applied to compute emissions from traffic hour by hour, when street and urban background concentrations are known. Modelling and measuring errors as well as unusual traffic and dispersion conditions can lead to "outliers" in the relationship Ch-Ch,background / Fh(meteorology). These outliers were removed using the method described in Rousseeuw and Leroy, (1987). The average hourly emission, Qh, is consequently calculated as the slope of the best-fit-line to the relationship Ch-Ch,background / Fh(meteorology). This is illustrated in Figure 10, where scatter plots of the measured concentrations of benzene versus the model function Fh(meteorology) is shown for hours 7 to 10. The function Fh(meteorology) here corresponds to concentrations calculated by OSPM, but with a unit emission. Both the filtered data as well as "outliers" are shown in Figure 10. The number of "outliers" is normally not larger than a few percent and has small influence on the estimated emissions.
The accuracy increases with increasing number of observations. Taking only working days into account, time series covering 1 year results in about 250 data points for each hour.
Vehicle categories
When detailed traffic counts for various vehicle categories are available, it is possible to determine the total emissions and the emission factors for each category. For a specific hour, h, the total emission can be expressed as 3 where Nk,h and qk are the traffic flow and emission factor for the k’th vehicle category, respectively. The equation forms for each hour of the day a system of 24 equations with the emission factors as the unknown variables.
|
|
Figure 10 The procedure used for estimation of the emissions from traffic from the regression analyses is illustrated for benzene measurements in 1996 for hours 7 - 10 (ending hour). Regression lines obtained using all data are shown by dashed lines, while the regression lines for the filtered data are shown by solid lines. |
|
[Front page] [Contents] [Previous] [Next] [Top] |


