[Front page] [Contents] [Previous] [Next] |
Report from the Sub-committee on Production, Economics and Employment.
5. Results
5.1 Introduction
5.2 The economics of regulating the use of pesticides in
agriculture
5.2.1 Choice of scenarios
5.2.2 Zero and plus scenarios
5.2.3 Effect of different treatment frequency indices
5.2.4 Price sensitivity of the analyses
5.2.5 Pesticide usage and cultivation risk
5.3 Market gardening and forestry
5.3.1 Market gardening
5.3.2 Forestry
5.3.3 Assessment
5.4 Economic valuation of environmental improvements
5.4.1 Savings within drinking water supply
5.4.2 Valuation of health risks
5.4.3 Biodiversity
5.4.4 Summary
5.1 Introduction
Consequences of phasing out pesticides analysed
The main aim of the analyses has been to determine the consequences for production, economy and employment of phasing out pesticides in agriculture. In this connection, it has been found important to clarify the effects at farm, sectoral and societal level, taken together, with a view to determining the consequences for employment and earnings in different sectors and for the possibilities of consumption in society. We have also tried to clarify environment-related economic parameters, such as the costs involved in treating drinking water.
The analyses are divided into two parts: the economics of regulating the use of pesticides in agriculture and the value of the environmental improvements.
5.2 The economics of regulating the use of pesticides in agriculture18
The analyses are based on an integrated concept of analysis
As explained in chapter 4, the analyses are based on an integrated concept of analysis comprising analyses at crop-rotation level, farm level and sectoral and societal level. The economic analyses at farm level are based on a farm model developed at SJFI, while those at sectoral and societal level are based on an adapted version of SJFI’s general equilibrium model. The three components have been linked to ensure consistency between the analyses at the different levels, in that the crop-rotation models are used as the basis for the farm-level analyses, and the farm-level analyses are then used as the basis for the analyses at sectoral and societal level. It is thus possible to give a consistent description of the consequences at different levels of reduction of the use of pesticides.
Unilateral Danish regulation
The analyses are based on unilateral Danish regulation of pesticide consumption; it is assumed that Danish consumers can buy foreign products and that there is free access to import competing farm products, e.g. grain, when economically attractive. As described in chapter 4, the prices of agricultural products produced in Denmark are determined endogenously in the sectoral and socioeconomic analyses, where account is taken of sales in the export markets. The resulting prices are thus determined by supply and demand.
Present hectare payment included
It should also be noted that the EU’s present hectare payment is included in the analyses. The payment is not assumed to affect the intensity of the production (the yield per ha), but helps keep the land in production and is taken into account in the calculation of the economic return. The same applies to the set-aside payment, which increases the incentive to set land aside. Without this payment, Danish crop production would be bigger. With a ban on pesticides, the payment would limit the economic loss because the producers would at any rate be ensured the hectare and set-aside payment.
Different results at different levels
As described in chapter 4, the foci of the analyses at the different levels differ. This means that, even in cases in which the analyses refer to the same level, the different models must be expected to produce different indications for a phase-out. The reasons for these differences lie mainly in the assumptions for the analyses, which will be described in detail in connection with the presentation of the results.
In the following, we will first discuss the chosen scenarios for regulation of pesticide consumption and will then present the main results of the analyses, with the emphasis on providing an overall picture of the relationships analysed. Readers interested in a more detailed discussion of the analyses are referred to the underlying reports by consultants, on which this chapter is based. Lastly, the results of the analyses are summed up and assessed.
5.2.1 Choice of scenarios
Different degrees of phasing out are analysed
The analyses have been built up around a set of scenarios that are intended to show the consequences of different degrees of reduction of pesticide consumption in agriculture. Initially, the purpose was to determine the effects of a total phase-out of pesticides, but a decision was then made also to analyse the effects of less restrictive policies. Guidelines were therefore established for a number of scenarios describing agricultural production with different forms of phase-out (see the box overleaf). With respect to treatment frequency index, the ++scenario corresponds in all essentials to the Pesticide Action Plan from 1986. For a detailed description of the scenarios, readers are referred to the report from the Sub-committee on Agriculture (1999).
The baseline is present production
Present production, which describes present production and present crop rotation at conventional farms, where pesticides are available, has been used as baseline.
The sectoral and socioeconomic analyses cover only the 0-scenario and the +scenario, while the economic analyses at farm level cover all scenarios. The 0+scenario is not included in the analyses because it lies close to the 0-scenario.
Variation in need for treatment
The reason for setting up intermediate scenarios is to examine different degrees of restriction on the use of pesticides. Such an analysis is complicated by the fact that the nature of the treatment and the treatment frequency index vary from crop to crop and by the fact that the type of soil plays a role in the treatment. For example, in winter cereal, it is sometimes necessary to control both monocotyledonous and dicotyledonous weeds with herbicides, while in rape, there is a trend towards using less pesticide by sowing the crop in widely spaced rows and using inter-row cultivation to remove weeds. The biggest use of herbicides is in sugar beet and fodder beet, which are usually sprayed several times a year, while couch grass in the crop rotation is typically treated at intervals of years. The use of insecticides and fungicides similarly varies from crop to crop, with, for example, very frequent spraying against potato blight.
… is reflected by the treatment frequency index
The Sub-committee on Agriculture, with support from farm-level economic research, has calculated the treatment frequency index, expressed as the number of standard doses in different forms of production in the above scenarios. The result can be seen in Table 5.1, which shows the sum of normal doses of herbicides, fungicides and insecticides used. It will be seen that the chosen scenarios describe a gradual reduction in treatment frequency index from present production through the different intermediate scenarios to the 0-scenario. The figures are used in the following as the baseline for comparison of the different scenarios.
| Scenarios 0-scenario (analysed at farm level, sectoral level and societal level) No use of pesticides. 0+scenario (not analysed, see text) The use of pesticides is permitted for crops that would not otherwise be able to meet specific purity requirements or prescribed requirements for combating quarantine pests, cf. the Danish Plant Directorate’s executive orders. +scenario (analysed at farm level, sectoral level and societal level) The use of pesticides is permitted for crops that would otherwise produce a big yield loss or where it is deemed impossible to maintain profitable production without the use of pesticides. For use of pesticides to be permitted, there must be a considerable yield loss (> 15-20 per cent) or the production must be encumbered with such uncertainty that it must be expected to be discontinued or impossible to fit into the crop rotation. ++scenario (analysed at farm level) Basically, serious economic losses from pests compared with present production are not expected in this scenario. The scenario assumes the use of all the present damage thresholds and mechanical weed control, where these methods can compete with the chemical methods. Basically, the same crop rotation is assumed as in economically optimised present production, but with lowest possible use of pesticides. A larger number of man-hours for monitoring are assumed than in present production. Free scenario (analysed at farm level) Model-calibrated present production in the farm-level analyses. Corresponds to present production, but with land use and pesticide use optimised, cf. the analyses in the Farm-level Pesticide Model (FPM). The effect of the other scenarios is measured at farm level in relation to the free scenario. |
Scenarios may be difficult to translate into practical policy
It should be noted that it may be difficult to translate the assumptions for use of pesticides in the different scenarios into regulatory instruments in practice. That applies particularly to the +scenario, which is product-oriented and in which it may be difficult to arrive at the actual treatment frequencies that will ensure against yield losses of more than 15 per cent. However, this is not of any great importance in the present context, where it is not the intention to make concrete policy proposals.
The results of the zero and plus scenarios are given in the following, on the basis of the analyses’ technological and biological assumptions. The economic effects of phasing out pesticides, as they appear from the analyses at farm level and sectoral and societal level, are then described. On the basis of the figures in Table 5.1, the results of the analyses are then summarised in an assessment of the economic costs of different levels of reduction of the use of pesticides.
Table 5.1
Treatment with pesticides, number of standard doses
| Present production | Free1 | ++ | + | Zero | |
| Clayey soil | |||||
| Arable farming | 2.4 | 2.3 | 1.5 | 0.4 | 0.0 |
| Dairy farms | 1.9 | 1.6 | 0.9 | 0.3 | 0.0 |
| Pig farms | 2.5 | 2.1 | 1.3 | 0.4 | 0.0 |
| Arable farms with beets | 2.8 | 2.8 | 1.8 | 0.7 | 0.0 |
| Arable farms with seeds | 2.4 | 2.3 | 1.5 | 0.7 | 0.0 |
| Sandy soil | |||||
| Arable farming | 1.8 | 1.1 | 1.0 | 0.3 | 0.0 |
| Dairy farms2 | 1.4 | 1.0 | 0.6 | 0.2 | 0.0 |
| Pig farms | 1.9 | 1.7 | 1.3 | 0.3 | 0.0 |
| Arable farms with potatoes | 3.9 | 1.6 | 2.6 | 0.5 | 0.0 |
Note: Except for present production, the figures include set-aide.
1
Model-calibrated Present Production. Corresponds to present production but with optimised use of land and pesticides as calculated in the Farm-level Pesticide Model.2 Extensive operation
Source: �rum (1999)
5.2.2 Zero and plus scenarios
Zero and plus scenarios Phasing out of pesticides would require considerable restructuring of production
Analyses carried out by the Sub-committee on Agriculture (1999) show that, from an agronomic point of view, it is possible to design crop rotations that can be practised without use of pesticides on most types of soil. In practice, there would be considerable barriers to using such crop rotations and farms would have to be radically restructured in relation to present production. For example, the amount of winter cereal grown would have to be significantly reduced (to max. 40 per cent of the crop rotation) in order to reduce grass weed problems and second crops would have to be inserted when growing spring cereal in order to fulfil the requirement of winter-green fields. In addition, a wide range of cultural measures would be needed in order to minimise pest problems.
One of the main questions in connection with reducing the use of pesticides is the effect this would have on yield levels and consumption of means of production in farming and thus on the economy of the sector. It is also important to know the effect on employment in farming and upstream and downstream industries and the derivative economic effects on the rest of the economy in order to assess the total cost to society. These questions are discussed in the following.
Yield
Yield losses in all crops …
Yield losses must be expected in all crops if they are to be grown without the use of pesticides. The Sub-committee on Agriculture has found that a 27-29 per cent lower yield must be expected in wheat in the 0-scenario (Table 5.2) as a consequence of leaf diseases, increased pressure of weeds, damage to crops in connection with harrowing, insect attack, changed sowing time and the use of more resistant varieties with lower yields. Considerably lower losses are expected in winter rape, while the yield in seed grass is expected to be halved owing to weed problems and difficulties in removing weed seed without the use of pesticides. The yield in sugar beet is expected to fall by around 14 per cent, while in potatoes, a loss of 40-45 per cent must be expected, mainly due to potato blight. The yield in peas must be expected to fall by about one fifth.
Table 5.2
Yield losses with different phasing-out of pesticides, per cent
--------- 0-scenario ------- |
-------- +scenario ------- |
|||
Clayey soil |
Sandy soil |
Clayey soil |
Sandy soil |
|
Winter wheat |
29 |
27 |
17 |
15 |
| Spring barley | 19 |
17 |
14 |
12 |
| Winter rape 7 7 6 6 | 7 |
7 |
6 |
6 |
| Grass seed | 50 |
50 |
2 |
2 |
| Sugar beet | 14 |
- |
- |
- |
| Ware potatoes | - |
43 |
- |
11 |
| Starch potatoes | - |
42 |
- |
13 |
| Seed potatoes | - |
43 |
- |
8 |
| Peas | 21 |
21 |
12 |
12 |
Source: The Sub-committee on Agriculture (1999)
Somewhat smaller losses are assumed in the +scenario – 15-17 per cent in winter wheat and 12-14 per cent in barley. The fall in the yield in rape is slightly smaller than in the 0-scenario, while in potatoes, it is between 8 and 13 per cent. The yield in peas is estimated to fall by 12 per cent.
… but considerable variation from crop to crop
In practice, there would be considerable variations in the yield losses, and this would be exacerbated by the fact that weeds can propagate in years with low yields. The figures given in Table 5.2 have also been used as the basis for the sectoral and socioeconomic analyses of the consequences of phasing out pesticides.
Land use
Agronomic criteria ...
On the basis of agronomic criteria, the Sub-committee on Agriculture has assessed land use in the case of a complete phase-out of pesticides. In its analyses, crop rotations without use of pesticides are set up for selected types of farm in present production. The results are then scaled up to a total for the whole country.19 The result is shown in Figure 5.1, from which it will be seen that, for technological and biological reasons, one must expect farmers to switch from winter cereal to spring cereal and rape and to phase out fodder beet, replacing them with peas, wholecrop and grass in rotation. In the analyses, the acreage with potatoes, seed grass and sugar beet is retained in order to show the consequences of a phase-out for these pesticide-intensive crops.20 The set-aside acreage is assumed to be unchanged.
… set the framework for changes in land use
It is important to note that the above-mentioned figures are not an estimate of how land use can be expected to develop if pesticides are phased out, but simply an example of the scope for changes within the agronomic framework. The actual change in land use would depend on how farmers reacted to a ban on pesticides. The agronomic assumptions naturally limit the possibilities of restructuring, but the result would depend on what was economically viable.
Switch from winter to spring cereal; reduction of acreage with special crops; increase in acreage with greenfeed
The analyses based on the Farm-Level Pesticide Model (FPM), which is based on optimisation of the gross margin in crop production21, show that considerable changes must be expected in land use on both clayey and sandy soil in both scenarios (Table 5.3). It will also be seen that the acreage with winter cereal is expected to fall, while the acreage with spring cereal is expected to rise, which harmonises well with the agronomic assumptions in Figure 5.1. Rape and peas would be unable to compete economically at arable farms, while the acreage with peas, in particular, would increase at dairy farms. The acreage with special crops (sugar beet, potatoes and seed) is expected to fall on clayey soil, while the acreage with feed crops rises. It will also be seen that a considerable increase in voluntary set-aside must be expected at arable farms on clayey soil.
Figure 5.1 Look here!
Land use based on agronomic assumptions
Source: Sub-committee on Agriculture (1999, p. 105)
Support for set-aside increases the set-aside acreage
The picture is much the same for farms specialising in sugar beet, seed and potatoes. Farmers would switch from winter cereal to spring cereal and reduce the acreage with special crops. At the same time, the set-aside acreage would increase considerably, reflecting the fact that it is difficult for crop production to compete when farmers are paid to take land out of production.
As described in chapter 4, the farm-level analyses include assumptions concerning upper and lower limits for set-aside. It is thus assumed that set-aside at farm level must be at least 10 per cent and maximum 33 per cent of the acreage with reform crops, including set-aside. However, since dairy farmers and pig farmers must be able to get rid of their manure, it is assumed that set-aside must not exceed 10 per cent at such farms. Consequently, the set-aside acreage rises only slightly there.
Partial versus total optimisation
As mentioned, the farm-level analyses are based on maximisation of the gross margin in arable farming, which includes hectare payments. The analyses are partial analyses in the sense that account is not taken of possible changes in livestock production (the herd size is kept constant in the model) and that changes in price relations in agriculture would have to be expected if such drastic action as banning the use of pesticides were taken. Such changes are not included in the analyses. These factors are captured in the sectoral and socioeconomic analyses, where the interaction between agriculture and other sectors is built into the general equilibrium model (AAGE), and where account is also taken of changes in foreign trade (cf. chapter 4). The model makes it possible to describe the restructuring in agriculture, although at a somewhat more aggregated level than in the farm-level model.
Table 5.3 Look here!
Land use, farm-level analyses, per cent
Fall in production intensity
… is an expression of potential set-aside
When account is taken in the sectoral and socioeconomic analyses of the interaction with other sectors and feedback effects in the form of changes in the price relations in agriculture, we get a reduction of 62,000 ha (4 per cent) in the total cereal acreage, while the rape acreage increases by 20,000 ha (11 per cent) in the 0-scenario (Table 5.4). Here, the hectare payments affect the result because they limit the fall in the price of land and help to keep a large part of the acreage in production of cereal and rape. However, as a consequence of lower yield levels, production intensity would fall when pesticide consumption was reduced, i.e. on some of the land, production of cereal and rape would be extensified. As explained in chapter 4, it is not possible in the macroeconomic model to separate set-aside from extensive production. The small fall in cereal acreage would thus presumably mean that, in practice, farmland would be set aside when pesticides could no longer be used. This accords well with the farm-level analyses, which, as mentioned, show that set-aside must be expected to increase at arable farms on clayey soil (Table 5.3).
Table 5.4
Change in land use, socioeconomic analysis, 1,000 ha
| 1992 level | 0-scenario | +scenario | |
| Cereals | 1612 | -62 | -71 |
| Rape | 181 | 20 | 7 |
| Potatoes | 54 | -29 | -27 |
| Sugar beet | 65 | -34 | 6 |
| Greenfeed | 693 | 105 | 85 |
| Total | 2605 | 0 | 0 |
Source: Jacobsen & Frandsen (1999, Table 5.3)
Different development in zero- and +scenarios
It will also be seen from the table that the acreage with potatoes and sugar beet is expected to halve in the 0-scenario, while in the +scenario, the acreage with sugar beet increases. The fall in the 0-scenario must be seen in the light of the lower yield and of the fact that no hectare payment is made for potatoes and sugar beet, making it difficult for these crops to compete with cereal and rape for acreage. The increase in sugar-beet acreage in the +scenario mainly reflects the fact that some use of pesticides is permitted. The acreage with greenfeed, which here covers fodder beet, wholecrop and grass in and outside the crop rotation, is expected to increase considerably. This covers a fall in the acreage with fodder beet and an increase in the acreage with wholecrop and grass, which have only a limited need for pesticides.
Consumption of fertiliser and supply of nitrogen
The models used have not been specifically developed to describe the fertiliser balance in agriculture. However, the macroeconomic model takes explicit account of the agronomic relationship between change in production and use of fertiliser, in that the use of fertiliser is closely related to the size of the production, as described in section 4.3. As mentioned, the analyses are based on long-term restructuring, in which the requirement of harmony between number of livestock and acreage is assumed to be met through regional reallocation of the production. It is assumed that, in the long term, such restructuring would be without cost. In the short to medium term, there may be regional constraints on the relationship between production and acreage that will affect the costs in livestock production. Such constraints may affect the restructuring of production and limit the fall in crop production.
Considerable reduction in the consumption of bought-in fertiliser ….
As will be seen from Table 5.5, the demand for nitrogen in artificial fertilisers falls in all crops in the 0-scenario, while the supply of nitrogen in manure rises slightly (mainly because of a bigger pig production). In all, the use of artificial fertilisers is expected to fall by 63 per cent in the 0-scenario, while the total use of nitrogen falls by 41 per cent, primarily due to lower production. It will be seen from the table that the fall in total demand would be accompanied by extensive substitution of manure for artificial fertilisers.
The corresponding analyses for the +scenario show a somewhat smaller fall in the consumption of artificial fertilisers, especially in cereals, sugar beet and greenfeed (Table 5.6). Consumption of artificial fertilisers is expected to fall by 29 per cent, while total fertiliser consumption falls by 19 per cent.
In this case, too, there would be substitution of manure for artificial fertilisers.
Table 5.5
Change in consumption of fertiliser and supply of nitrogen (0-scenario), per cent
Artificial fertilisers |
Manure |
Nitrogen, total |
|
| Cereals | -72 | -41 | -64 |
| Rape | -97 | -95 | -97 |
| Potatoes | -63 | -23 | -57 |
| Sugar beet | -64 | -26 | -55 |
| Greenfeed | -29 | 48 | 12 |
| Total | -63 | 1 | -41 |
Source: Jacobsen & Frandsen (1999, Table 5.4)
Table 5.6
Change in consumption of fertiliser and supply of nitrogen (+scenario), per cent
| Artificial fertilisers | Manure | Nitrogen, total | |
| Cereals | -30 | -13 | -25 |
| Rape | -95 | -94 | -95 |
| Potatoes | -53 | -41 | -51 |
| Sugar beet | -4 | 20 | 1 |
| Greenfeed | -4 | 20 | 9 |
| Total | -29 | 1 | -19 |
Source: Jacobsen & Frandsen (1999, Table 5.5)
… but rising intensity of fertilisation
A comparison of the above-mentioned changes in fertiliser consumption and the changes in production mentioned later (Table 5.9) shows a generally smaller fall in fertiliser consumption than in crop production. For example, in the 0-scenario, cereal production falls by 70 per cent, while consumption of nitrogenous fertiliser falls by 64 per cent (Table 5.5) and consumption of nitrogenous fertiliser for greenfeed rises by 12 per cent even though production falls by 1 per cent (Table 5.9). The same picture appears in the +scenario, although the changes are smaller here. The rising intensity of fertilisation is a consequence of the agronomic assumptions on which the analyses are based, as indicated in Table 4.3.22
Need to move manure could increase the costs
The above factors naturally raise the question of whether manure could be sold locally or would have to be moved over long distances. In this connection, it must be borne in mind that the macroeconomic model is based on long-term restructuring, with the possibility of moving production if there is a need for that. However, that does not mean that difficulties would not arise in the shorter term in fulfilling the Aquatic Environment Plan’s harmony requirements in localities with a high livestock density, with consequent costs in connection with the transportation of manure over long distances. Such costs would affect the economic yield in livestock production and increase the competitiveness of, say, cereal production.
Employment in primary agriculture and processing
Employment falls in primary agriculture …
Phasing out pesticides in farming would generally affect employment in primary agriculture and the associated industries. The effect would be felt mainly in primary arable farming, where employment would fall by more than 55 per cent in the 0-scenario and by almost 30 per cent in the +scenario (Table 5.7). The fall is primarily a result of lower production, even when allowance has been made for the need for extra manpower for manual weeding of the crops, which means, for example, that manpower consumption in the production of sugar beet would rise despite falling acreage and production.
Table 5.7
Employment effect, farming and processing, 1992-level
| Change, % | ||
0-scenario |
+scenario |
|
| Primary agriculture | -18 |
-10 |
| Cash crops | -57 |
-29 |
| Cattle and greenfeed | 4 |
1 |
| Pigs and poultry | 6 |
3 |
| Processing | -1 |
1 |
| Abattoirs | 3 |
1 |
| Dairies | 1 |
0 |
| Sugar mills | -71 |
-7 |
| Total | -14 |
-7 |
| Change in number of full-time employees, total | -16.238 |
-8.058 |
Note: The calculations are based on unchanged total employment, i.e. the manpower
released in the agricultural sector would find employment in other sectors.
Source: Jacobsen & Frandsen (1999, Table 5.6)
…and in the sugar mills …
The fall in sugar beet production is reflected in the sugar mills’ employment, which can be expected to fall by around 70 per cent in the 0-scenario compared with 7 per cent in the +scenario. In the livestock sector, on the other hand, production would rise, with a knock-on effect on employment in abattoirs and dairies. In all, it is estimated that employment in agriculture etc. would fall by over 16,000 full-time employees (1992-level) in the 0-scenario (14 per cent) and by over 8,000 full-time employees in the +scenario (7 per cent). Most of the reduction would be in primary agriculture.
… and in related industries
Besides the above-mentioned job losses, employment would fall in other industries, including those directly associated with agriculture.
Economic result at farm level
Farm-level economic analyses
One of the main questions relating to reducing the use of pesticides in farming is the extent to which that would affect earnings and production in the sector. As stated above, a considerable fall in the level of yield would have to be expected in arable farming, and even if the optimum use of fertilisers were reduced, a lower land rent would have to be expected – a situation that would be aggravated by the fact that more labour is required for farming without pesticides.
Considerable fall in the gross margin in the 0-scenario
…reflected in a lower land rent
Analyses based on the Farm-level Pesticide Model (FPM) shows that a ban on the use of pesticides (0-scenario) would reduce the gross margin by 34 per cent on clayey soil and by 24-28 per cent on sandy soil for general forms of production – arable farming, dairy farming and pig farming – but with a somewhat bigger reduction in specialised crop production (Table 5.8). The reduction would generally be biggest at farms producing sugar beet and potatoes, where the return is estimated to fall by 39 per cent and 51 per cent, respectively. The fall in gross margin would largely be reflected in a lower land rent (cf. the footnote to the table). The calculation is based on all other input factors (including manpower) being remunerated at unchanged prices and on agricultural product prices not being affected by the intervention. Nominally, the economic return at dairy farms would be less affected by a ban on the use of pesticides than at other forms of production, but in percentage terms, the fall largely corresponds to arable farms and pig farms.
Significantly smaller losses in the +scenario
In the +scenario, the reduction in the gross margin would be considerably smaller. On clayey soil, the return at arable farms would be reduced by 15-23 per cent compared with present production, while the fall on sandy soil would vary between 8 and 16 per cent, depending on the form of production. For farms specialising in potato growing, the fall would be reduced from 51 per cent in the 0-scenario to 15 per cent in the +scenario. The loss in dairy farming would be 26 per cent on clayey soil and 15 per cent on sandy soil.
In connection with the economic analyses at farm level, the results have been scaled up to sectoral level by weighing the change in gross margin in the different farm categories with the number of farms in the categories. Since, as stated earlier, the analyses are focused on clayey and sandy soil, there is a residual group (representing about half the total agricultural acreage) on mixed soil that is not directly included in the analyses. Of this group, 30 per cent are assumed to be full-time farms in counties with mixed soil and 20 per cent part-time farms spread over the whole of the country.
The analyses show that a fall in gross margin of DKK 2.5 billion (33 per cent) must be expected in the 0-scenario, compared with DKK 1.3 billion (17 per cent) in the +scenario, with most of the losses in cereal production.
Table 5.8
Economic result at farm level, change in gross margin1
0-scenario |
+scenario |
|||
| DKK per ha | % | DKK per ha | % | |
| Clayeysoil | ||||
| Arable farms | -1,130 | -34 | -640 | -19 |
| Dairy farms | - 890 | -34 | -660 | -26 |
| Pig farms | -1,030 | -34 | -540 | -18 |
| Beet production | -1,700 | -39 | -1,000 | -23 |
| Seed production | -1,420 | -35 | -610 | -15 |
| Sandy soil | ||||
| Arable farms | - 600 | -26 | -180 | -8 |
| Dairy farms2 | - 540 | -24 | -340 | -15 |
| Pig farms | - 660 | -28 | -370 | -16 |
| Potato production | -1,980 | -51 | -560 | -15 |
1
The analysis concerns gross margin II, which covers building and land rent. Since building stock is not included in the analysis, the figure can be taken as the land rent. The change is measured in relation to the free scenario (model-calibrated present production).2 Extensive dairy farming
Source: �rum (1998)
Sectoral economic analyses
… takes interaction with other sectors into account
The analyses of the economy of the agricultural sector are based on the general equilibrium model (AAGE), which can be used to illuminate the economic consequences for the sector as a whole and for different production sectors. Unlike the analyses at farm level, which, as mentioned, are based on fixed product and factor prices, the AAGE model includes the interaction with other sectors in the economy and foreign trade, which means that account is taken of changes in supply and demand in the product and factor markets and the consequent changes in prices.
0-scenario
Big fall in cereal production …
A ban on the use of pesticides in farming would have a marked effect on production costs and thus on the Danish agricultural sector’s ability to compete internationally. As shown in Table 5.9, cereal production would fall by 70 per cent. The reason for this is considerable yield losses combined with poorer profitability in cereal production23 because assumed intense international competition would not allow price rises without significant, negative consequences for export and import of cereals. Cereal exports would thus fall by almost 90 per cent, while cereal imports would rise by 275 per cent.
… and in rape production
In the case of rape, exports and production would fall by 100 per cent and 98 per cent, respectively, while the price ex farm would rise by 4 per cent. Rape production would thus largely disappear, and the industry would replace rape produced in Denmark with imported rape, which would rise by more than 500 per cent.
Small fall for potatoes …
Production of potatoes would fall by 69 per cent, exports would disappear, and the price to the farmer would increase by 22 per cent. These effects cover complete discontinuation of production of industrial potatoes because of the assumed intense international competition for these varieties and a moderate reduction in supplies of ware potatoes for private consumption. The reason for the moderate reduction in private consumption of Danish potatoes is an assumption of less intense international competition (the consumers prefer Danish potatoes).
Table 5.9
Change in agricultural prices and production, in per cent
0-scenario |
+scenario |
|||
| Prices | Production | Prices | Production | |
| Cereals | 2 | -70 | 1 | -32 |
| Rape | 4 | -97 | 4 | -95 |
| Potatoes | 22 | -69 | 2 | -54 |
| Sugar beet | 30 | -63 | 3 | -6 |
| Greenfeed | -8 | -1 | -4 | -0 |
| Milk | 0 | 0 | 0 | 0 |
| Beef | 0 | 0 | 0 | 0 |
| Pork | -1 | 3 | -1 | 2 |
| Poultry | -1 | 1 | -0 | 1 |
Note: The changes are measured in relation to present production.
Source: Jacobsen & Frandsen (1999, Tables 5.1 and 5.2)
… and sugar beet
Although sugar beet is the production that would suffer the biggest additional costs per produced unit in the event of a total ban on the use of pesticides, the fall in production would be smaller than in the case of cereals and rape. There are several reasons for this. Firstly, there is almost no import of sugar beet, i.e. the production of sugar beet is not affected by the international competition (prohibitive transport costs). Secondly, sugar beet accounts for a relatively small proportion of the sugar mills’ costs, which means that a rise in the price of the primary product would have only a limited effect on their unit costs.
Slight rise in livestock production
A pesticide ban would have relatively limited effects in the livestock sectors. The costs in the greenfeed sector would fall as a result of lower land prices, which it is estimated would reduce the price of greenfeed by around 8 per cent. The consequently lower costs in dairy farming would increase the competitiveness of milk production, but milk production (and beef production) would not change owing to the milk quota.
For both pork and poultry production, falling input prices would lead to lower unit costs, causing production to rise.
As mentioned earlier, the big fall in crop production must be seen in the light of the fact that this is a long-term restructuring, with an assumption of no barriers to restructuring of production, either at the individual farm or regionally. In the shorter term, requirements concerning harmony between number of animals and acreage could increase the cost of restructuring livestock production, which would impair greenfeed’s ability to compete for acreage. Such restrictions might therefore help to reduce the pressure of supply in the livestock sector while limiting the fall in the production of, for example, cereals and rape.
Higher milk-quota value
For the industries processing livestock products, there would be generally beneficial effects on production and foreign trade. The biggest effect would be found in the pork and poultry sectors, where production could be increased, while the better economy in milk production would mainly be reflected in a higher value of the milk quota.
+scenario
In the +scenario, the possibility of limited use of pesticides means that the crop sectors’ costs would increase less, with a consequently smaller fall in production than in the case of a complete phase-out of pesticides. In this case, cereal production would be reduced by just
Considerable fall in production of cereals, rape…
over 30 per cent, which would mean a 50 per cent reduction in cereal exports compared with present production and a considerable rise in cereal imports. In this case, too, rape production would largely disappear.
… and potatoes …
Potato production would fall by 54 per cent, while the price would rise by 2 per cent, compared with 22 per cent in the 0-scenario. The more limited effect on the price is due to a lower input, combined with falling factor prices, which would together lead to a limited increase in unit costs. In this scenario, too, production of industrial potatoes would be discontinued.
… but only small fall in production of sugar beet
Sugar beet is the production that would be least affected in the +scenario, falling by only 6 per cent. The explanation for this is that, as mentioned, sugar beet accounts for only a small part of the sugar mills’ costs, making it possible for the mills largely to maintain their international competitiveness despite paying slightly higher prices to the producers.
Livestock production unaffected
For the livestock sectors, the +scenario would have only a limited effect on prices and production, and for largely all processing sectors, exports would rise slightly and imports fall slightly.
0-scenario: big fall in gross factor income in farming
The result of the above-mentioned changes would be a real fall in gross factor income in primary agriculture of DKK 3.4 billion in the 0-scenario, corresponding to a 15 per cent fall (Table 5.10). Most of the fall would occur in crop production, with cereals alone accounting for a fall of DKK 3.0 billion. Apart from the sugar mills, the processing sectors would be relatively little affected by a pesticide ban. It is estimated that gross factor income at the sugar mills would fall by DKK 1.4 billion, mainly as a result of falling production of sugar beet in Denmark. In all, it is estimated that gross factor income in primary agriculture and the processing industry would fall by DKK 4.5 billion.
Table 5.10
Change in gross factor income in farming and processing, fixed GNP prices
0-scenario |
+scenario |
|||
| DKKm | % | DKKm | % | |
| Primary agriculture | ||||
| Crop production | -3,950 | -41 | -2,064 | -21 |
| Livestock production | 503 | 4 | 259 | 2 |
| Total | -3,447 | -15 | -1,805 | -8 |
| Processing | ||||
| Dairies | 29 | 1 | 12 | 0 |
| Abattoirs | 304 | 3 | 137 | 1 |
| Sugar mills | -1,424 | - 70 | -140 | -7 |
| Total | -1,091 | - 6 | 9 | 0 |
| Total | -4.538 | - 11 | -1.796 | -4 |
Note: All amounts are given in 1992-prices. A model-calculated fall in the GNP
deflator of 1.63 per cent is used in the 0-scenario and 0.64 per cent in the +scenario as
the basis for the conversion into fixed GNP-prices.
Source: Jacobsen & Frandsen (1999, Table 5.7)
+scenario: fall in gross factor income in agriculture halved
The corresponding analyses for the +scenario show a fall in gross factor income of DKK 1.8 billion (8 per cent), of which cereals alone account for DKK 1.5 billion. Gross factor income in the livestock sectors would rise and there would also be a small rise in the processing sectors because a fall in the sugar mills would be more than balanced by a rise in the processing of livestock products.
The above-mentioned changes in gross factor income reflect a reduction in the agricultural sector’s contribution to income formation in society (return on labour, capital and land). The fall is a result of the phasing-out of pesticides reducing productivity in the sector and thus impairing the sector’s possibility of competing for capital and manpower. Capital and manpower would migrate from agriculture and are assumed in the analyses to be employed in other sectors, although at lower real wages. For farming, that means that wages would fall in line with other sectors. In other words, the remaining manpower would suffer a loss of income. In addition, established farmers would suffer a capital loss in the form of falling land rent, and there could also be changes in the value of, for example, the milk quota.
Land rent falls while value of milk quota rises
In Table 5.11, the fall in gross factor income in agriculture is broken down between land, capital, manpower and milk quota. As a consequence of lower production costs in the dairy sector, the milk quota would rise by DKK 702 million in the 0-scenario and by DKK 380 million in the +scenario, while land rent would fall by DKK 470 million (13 per cent) and just under DKK 295 million (8 per cent), respectively. These figures must be compared with the loss of income in agriculture as a consequence of the fall in real wages.
Table 5.11
Breakdown of change in gross factor income in agriculture, DKK mill. in fixed
GNP-prices
| Land | Capital | Manpower | Quota | Total | |
| 0-scenario | -470 | -2,003 | -1,675 | 702 | -3,447 |
| +scenario | -295 | -1,020 | -871 | 380 | -1,805 |
Note: All amounts are given in 1992-prices. A model-calculated fall in the GNP
deflator of 1.63 per cent is used in the 0-scenario and 0.64 per cent in the +scenario as
the basis for the conversion into fixed GNP-prices.
Source: Jacobsen & Frandsen (1999, Tables 5.8 and 5.9)
It will be seen directly from this that action against pesticide consumption would result in a redistribution of capital between arable farmers and dairy farmers.
Fixed factors increase the loss
As stated earlier, scaling up the changes in gross margin at farm level results in a loss for the sector, measured in 1992 kroner, of just under DKK 2.5 billion in the 0-scenario (33 per cent loss) and DKK 1.3 billion (17 per cent) in the +scenario, which can be taken as an expression of a fall in land rent. The economic loss at farm level would thus be five time the above-mentioned falls in land rent of DKK 480 million and DKK 295 million. Such a difference is only to be expected because the farm-level analyses are based on fixed product and factor prices and on unchanged livestock production, while the socioeconomic analyses take into account the possibility of savings in agriculture through restructuring of production and the industry’s price relations. The analyses thus underline the fact that agriculture’s loss would depend greatly on the assumptions used with respect to the mobility of the means of production and the length of the restructuring period.
Released manpower results in fall in real wages
The above-mentioned changes in agriculture would affect other sectors through a release of resources and a fall in the demand for capital goods. This would be felt most in the sectors associated with agriculture, such as agricultural service and production of commercial fertilisers, in which there would be a marked fall in home market production. Of greater importance, however, would be the indirect effects through the release of manpower, which, as mentioned, would directly reduce the general level of pay. With the above-mentioned conditions, it has been found that wages would have to fall by about 1 per cent in the 0-scenario and by 0.4 per cent in the +scenario for the released manpower to find employment in other sectors.
Increased production in export industries
… but a fall in home-market industries
A fall in real wages would, on the one hand, improve competitiveness in sectors exposed to competition, resulting in increased net exports of goods and services. On the other hand, falling real wages would reduce domestic demand. That would hit particularly the home-market industries, which do not have the same possibility of selling for export. The interaction between the change in supply and demand would be reflected in falling product prices for most industries of the order of magnitude of 1-2 per cent in the 0-scenario and around 0.5 per cent in the +scenario. However, while the export-oriented industries would generally be able to increase production, production would fall in a number of home-market industries.
Table 5.12
Chance in gross factor income, fixed GNP prices
| 0-scenario and +scenario | GFI 1992 level | ||||
| DKKm | DKKm | % | DKKm | % | |
| Primary agriculture and processing Building and construction, commerce, servicesand housing |
41,001 | -4,538 | -11 | -1,796 | -4 |
| 332,401 | -3,739 | -1 | -1,495 | -0 | |
| Other sectors | 390,140 | 2,829 | 1 | 880 | 0-{}- |
| Total | 763,542 | -5,448 | -1 | -2,410 | -0 |
| Product taxes and subsidies | 124,326 | -1,549 | -1 | -649 | -1 |
| Gross national product | 887,868 | -6,998 | -1 | -3,059 | -0 |
Note: All amounts are given in 1992-prices. A model-calculated fall in the GNP
deflator of 1.63 per cent is used in the 0-scenario and 0.64 per cent in the +scenario as
the basis for the conversion into fixed GNP-prices.
Source: Jacobsen & Frandsen (1999, Table 5.12)
For example, it has been found that gross factor income in the sectors building and construction, commerce, services and housing, taken together, would be reduced by DKK 3.7 billion in the 0-scenario and by DKK 1.5 billion in the +scenario (Table 5.12), while the total fall in gross factor income would amount to DKK 5.4 billion and DKK 2.4 billion, respectively.
Adjusted for charges and duties, this corresponds to a reduction in gross national product, measured in fixed GNP prices, of DKK 7.0 billion in the 0-scenario and DKK 3.1 billion in the +scenario.
Socioeconomic consequences
From a socioeconomic angle, it is the consequences for GNP, real consumption, capital and investments, and exports and imports, that are of interest. As stated earlier, it is assumed in the analyses that total employment would remain unchanged because of flexible pay formation. With the requirement of equilibrium in the balance of payments, this means that the consequences of phasing out pesticides would be changes in the above-mentioned variables. It is also assumed in the analyses that savings in society develop in line with total investments.
Considerable fall in consumption and investment
The main measure of the welfare-related economic consequences is changes in private consumption. As a consequence of lower real wages, disposable income would be reduced, with negative consequences for consumption. Assuming that public consumption was unaffected, real private consumption would fall by DKK 7.6 billion (1.7 per cent) in the 0-scenario compared with DKK 3 billion (0.7 per cent) in the +scenario (Table 5.13). This corresponds to DKK 1,500 and DKK 600 per capita, respectively, measured in 1992 prices24. Investments would go down by just under DKK 2 billion in the 0-scenario and by DKK 950 million in the +scenario.
Measured in fixed prices, GNP would fall by DKK 7.3 billion (0.8 per cent) in the 0-scenario, compared with DKK 3.1 billion in the +scenario (0.4 per cent). When this is compared with the aforementioned changes in pesticide usage (Table 5.1), it will be seen that DKK 4.2 billion could be saved by going from a total phase-out to limited use of pesticides corresponding to an increased treatment frequency of 0.2-0.7 standard doses per ha.
Improved balance of trade …
As far as the consequences for foreign trade are concerned, total Danish real exports in the 0-scenario would increase by slightly less than DKK 6.4 billion, while real imports would increase by DKK 3.8 billion. The growth in exports of other goods and services as a consequence of improved competitiveness in other sectors than agriculture would thus fully make up for the smaller Danish agricultural exports. On the import side, rising agricultural imports would make up for lower imports of other products.
Table 5.13
Change in gross national product, quantities
Zero and + scenarios |
||||
| DKKm | % | DKKm | % | |
| Private consumption | -7,600 | -1,7 | -3,301 | -0,7 |
| Public consumption | 0 | 0.0 | 0 | 0.0 |
| Investments | -1,980 | -1.2 | -950 | -0.6 |
| Stock changes | 0 | 0.0 | 0 | 0.0 |
| Export | 6,354 | 2.0 | 1,589 | 0.5 |
| Imports | 3,825 | 1.4 | 531 | 0.2 |
| Total | -7,281 | -0.8 | -3,108 | -0.4 |
Note: Gross national product is equal to the sum of private and public consumption
plus investments, stock changes and exports less imports. Gross national product is
expressed in quantities, which means that the figures do not sum to the total and that the
total figures differ from the gross national product in fixed gross national prices in
Table 5.12. All amounts are given in 1992 prices.
Source: Jacobsen & Frandsen (1999, Table 5.13).
… despite impaired terms of trade
The terms of trade (calculated as the ratio between the development of export and import prices) would fall by 1 per cent due to falling export prices, in that it is assumed that import prices would remain unchanged. The picture in the +scenario is the same except for a far smaller increase in the volume of exports and imports.
Global phase-out of pesticides
As mentioned, the analyses here are based on unilateral Danish regulation of pesticide usage, with the assumption that Danish consumers and manufacturers have free access to purchase conventional foreign products and capital goods at internationally determined market prices, and that consumers do not prefer pesticide-free products. As shown above, this means that cereals produced in Denmark would be replaced by imported, conventional, foreign cereals, which would make it possible to maintain Danish livestock production at a largely unchanged level.
… would reduce the supply of agricultural products …
… resulting in further losses
If similar regulation of pesticide usage were implemented in and outside the EU, the same trend could be expected in other countries, i.e. the supply of cereals would be reduced globally. Such a development would result in an increase in the price of cereals and thus improve the competitiveness of non-pesticide cereals produced in Denmark. However, it would also increase production costs in livestock production – especially pork and poultry production – which would thus be less able to compete. In a global context, such a development would increase food prices with consequent financial loss for the consumers and restructuring of production within and outside agriculture, as described above.
It is not possible to estimate the economic consequences of a global restriction of pesticide usage with the present analytical tools. One could – as has been done in the organic scenarios – analyse a situation in which a ban is imposed on increased importation of traditionally produced cereals (the calculations in question indicate which results one would get). However, that is a very unsatisfactory way of modelling a global reduction of pesticide usage. A satisfactory model would require expansion of, for example, SJFI’s global trade model25 in a number of areas, which is outside the scope of this study. However, a global ban on the use of pesticides in agriculture must be expected to result in substantial socioeconomic losses, while a partial phase-out could probably be absorbed more easily within the framework of a continuous economic adjustment of the structure of industry, where the development of new technology could help to facilitate the restructuring process.
Summary
The purpose of the analyses carried out is to determine the economic consequences and employment consequences of a total or partial phase-out of the use of pesticides. In this connection, importance has been attached to determining the consequences for both primary agriculture and for the agricultural sector and the national economy, taken together, with a view to clarifying the consequences for employment and earnings in different sectors and for consumption in society.
The analyses cover a total phase-out (0-scenario) and a partial phase-out (+scenario) of pesticides. The latter analyses are intended to show the situation in which limited use of pesticides is allowed for the production of crops that would otherwise result in big yield losses or be discontinued.
The analyses are based on assumptions concerning yield losses and cultivation practice in present production and in the event of a phase-out of pesticides. The yield losses thereby calculated are used as the basis for analysing land use and pesticide usage and the economic return at farm level, assuming partial optimisation of the return in crop production. The analyses have also been used as the basis for fixing the technological and biological assumptions for the analyses at sectoral and societal level. This linkage of the concept of analysis ensures a consistent description of the consequences at different levels of phasing out pesticides.
The assumptions for the socioeconomic analyses are: equilibrium in the national economy; development of savings in line with total investments; and unchanged total employment due to flexible pay formation. Together with the requirement of equilibrium on the balance of payments, this means that phasing out pesticides would lead to changes in total consumption, investments and foreign trade. Since the analyses are based on long-term restructuring, they do not say anything about the effects that could occur in the short or medium term, where there would be restructuring costs.
The analyses show that a total phase-out of pesticides would result in major costs to society and that, even in the case in which use of pesticides, would be permitted for crops that were heavily dependent on chemical control, limiting the use of pesticides would result in considerable losses. All in all, a total phase-out of pesticides (0-scenario), would result in a fall in gross national product of DKK 7.3 billion (0.8 per cent) in real terms, while limited use of pesticides (+scenario) would result in a real loss of DKK 3.1 billion (0.4 per cent) in relation to present production.
According to the analyses, the treatment frequency index in present production is 1.4-3.9 standard doses per hectare, depending on the main type of production and the type of soil. If limited use of pesticides were permitted, corresponding to the +scenario, the treatment frequency index would be reduced to 0.2-0.7 standard doses, compared with present production. By going from the 0-scenario to the +scenario, the costs would be more than halved even with a more than 80 per cent reduction of the treatment frequency index. The figures thus underline the fact that a limited reduction of pesticide usage would be relatively cheap, whereas a total phase-out would be very costly.
The aforementioned losses result from a real fall of DKK 3.4 billion in gross factor income in primary agriculture in the 0-scenario, to which must be added a fall of DKK 1.1 billion in the processing industries and of DKK 910 million in other manufacturing industries. The latter covers a real fall of DKK 3.7 billion in gross factor income in building and construction, commerce, services and housing, while gross factor income in other sectors would rise by DKK 2.8 billion. In all, there would be a real fall in gross factor income of DKK 5.4 billion, 63 per cent of which would be in primary agriculture. The fall must be seen in relation to a loss of more than 16,000 jobs in primary agriculture and to a release of manpower from a number of home-market industries. To maintain employment, real wages would have to fall by about 1 per cent in the 0-scenario.
A fall in real wages would, on the one hand, improve competitiveness in sectors exposed to competition, resulting in increased production and net exports of goods and services. On the other hand, falling real wages would reduce domestic demand, which would hit particularly the home-market industries. The results would be a (real) fall of DKK 7.6 billion in private consumption (1.7 per cent), a fall of DKK 2.0 billion in investments and rising net exports, since falling agricultural exports would be fully made up for by rising net exports in other industries.
In the +scenario, gross factor income in agriculture and associated processing industries would fall by DKK 1.8 billion. About 8,000 jobs would be lost in primary agriculture and the processing industry (i.e. about half the figure in the 0-scenario), fewer employees would be released from the home-market industries, and there would be a considerably smaller fall in real wages (0.4 per cent). The fall in private consumption would consequently be smaller (DKK 3.0 billion), and the fall in investments would also be smaller. Despite the reduction in agricultural exports, net exports, taken overall, would also rise in this case.
The fall in gross factor income in agriculture reflects a fall in the agricultural sector’s contribution to income formation in society (return on labour, capital and land). The real loss in agriculture comprises a fall in wages for the remaining manpower, falling land rent and changes in the value of production rights (the milk quota). Farm-level analyses, which are based on partial or short-term restructuring of crop production, indicate substantial losses in agriculture. The analyses underline the fact that the losses in agriculture depend on the assumptions used with respect to the mobility of the means of production and the length of the restructuring period. There would also be an effect in the form of a redistribution between arable farmers and dairy farmers as a consequence of a different effect on the return on land and production rights.
The above-mentioned changes are a result of a heavy fall in crop production in agriculture and derivative effects on the rest of the economy. In the 0-scenario, cereal production would fall by 70 per cent and rape production be largely discontinued. In addition, production of special crops (sugar beet and potatoes) would go down by 60-70 per cent. The big fall in production is due to the fact that Danish agriculture is exposed to outside competition, which means that prices can only rise slightly when production falls. Livestock production would be only slightly affected by the limitation of pesticide usage. There would, however, be a slight increase in the production of pigs and poultry, due in part to low wage costs. Milk production would remain unchanged because it is controlled by the EU’s milk quota, but the value of the quota would rise.
The picture is largely the same in the +scenario, but cereal production would fall considerably less (by just over 30 per cent) and the fall in production of sugar beet would be negligible (6 per cent). On the other hand, with the assumptions used in the analyses, rape production would be largely phased out, while production of potatoes would be halved. In this case, livestock production would be only slightly affected by the reduction in pesticide usage.
The model concept used has not been developed to describe the effect on the fertiliser balance in the industry, but the economic analyses at sectoral level take explicit account of the relationship between change in production and use of fertiliser as established in the agronomic assumptions used in the analyses. It is assumed here that the intensity of fertilisation would increase if pesticides were phased out. In the 0-scenario, consumption of nitrogenous artificial fertiliser would fall by 63 per cent, while the nitrogen supply with manure would remain largely constant. In all, the supply of nitrogen would fall by just over 40 per cent. In the +scenario, the changes would be about half those figures.
The effect on land use in agriculture has been thoroughly analysed at agronomic level and in the farm-level and sectoral economic analyses. The general picture is a switch from winter cereal to spring cereal and production of fodder beet replaced by a larger acreage with peas, wholecrop and grass in rotation. Agronomically, there should be a basis for increasing the acreage with rape, while it should be possible to maintain the acreage with sugar beet, seed and potatoes.
However, the economic analyses show that, owing to international competition, the acreage with potatoes would fall, while the acreage with sugar beet would fall in the 0-scenario but increase in the +scenario. The acreage with greenfeed would increase, and increased set-aside must be expected at arable farms.
The hectare payments for commercial crops have a marked effect on farmers’ land use. Despite a very big fall in cereal production, a corresponding reduction in cereal acreage is not expected, and – as mentioned – it is expected that some rape would still be grown. The explanation lies in the fact that the hectare payments to farmers would keep the acreage in question in production at a very low level of yield. In reality, this means that there would be a basis for a considerable increase in voluntary set-aside, especially at arable farms.
It should be noted that set-aside is treated differently at farm and sectoral level. In the farm-level economic analyses, optimum set-aside is calculated, taking account of restrictions on the extent of set-aside at the individual farm, while in the sectoral economic analyses, set-aside is included with the cultivated acreage. Therefore in the latter case, increased set-aside would result in less intensive cultivation on a largely unchanged acreage.
The analyses are based on an assumption that pesticide-free products compete on an equal footing with conventional products in the marketplace. If, through labelling schemes, for example, the consumers were willing to cover the producers for the loss of gross margin, some of the negative effects for producers could naturally be averted. However, too little is known about the demand for food products produced without pesticides or with only limited use of pesticides to be able to say anything certain about this. It is difficult to see the possibilities for a new labelling scheme parallel with the �-label, besides which, a considerable proportion of Danish agricultural production is sold on the export markets, where limited, although growing, attention is paid to the environmental aspects of food quality.
In the present analyses, unilateral Danish regulation of pesticide usage is assumed, although with freedom to import conventional products and means of production. This means, for instance, that Danish cereals would largely be replaced by imported cereals, which would help sustain Danish livestock production. If we assume the implementation of a corresponding regulation of pesticide usage in other countries, we could expect a drop in the global supply of cereals, with consequently increasing prices. Such a development would strengthen the competitiveness of Danish cereals, but at the cost of generally rising prices for food products and global economic loss for consumers.
5.2.3 Effect of different treatment frequency indices
Farm-level economic analyses of different treatment frequency indices
The purpose of bringing intermediate scenarios into the analyses is to determine the relationships between pesticide usage, production and economy with different treatment frequency indices in order to gain a clearer picture of the consequences of different levels of pesticide phase-out in agriculture. The analyses have been carried out only at farm level. The agronomic assumptions for the analyses are based on the technological and biological research and the farm-level economic research. As in the case of the main scenarios, the analyses are based on the Farm-level Pesticide Model (FPM).
The analyses are based on fixed assumptions concerning treatment frequency, and the resulting gross margin is shown in Table 5.14. The table includes present production, which is used as the basis for the analyses, while the Free scenario is the model-calibrated present production, with the use of pesticides and land optimised according to the FPM model. To obtain a uniform basis for comparison, the Free scenario has been used as the basis for the analyses. Basically, present production corresponds to the pesticide usage in 1994 and to the land use in 1995/96, while the ++scenario largely corresponds to the goal in the Pesticide Action Plan from 1986.
Model-calibrated present production
The difference between present production and model-calibrated present production (Free) could indicate that farmers’ present use of land and pesticides is not optimal from the point of view of production economy. However, it should rather be attributed to the fact that the FPM model is a normative model, in which full knowledge of prices and yields is assumed. In addition, optimisation based on gross margin II is assumed in crop production, whereas, in practice, farmers must be expected to take a more integrated approach in their planning. The important thing is for the comparison between present production and the other scenarios to be consistent, and that is best assured by basing the analyses on the model-calibrated present production.
Small fall in income …
… with limited reduction of pesticide usage …
It will be seen from the figures that with the use of best known technology and with optimum warning conditions (++scenario), it would be possible to maintain the gross margin, even if pesticide consumption were reduced, whereas the gross margin would fall with any further reduction of the treatment frequency index. In the design of the scenarios, efforts have been made to present optimal solutions in the sense that the production methods are adapted to the lower pesticide usage with a view to achieving the biggest possible yield, i.e. the different scenarios represent different technologies. The relationships thus calculated between pesticide usage and yield levels have been used as the basis for calculating the optimal land use in the FPM model.
… when "best known technology" is used
The results of the analyses are summarised in Figures 5.2 and 5.3, which show gross margin II in different types of farm and with different treatment frequency indices for clayey and sandy soil. It will be seen clearly from these figures that there is a considerable difference in the average treatment frequency index in the different types of farm. The general picture is that, with optimum use of damage thresholds and warning systems, it would be possible to reduce pesticide usage to some extent without seriously reducing the economic return, but that earnings would soon fall if the treatment frequency index were reduced still further. Farms growing special crops (sugar beet, seed and potatoes) would be most exposed to loss, and farms on clayey soil would generally be worse affected than farms on sandy soil.
Considerable uncertainty concerning "best known technology"
The Sub-committee on Agriculture (1999) states in its report that it may be difficult in practice to meet the conditions for maintaining the economic return with reduced use of pesticides. For example, the necessary damage thresholds have not been developed in all cases and the weather systems require long-term weather forecasts, which are not available today. It is thus difficult to indicate with any certainty the treatment frequencies that would significantly reduce the losses. Besides that, a considerable additional cost must be expected for monitoring the crops. In the analyses, this additional cost has been put at DKK 150/ha. It is also stated that considerable breeding work would be needed to ensure varieties with good disease-resistance on the market.
Table 5.14 Look here!
Pesticide usage and gross margin in the different types of farm
Note: Set-aside is included in treated acreage
Source: �rum (1999)
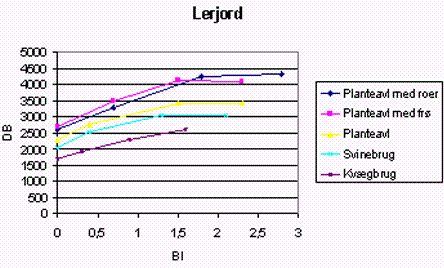
Figure 5.2
Gross margin with different levels of pesticide usage, clayey soil
Source: �rum (1999)
(Figure text)
Lerjord = Clayey soil
DB = Gross margin
Planteavl med roer = Arable farms with beets
Planteavl med fr� = Arable farms with seed
Planteavl = Arable farms
Svinebrug = Pig farms
Kv�gbrug = Dairy farms
Figure 5.3
Gross margin with different levels of pesticide usage, sandy soil26
Source: �rum (1999)
(Figure text)
Sandjord = Sandy soil
Planteavl med kartofler = Arable farms with potatoes
Planteavl = Arable farms
Svinebrug = Pig farms
Kv�gbrug = Dairy farms
Examples from practice of reduced pesticide usage
However, this does not mean that it would not be possible, with further research, the development of better monitoring systems and improved advice concerning their use, to get pesticide usage some way below the level for integrated production without impairing production economy. The Sub-committee on Agriculture (1999) thus states that there are examples of intensive advisory activities having led to a reduction of treatment frequency to around 1.3 standard doses per ha at ordinary arable farms without any reduction in the economic result.
5.2.4 Price sensitivity of the analyses
Analyses of price sensitivity
Product and factor prices from the 1995/96 accounting year have been used in the analyses of the economic consequences at farm level. The price of cereals, in particular, has fallen since then and taxes on pesticides have increased. In addition, in connection with the negotiations on enlargement of the EU, a further reduction of the level of subsidies in the EU’s agricultural policy is proposed.
Falling product prices result in …
To illustrate the effect of changes in agricultural prices, analyses have been carried out of arable farming on clayey soil. The basis for these analyses is the so-called Santer package's proposal to reduce the price of feed grain by 20 per cent. However, in the analyses, a reduction of 30 per cent in the price of wheat is assumed because the price has already fallen by 10 per cent since 1995/96. A hectare payment of DKK 2,601 for all reform crops except peas is also assumed (the hectare payment for peas has been put at DKK 2,857 per ha), in line with the assumptions in the "Santer package". It is also assumed that set-aside must be at least 10 per cent, that total set-aside must not exceed 33 per cent, and that the price of herbicides increases by 25 per cent and the price of insecticides by 50 per cent as a consequence of increased taxes.
It should be noted that the hectare payments are assumed to be paid as a
non-production-related subsidy to farmers, i.e. the hectare payment is not affected by the
farmer’s decisions with respect to production intensity.
However, the hectare payment is included in the gross margin and therefore affects land
rent.
The results of the analyses are given in Table 5.15.
… considerable fall in treatment frequency index …
Owing to the big fall in the price of cereals, the gross margin – and thus the land rent in model-calibrated present production – falls from DKK 3,418 to DKK 1,967 per ha. At the same time, the intensity, measured by the treatment frequency index, falls from 2.32 to 1.39. In other words, the lower cereal price contributes to a considerable reduction in the use of pesticides.
… and reduced losses from phasing out pesticides
The table also shows that the losses from phasing out pesticides are halved when the analysis is based on the lower product prices. Or, conversely, it does not cost as much to phase out pesticides when the product price level is reduced.
The above analyses apply to clayey soil. For sandy soil, the phasing-out costs after a price fall would be even smaller.
Small costs …
According to Table 5.15, the intensity of pesticide usage would be reduced with the assumption of optimised production. However, the analyses show that the cost of maintaining a higher pesticide usage (than the calculated optimum) would be modest. This indicates that even with lower cereal prices and the current pesticide taxes, there would probably be a need for further intervention in order to ensure a reduction of pesticide usage.
… with precautionary spraying
It must be stressed that the analyses are encumbered with uncertainty, particularly with respect to the assumptions concerning the relationship between price fall and hectare payment. That said, the analyses show that the intensity of production must be expected to fall with lower product prices and that, through that, it would be possible to ensure a reduction of pesticide usage in farming. However, the total effect would depend on how farmers assessed the risk of reducing their use of pesticides. Here, the fact that precautionary spraying does not cost very much would play a role.
Table 5.15
The effect of changed price and subsidy assumptions for arable farming on clayey soil
1995/96 prices Changed price assumptions |
||||||
| Free | + | Zero | Free | + | Zero | |
| Treatment frequency index | 2.32 | 0.43 | 0.0 | 1.39 | 0.38 | 0.0 |
| Gross margin DKK per. ha |
3,418 | 2,776 | 2,288 | 1,967 | 1,666 | 1,397 |
Note: The analyses are based on a 30 per cent reduction in the price of cereals
compared with 1995/96 and an assumption that the hectare payments for cereals and silage
corn are increased by 18 per cent, that the hectare payments for rape, peas, flax grown as
oil-seed crop, and set-aside, are reduced by 32, 10, 39 and 6 per cent, respectively, and
that the acreage with reform crops must include between 10 and 30 per cent set-aside. It
is also assumed that the price of herbicides and fungicides rises by 25 per cent, and the
price of insecticides by 50 per cent, as a result of taxes introduced.
Source: �rum (1999)
5.2.5 Pesticide usage and cultivation risk
Cultivation risk …
… is linked to economic yield
The yields from crop production fluctuate from year to year, depending on the weather. Since a number of diseases and growth of weeds are dependent on the weather, one might expect it to be possible to even out the fluctuations in yields by treating the crops with pesticides. In this connection, it must be remembered that the fluctuations vary from crop to crop, so the farmer can to some extent ensure himself against big fluctuations in earning through his choice of crop rotation. (The farmer has several strings to play on). In addition, the farmer does not necessarily aim for a constant level of yield, but wants to even out the economic yield, in which product prices also play a role. Since fluctuations in the yields for a number of crops often have a negative correlation with the price (e.g. potatoes), adjustment to the market would have an equalising effect that the farmer could include in his planning.
Pesticides affect the level of yield …
In order to trace the effect of pesticides on security of cultivation, the Sub-committee on Agriculture assessed the size of the losses without the use of pesticides. The results are shown in Table 5.16, where the crops are ranked in order of average yield in the case of a total phase-out of pesticides, with the yield in present production put at 100. From this it will be seen that the yield from spring cereal would fall less than the yield from winter cereal, that the yield from grass and winter rape would be only slightly affected, and that the yield from such crops as potatoes, seed grass and clover seed would fall sharply.
The Sub-committee on Agriculture also set a minimum yield with a phase-out of pesticides. Comparison with the average yield provides information about "how bad things could be" in the individual crops. It will be seen from the table that such crops as wholecrop and maize, fodder beet and peas would provide a high level of yield stability, while for the other crops the difference between average and minimum yield would tend to rise with falling yield level. However, covariation has not been found in years with large yield losses. It would therefore depend greatly on the crop composition whether the yield variation increased or decreased.
… but hardly the yield variation
Analyses based on trials with fungicides do not support the view that pesticides reduce the yield variation. On the contrary, it has been found (�rum, 1999 p. 61) that the yield variations in winter wheat are slightly smaller in trial plots that are not treated with fungicides than in treated plots. On the other hand, there is a clear additional yield from use of fungicides. The analyses also show close covariation in the yields from year to year in treated and untreated plots. The main effect of the treatment is thus that pesticides offer the possibility of a significant additional yield.
Table 5.16 Look here!
Yields with a total phase-out of pesticides, present production = 100
Yield variation the same in organic and conventional production
This is also supported by observations from all-year trials with conventional and organic production, in which no difference in yield variation has been found between the two forms of production. The reason why the yields are apparently just as certain in organic production as in conventional production could be that organic farmers use resistant varieties and eliminate the increased cultivation risk in return for lower yields by changing their crop-rotation and cultivation practice. The all-year trials cover mainly dairy farms, where the yield variations for winter cereal, spring cereal, grass and fodder beet have been investigated. The analyses therefore reveal nothing about the pattern of variation at arable farms, including farms with special crops, where, as mentioned above, there can be considerable fluctuations.
�rum (1999 p. 64) states, for example, that the additional yields from use of fungicides are particularly big in some years but that phasing out pesticides would not necessarily increase the yield variations in the individual crops. The available material does not provide a basis for judging whether the same would be the case for herbicides and insecticides.
Phasing out of pesticides calls for good production management …
It is also stated in the analysis (�rum, 1999 p. 69) that good production management would be more important if pesticides were phased out and that production would be more climate-dependent.
… to "control" weeds
It would not normally have irremediable consequences if pests or plant diseases were to result in big yield losses in a single year, but the situation with weeds would be entirely different. If weeds were allowed to spread for just a single year, it could have far-reaching consequences for field production. Extra mechanical weed control would be necessary for many years, and in the worst event some of the economically interesting crops, such as seed grass, beets and winter cereal, would have to be left out of the crop rotation. That means that, in the 0-scenario, weed control would have absolutely top priority in the planning of crop rotations.
Partial phasing out causes few problems …
…but would still make big demands on the production manager
The situation would be different in the case of the intermediate scenarios. An unfortunate development with increased weed problems could be remedied by means of herbicides, i.e. mechanical weed control would no longer have top priority in the planning of the crop rotation. On the other hand, effective use of pesticides in the intermediate scenarios would make very great demands on the production manager. He would have to constantly improve his knowledge of new pesticides and their use, and there would also be a need for new warning and monitoring systems etc. These technologies are under continuous development, and very few farmers today have any experience with them. Restructuring for reduced use of pesticides would therefore require technological development and continuous training of advisers and farmers.
5.3 Market gardening and forestry
Market gardening and forestry affected differently
Reducing the use of pesticides would affect production in market gardening and forestry to a varying degree. Compared with farming, these are relatively small industries, but do, however, make a significant contribution to the national economy by supplying the home and export markets. The latter applies particularly to the production of pot plants, most of which is exported. As shown in Table 5.17, market garden production accounts for 8 per cent of gross factor income in agriculture, while forestry accounts for about 4 per cent. Within forestry, a substantial part of the production of ornamental greenery is exported. It is estimated that primary agriculture employs 84,100 full-time workers. Of these, 6,700 are employed in market gardening and 3,000 in forestry.
… depending on products and production methods
Phasing out pesticides in the above-mentioned sectors would affect the production to a varying extent, depending on the products and the production methods. The consequences in market gardening and forestry are described in brief below. For a more detailed description, readers are referred to the consultants’ reports on which this analysis is based and to the report from the Sub-committee on Agriculture (1999).
Table 5.17
Gross factor income and employment in primary agriculture, 1997
| Gross factor income | Number of full-time workers |
||
| DKKm | % | ||
| Agriculture, total | 30,744 | 100 | 84,100 |
| Farming1 | 27,166 | 88 | 74,400 |
| Market gardening2 | 2,459 | 8 | 6,7003 |
| Forestry | 1,119 | 4 | 3,0003 |
1
Including fur animals2 Including nurseries
3 Estimate
Source: Danmarks Statistik (1998a) and SJFI (1998a)
5.3.1 Market gardening
When assessing the consequences for market gardening, it is relevant to differentiate between greenhouse production (which comprises greenhouse vegetables and pot plants), fruit and berries, garden seeds and outdoor vegetables, and nursery production.
Greenhouse production
Integrated production in vegetable production
Today, greenhouse vegetables are mainly produced in accordance with the IP (Integrated Production) rules. However, pesticides could not be completely phased out (0-scenario) without a substantial reduction in the production of greenhouse vegetables. Losses would differ greatly, both from one market garden to another and from year to year at the same market garden. A loss of up to 50 per cent is not unrealistic, while the average yield is expected to be reduced by 5-15 per cent with a total phase-out of pesticides (DEG, 1998).
Pot plants subject to international rules on pests
The production of pot plants, most of which is exported, is subject to international rules on the maximum number of pests. Ordinary pests can be controlled with useful animals but would be sensitive to changes in the surroundings. 0-tolerance pests cannot be controlled 100 per cent biologically, which means that a ban on the use of pesticides would mean the end of production and exports. There would be some cultures without problems with dangerous pests, but they could not substitute the present export assortment.
Many of the above-mentioned problems would also apply in the case of a partial phase-out of pesticides (the +scenario). If partially phasing out pesticides meant that the requirements concerning 0-pests and quality pests could not be met, most of the production of ornamental plants would be affected and would consequently fall. It must be stressed that the effect would depend greatly on the agents that were permitted.
A total phase-out of pesticides would result in a considerable fall in production
Altogether, restructuring for pesticide-free market-garden/nursery production would mean considerable reductions in the sector as a whole. A partial phase-out could presumably be accommodated in vegetable production, whereas it would be difficult to meet such requirements in the case of pot plants without a considerable fall in production. According to the Sub-committee on Agriculture, the fall in production could be from 0-100 per cent, depending on the culture and the season. Production of vegetables and, particularly, pot plants would face tough competition from conventional production in other countries.
Fruit and berries
Declining production of fruit and berries
Owing to international competition, the production of fruit and berries has shown a downward trend in the last few years and, with the exception of cherries, self-sufficiency is considerably less than 100 per cent and still falling, especially in the case of apples. Today, industrial production of unsprayed products is of negligible size, while there is some production of organic products.
Phase-out would result in big fall in earnings in apples and pears…
On the basis of the earnings in organic production, it is estimated that the gross margin would be reduced considerably for all fruit and berry cultures if pesticides were phased out. The prospects are worst for apples and pears, for which a substantial fall in earnings would have to be expected despite use of the most resistant varieties available, while the loss would be smaller in the production of blackcurrants and strawberries.
… while the loss is smaller in the case of blackcurrants and strawberries
With a total phase-out of pesticides (the 0-scenario), it is regarded as very doubtful whether a commercial production of apples, pears and cooking cherries could be maintained to any significant extent, whereas some production of blackcurrants and strawberries could be expected to be maintained. With a partial phase-out (the +scenario), it is estimated that - assuming that spraying against the main pests could be maintained – the economic consequences could be limited to a 15-30 per cent reduction in earnings (Daugaard et al., 1998).
Garden seed and outdoor vegetables
Production niches without use of pesticides …
… but generally big losses with a total phase-out
Production of garden seed and outdoor vegetables is a relatively small, but highly specialised sector, the main products being onions, cabbage, carrots, peas for freezing spinach for seed. Production niches could be found within the sector where there is little or no use of pesticides in present production, and where a phase-out would not have major consequences for the yield (e.g. squash). For the large productions, however, such restructuring could not be done without serious losses. The sector is characterised by substantial capital investments in mechanisation and handling of the products, which means that restructuring production would be very costly.
It is estimated (Friis, 1998) that restructuring would require prices at the level of present organic products (i.e. premiums of 30-100 per cent) to maintain production if pesticides were phased out.
Nursery production
Nurseries are subject to quality control
Nursery production covers a wide range of products within fruit trees/bushes, ornamental plants and woodland plants. Pesticides are used mainly to combat insects and fungal diseases in young crops, but also to some extent for weed control. One of the problems with limiting pesticide usage is that nurseries are subject to quality control requirements with respect to quarantine and quality pests that would be difficult to meet without the use of pesticides.
Halving of production a possibility
Up to the present time, only a few firms have tried pesticide-free nursery production, and the existing examples have been less than promising (Eskesen et al. (1998). It is estimated that, with a complete phase-out of pesticides (0-scenario), the yield from the production would be halved, while the +scenario should provide a possibility of maintaining some cultures at a certain level.
5.3.2 Forestry
Little use of pesticides in forestry
Compared with farming, market gardening and fruit growing, very little use has ever been made of pesticides in forestry. Most of the pesticides applied are herbicides, which are used in young stands to combat grass etc. since this can be a threat to survival of the young plants. In addition, pests in the form of mice, deer and weevils cause serious problems. After some years’ growth, the culture is able to cope on its own, and pesticides are not used in the following 50-150 years.
Ornamental greenery has to be meet high quality requirements
Ornamental greenery is a highly specialised product that has to satisfy other requirements than timber production. The quality requirements are high and even minor damage can make a product unsaleable. Therefore, more pesticides are used in this production than in other forestry. Owing to the market’s high quality requirements, a total ban on pesticides must be expected to undermine the economy of the production of ornamental greenery. Analyses indicate (�stergaard, 1998) that the financial yield from the production could fall by around 80 per cent. The possibility cannot be excluded of new production methods being found that could limit the use of herbicides, but insect attack would remain a serious threat if the use of pesticides were banned.
Considerable fall in income with a phase-out of pesticides
It is estimated that, in old forest areas, a pesticide ban would result in a fall of 30-50 per cent in the economic return, and in heath forestry it is doubtful whether it would be possible to achieve a positive return at all. Furthermore, the production would become less valuable with respect to quality.
In the case of afforestation on arable land, the conditions for alternative weed control are better than in existing forests. The development of mechanical systems for weed control is moving relatively quickly and, particularly in light soils, there are good possibilities of reducing the use of pesticides. On the other hand, the already slow afforestation on clayey soil would be seriously impeded if herbicides were not allowed.
5.3.3 Assessment
It is difficult, on the basis of the above-mentioned analyses, to calculate the actual loss in market gardening and forestry from phasing out pesticides. Firstly, the sectors cover a broad range of products that would be affected to varying degrees. Secondly, the concepts of analysis discussed in section 5.2 have not been developed to deal with restructuring in market gardening and forestry. In other words, we lack a real analysis of the impact of production and consumption on the means of production in these sectors.
Considerable fall in contribution to society
It is assumed that gross factor income from market gardening and forestry would fall by 20 per cent in the event of a total phase-out of pesticides (0-scenario) and by 10 per cent in the event of a partial phase-out (+scenario). That equates to about DKK 500 million in marketing gardening and DKK 225 million in forestry in the 0-scenario and about half those figures in the +scenario. Compared with the losses in farming, of DKK 3.8 billion and DKK 2.0 billion, respectively, the losses in market gardening and forestry would thus probably increase the total socioeconomic loss by 10-15 per cent27 in the event of a pesticide phase-out.
5.4 Economic valuation of environmental improvements
The purpose of the valuation study has been to establish tentative measures for the socioeconomic value of the health and environmental improvements that a ban on pesticides can be expected to produce.
Socioeconomic value of health and environmental improvements Pesticide pollution of the aquatic environment values …
The improvements include reduced pesticide pollution of groundwater, greater biodiversity and recreational and aesthetic benefits. The alternative cost method has been used to value reduced pesticide pollution of the aquatic environment. Through studies of the international literature, unit values have been found for health effects and saved lives, while valuation of such environmental benefits as greater biodiversity and aesthetic values requires preference-based valuation methods. It has not been possible to carry out empirical investigations within the budget and time schedule for the project. Instead, extensive studies have been carried out of the literature on relevant international and national studies on valuation.
… but the basis for a real cost-benefit analysis is lacking
The valuation studies have not created a basis for a real cost-benefit analysis of a pesticide ban. That is due in part to the fact that the scientific part of the Pesticide Committee’s work has not generally led to conclusions on which valuation estimates can be based. That applies, for example, in the health sphere, where it has not been possible to arrive at quantified estimates of the health effects of pesticides. In the case of biodiversity and other "soft" values, it has not been possible to find foreign valuation studies sufficiently similar to the scenarios analysed here for the unit values found to be used. That leaves calculations of benefits based on the alternative cost method, which, in the present context, concerns socioeconomic savings within water supply from a ban on pesticides.
5.4.1 Savings within drinking water supply
Savings within drinking water supply analysed ...
Pesticides are still regarded as a threat to groundwater. In this study, the benefits of phasing out pesticides have been examined on the basis of an alternative cost analysis covering the expected socioeconomic savings within the drinking water supply if pesticides are no longer used. It is estimated (Dubgaard, 1999) that, within 30 years, 5 per cent of all ordinary water supply plants with a capacity of more than 1 million m3/year would be able to avoid remedial measures. The same applies to 8 per cent of plants with a capacity of 100,000 – 100,000,000 m3/year, 13 per cent of plants with a capacity of 10,000 – 100.000 m3/year and 20 per cent of ordinary plants with a smaller capacity than 10,000 m3/year. In addition, it is estimated that 25 per cent of all individual extraction units – typically private wells and boreholes – would avoid closure if pesticides were no longer used.
… with and without treatment of drinking water
The saved costs correspond to the construction and operating costs that would otherwise have been incurred for remedial measures. On the basis of the political wish for groundwater of a quality requiring only normal water treatment, we operate with two development scenarios. The first comprises both direct remedial measures (moving the well field, amalgamating waterworks, etc.) and expanded treatment. The other comprises only direct remedial measures in the form of moving the well field and amalgamating waterworks.
The size of the saving depends on whether treatment is included as a remedial measure. If treatment were permitted, the countermeasures could be implemented for DKK 96 to 120 million per year, depending on the discounting assumption. If the political objective concerning a decentralised water supply structure in which treatment must only occur as a temporary measure were maintained, the preventive measures would cost from DKK 145 to 183 million per year, depending on the discount rate. For a more detailed discussion of the analyses, readers are referred to Dubgaard (1999). Alternatively, preventive measures could be valued on the basis of cultivation agreements.
Preserving clean groundwater can have a value for society beyond the groundwater resources’ utility value in the drinking water supply system. It could be a question of both option value and existence value.
5.4.2 Valuation of health risks
Valuation of health effect of pesticides …
As described earlier, the use of pesticides in agriculture has given rise to increasing concern about the effect of the substances on public health. Therefore, as an element of a socioeconomic assessment of limiting the use of pesticides, it seems obvious to try to assess the value of the health effect. The basis for such a valuation is to try to determine the value of a statistical life and the value of avoiding a statistically serious diseases and certain symptoms of diseases.
… is reflected in the willingness to pay for better health
The traditional way of calculating the value of health risks is to look at the cost of medicine and treatment of diseases and loss of productivity/earnings in connection with the diseases. However, such cost considerations have no foundation in the economics of welfare, which must be based on the public’s preferences in order to reflect their willingness to pay for better health. Such an analysis naturally lies outside the scope of this study.
On the basis of studies of the literature, we therefore decided to try to determine unit values for a statistical life and for avoiding diseases and, by combining these with an estimate of the relationship between pesticide usage and disease frequency, to arrive at qualified estimates of the total health value.
Data for valuation lacking
It is concluded (Christensen, 1999) that there is generally great uncertainty concerning the health effects of pesticides and the necessary data for a real valuation do not exist. There is thus no basis for assessing the order of magnitude of these benefits.
5.4.3 Biodiversity
Valuation of biodiversity ...
Biodiversity means the multiplicity of fauna and flora in the natural environment. The concept normally refers to the number of species and individuals in a selected area, but biodiversity can also be used in a wider context as the function and stability of eco-systems. Economically, biodiversity can have both a utility value (outdoor life and genetic resources), option value (possibilities of future use) and existence value (preservation of species etc.). Biodiversity can be regarded as a public good, since there is normally free access to it and one person’s use of it does not normally reduce the benefit others derive from it. The market mechanism is therefore only able to a limited extent to register the socioeconomic value of biodiversity.
… difficult without adequate analyses of economic externalities
Foreign studies show (Dubgaard & �sterg�rd, 1999) that there can be substantial values. Therefore, economic valuation can in principle make a significant contribution to the political decision-making process in connection with prioritisation that includes biodiversity. However, it is difficult to handle such a valuation in practice, and there are as yet no complete estimates of the economic externality costs that arise due to pesticides. There are some foreign studies of the economic value of biodiversity, but none of these estimates can be transferred directly to the scenarios here.
5.4.4 Summary
The purpose of the valuation study has been to establish tentative measures of the socioeconomic value of the environmental improvements that a ban on pesticides can be expected to produce. The alternative cost method has been used to value reduced pesticide pollution of the aquatic environment. The calculated economic orders of magnitude are DKK 100 to 200 million per year with a ban on the use of pesticides, calculated on the basis of the cost of treating drinking water. As mentioned, there are considerable benefit components that it has not been possible to value. This applies primarily to human health effects and biodiversity. Nor would it be sound on the present basis to say anything about the order of magnitude of these benefits seen in relation to the calculated loss figures. A complete cost-benefit analysis of the socioeconomic benefits and disadvantages of ceasing to use pesticides requires extensive empirical analysis of people’s willingness to pay for the soft values associated with these scenarios.
18 The concept of analysis developed is focused on the agricultural sector and the derivative effects on the rest of the economy. The economic effects of reduced pesticide consumption in market gardening and forestry have been analysed separately, and the results of those analyses are included in the overall assessment of the problem.
The calculation is based on Danmarks Statistik’s figures for the number of farms in different farm categories. Maintenance of sugar beet production is based on an assumption that the Danish quota must be met. It is also assumed that the present acreage with potatoes and seed grass would be maintained. As described in chapter 4, the farm model is a partial optimisation model for crop production in agriculture, i.e. the model does not take account of changes in livestock production or the interaction with other sectors of society. On the other hand, crop production is described in far greater detail than in the socioeconomic model. With present production put at 100, cereal production in the 0-scenario falls to 30 (70 per cent, cf. Table 5.9). According to Table 4.3, the agronomically fixed additional input of nitrogenous fertiliser in the 0-scenario is 18.1 per cent, which corresponds to a nitrogen consumption of 30 x 1.181 = 35.4. Apart from rounding off, the fall in consumption of nitrogenous fertiliser (100 – 35.4 = 64.6 pct.), is equal to the observed fall in the use of nitrogen according to Table 5.5. According to the analyses, the input of means of production per produced unit would rise from 18 to 30 per cent in cereal production without the use of pesticides. Measured in 1999-kroner, DKK 1,700 and just under DKK 700, respectively, per capita. Global trade model that enables elucidation of the economic and trade consequences of changes in the economic framework for, for example, agriculture.26 The unusual course of the curve for arable farms with potatoes expresses the fact that small changes in the composition of the production can have a considerable effect on the treatment with pesticides.
27 The losses are estimated. In farming, the losses are 16 and 18 per cent, respectively.
[Front page] [Contents] [Previous] [Next] [Top] |