Laboratory Evaluation of Annoyance of Low Frequency Noise
Annex B
1. Data from Objective Measurements
1.1 Levels of the Noises
The 1/3-octabe levels of the noises are shown in the table below. The levels are equivalent levels averaged over the duration of the noise examples, 2 minutes, and are given in dB re 20 mPa. The data are from a nominal presentation level of 35 dB(A).
The A-weighted levels (in dB re 20 mPa) calculated in the frequency range 10 Hz to 160 Hz are given in the following table for the three presentation levels.
Presen- tation level |
Traffic |
Drop |
Gas |
Fast |
Steel |
Gene- rator |
Cooling |
Disco- theque |
35 |
34,5 |
36,5 |
34,8 |
35,0 |
33,1 |
36,1 |
34,0 |
33,1 |
27,5 |
27,0 |
29,2 |
27,3 |
27,5 |
25,6 |
28,6 |
26,5 |
25,7 |
20 |
19,7 |
21,9 |
19,8 |
20,1 |
19,0 |
21,3 |
19,6 |
18,7 |
The C-weighted levels (in dB re 20 mPa ) calculated in the
frequency range 10 Hz to 160 Hz are given in the following table for the three
presentation levels.
Presen- tation level |
Traffic |
Drop |
Gas |
Fast |
Steel |
Gene- rator |
Cooling |
Disco- theque |
35 |
63,0 |
67,4 |
73,7 |
61,8 |
66,0 |
58,7 |
58,8 |
57,8 |
27,5 |
55,4 |
60,0 |
66,1 |
54,3 |
58,4 |
51,2 |
51,4 |
50,5 |
20 |
48,1 |
52,5 |
58,6 |
47,0 |
51,3 |
44,5 |
44,8 |
44,2 |
1.2 Spectra of the noises
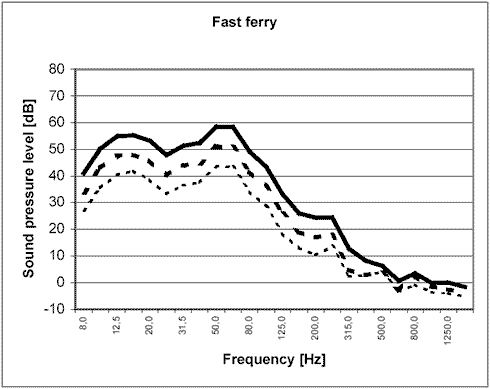
The 1/3-octave spectra of the noises are shown in the following figures. All measurements were made acoustically at the test subjects position. The spectra are show for the three nominal presentation levels: 35 dB(A) [solid line], 27,5 dB(A) [thick dashed line] and 20 dB(A) [thin dashed line].
Traffic noise:

Drop forge:

Gas turbine:

Fast ferry:

Steel factory:

Generator:

Cooling compressor

Discotheque:

1.3 Background noise
The background noise at the listening position is shown in the figure below.
