Nature and Environment 2002
ConsumptionPrivate consumptionThe environment and health at the shops Recycling We can decide for ourselves how much our consumption will impact the environment. By cycling instead of taking the car, turning off the light, saving water, and buying goods carrying energy and eco-labels, we can limit the environmental impact of our consumption. Private consumptionConsumption affects the environment – and we are consuming more and more. We are good at saving energy and water, and buying white goods with energy labels. But we cycle less, and this is bad for the environment, and for our health. Households account for more than one half of Danish consumption of goods and services. Of the products we consume, food, the car, and the house are the most problematic for the environment. This is partly because it takes a lot of energy to produce meat, to move the car, and to heat the house. In recent years, consumption of electronic products has increased so much that today this represents one of the most environmentally problematic product groups.
Electronic products use energy and contain chemicals and heavy metals. Electronic products that are not recycled are a difficult type of waste to dispose of. Our lifestyle affects the environment Consumption affects the environment by using space for housing and leisure activities, by using energy and resources, by emitting substances harmful to the environment, and by producing waste. In addition there are a number of indirect effects in other sectors: extracting raw materials, manufacturing industrial products, and processing food. Furthermore, private consumption leads to extensive transport between the producer, shops, and consumers. We can make a difference We can influence the extent to which our consumption affects the environment ourselves. By cycling instead of using the car, switching off the light, saving water, eating bread and vegetables, and buying goods with energy and eco-labels, we can minimise our environmental impact through consumption. During the 1990s, Danish people had 20 per cent more money through their hands. The extra money was especially spent on transport, communication, leisure equipment, holidays, and entertainment, while expenditure on food and housing rose to a lesser extent. Previously, there was a close relationship between private consumption and environmental impacts. When we bought larger houses and more electrical appliances, energy consumption rose, and correspondingly environmental impacts. Today, this relationship is not as clear. In other areas, increasing consumption still means increasing environmental impact. Even though cars have become more energy efficient, this does not compensate for increases in traffic.
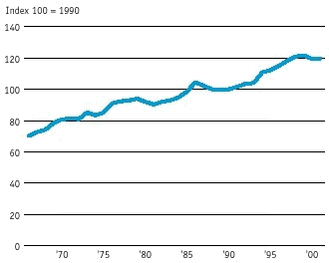
19 P R I V A T E C O N S U M P T I O N Danes are getting richer and richer. In 2000 Danes spent DKK 628 billion on private consumption. Source Statistics Denmark, Statistikbanken
We have more and more money. From 1993 to 1998 Danish private consumption increased by 3.5 per cent per year. From 1998-2001 the increase was 0.5 per cent per year. In 2000 Danes spent a total of DKK 628 billion. Previously increasing wealth meant more environmental problems. Today, in some areas it has been possible to decouple this connection between economic progress and increased pollution. Increasing wealth can also improve opportunities to create sustainable development – for example through increased savings and more investment in cleaner technologies.
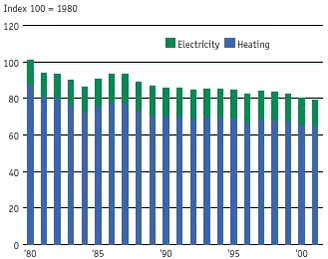
20 E N E R G Y C O N S U M P T I O N B Y H O U S E H O L D S Even though there are more households today than in 1980, total energy consumption by households has not grown. The graph shows energy consumption per household. Source: Danish Energy Authority, Energy Statistics 2001. Note. Energy consumption is measured in giga-joules per household per year.
The figure shows the changes in energy consumption by households. Although the number of households increased by 7.5 per cent from 1990 to 2000, total energy consumption increased by just 1 per cent in the same period. In fact, energy consumption per household fell by 6 per cent, despite the fact that there were more electric appliances in houses. The most important reasons are more efficient energy supply, better insulation in houses, and more energy-efficient appliances.
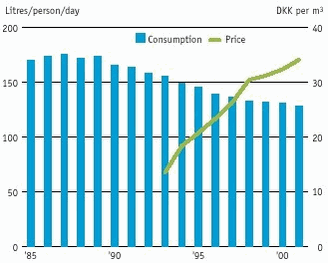
21 W A T E R C O N S U M P T I O N A N D T H E P R I C E O F W A T E R In 1989 each Dane used about 170 litres water per day. Now they use “only” about 125 litres. At the same time the average price of water has increased from less than DKK 14 to DKK 35 per cubic metre. The graph shows the change in water consumption and price. Source: Water supply statistics issued by Dansk Vand- og Spildevandsforening, the Geological Survey of Denmark and Greenland, and the Danish EPA. Note. Water consumption is measured in litres per person per day and the price of water in DKK per cubic metre.
This indicator shows the changes in households’ water consumption and the average price consumers pay for water. Information on water consumption goes back to 1985, while information on the price of water is just from 1993. Water consumption by households fell by more than one quarter in the period 1989-2001. This happened at the same time as the price of water rose by as much as 150 per cent. The price of water is composed of a water supply tax (41 per cent), VAT (20 per cent), variable water taxes (12 per cent), green taxes (14 per cent), variable taxes (9 per cent), fixed charge for waste-water (2 per cent), and finally a state tax for wastewater (2 per cent). The clear relationship between increases in water prices and falls in water consumption by households supports and documents the effect of green taxes as an incentive to water-saving measures. In future, there will be an increase in the price of water for the individual waterworks because they will increasingly have to pay costs in compensation for the limitations in land use to protect the groundwater.
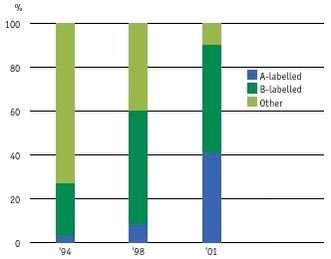
22 H O U S E H O L D A P P L I A N C E S C A R R Y I N G E N E R G Y L A B E L S The number of refrigerators, freezers, televisions, dishwashers, washing machines, tumble driers, and microwave ovens has exploded in recent years. However, despite this there has been a decoupling between the size of private consumption and energy consumption, and this decoupling is most significant with regard to consumption of electricity. From 1992 to 2000, private consumption increased by 19 per cent, while electricity consumption remained unchanged. This is because modern appliances require less electricity. A new freezer uses 22 per cent less electricity than a similar 1990 model, while the difference for a refrigerator is 17 per cent. In seven years, A and B refrigerators have won 90 per cent of the market. The diagram shows the market share of energy-labelled refrigerators. Source: Danish Energy Authority
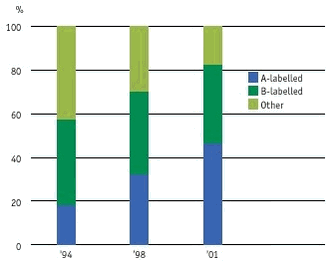
A-labelled freezers have about 45 per cent more of the market. The diagram shows the market share of energy-labelled freezers. Source: Danish Energy Authority
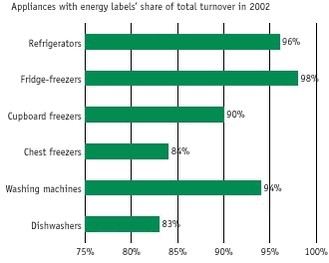
White goods with energy labels (A and B) have 83-98 per cent of the market. The diagram shows the share of the total turnover in 2002. Source: Hvidevare-Nyt 1:2003 (FEHA) Energy and eco-labelling – an aid to the consumer The Swan and the Flower Eco-labelling provides consumers with an opportunity to choose products that impact the environment less than the average. There are two official eco-labels in Denmark; the Nordic Swan and the EU Flower. Both labels are based on an assessment of the product’s environmental impact throughout its life cycle, from production to disposal. The criteria for eco-labelling are updated regularly.
Energy labelling from A to G In recent years, many household appliances have been issued with energy labels so that consumers can easily choose models with low energy consumption. Refrigerators and freezers are labelled in categories A-G, where A is the most energy efficient. Sales of A and B-labelled refrigerators and freezers are increasing. The EU energy label is compulsory for many types of household appliance. The Energy Arrow The Energy Arrow informs consumers about the amount of energy used by the stand-by function on televisions, videos, computers, etc. An average household pays about DK 500-600 per year to have the green and red lights on. House labelling House labelling is a national scheme providing house buyers with information about vendors’ consumption of energy and water.
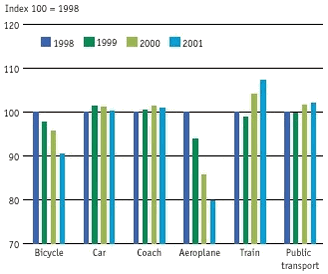
23 P A S S E N G E R T R A N S P O R T When Danes travel in Denmark they take the train more often than an aeroplane. They do not cycle as much as they have done. The diagram shows the changes in how Danes use transport. Public transport includes busses and trains. Source: Statistics Denmark
This indicator shows the changes in national passenger transport from 1998 to 2001. The number of kilometres we travel in the different modes of transport in 1998 has been set at index 100. The height of the subsequent columns shows whether Danes have travelled shorter or longer distances in the given mode of transport in the following years. It can be seen that transport by aeroplane has fallen, while transport by train has increased. The Great Belt bridge seems to have been the cause of this development. Furthermore, travel by cycle at national level has fallen. This is considered to reflect a general change in behaviour. Environmentally, it is positive that there is less travel by aeroplane, and more by train, as trains use less energy than ’planes. On the other hand it is environmentally negative that Danes are increasingly opting not to use their bicycles.
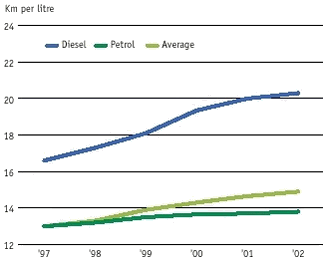
24 T H E E N E R G Y E F F I C I E N C Y O F N E W C A R S In 1997, on average a new diesel car went 16.64 km on a litre of fuel. In 2002 it went almost 20.3 km. Petrol-driven cars have not kept up with this development. The graph shows the energy efficiency of new cars. Source: Statistics Denmark
This indicator shows the development in the energy efficiency of newly registered diesel and petrol-driven cars in the period 1997-2002, compared with the average for all newly registered cars. Energy efficiency is an indicator of both resource consumption and emissions of CO2. The more efficient a car is, the less CO2 it emits per kilometre. It can be seen that energy efficiency is continually being improved, although at a slower pace than previously, particularly for diesel-powered cars. Energy efficiency of new engines has become better, but the technical improvement is partly balanced by the additional extra equipment that makes cars heavier. The average energy efficiency of new diesel-powered cars over the period 1997 to 2002 increased by 22.3 per cent, while the change for new petrol-driven cars has not been as favourable. In 1997, the average petrol consumption of new petrol-driven cars was 13 km/l. In 2002 the corresponding consumption was 13.8 km/l, corresponding to an improvement of 6.4 per cent. The European Commission have entered an agreement with the European, Korean, and Japanese motor industries to improve the energy efficiency of new cars to 140g CO2/km on average before 2008/09. Furthermore, the European Commission has a goal that by 2010 it will influence the car market with economic control measures so that car buyers purchase cars with an average energy efficiency of 120g CO2/km. This requires an average improvement in energy efficiency of 29.4 per cent from the current Danish average of 170g CO2/km. The environment and health at the shopsCleaning agents, cosmetics, clothes, and toys. Consumers are exposed to chemical substances everywhere through the products they use every day. There is a great need for better knowledge about the effects of the substances on the environment and health. Allergies are the most common health effect connected with use of consumer products. Food can be polluted with chemicals and pesticide residues. A diffuse spread of chemicals in goods and the environment can give rise to health effects in the long term. In general, producers are responsible for the safety and quality of their goods. However, as demonstrated by indicator 5 on chemical products, today many thousands of chemicals are used in production, even though their effects are not fully understood. Therefore, there remains a lot of work to do on assessing risk factors so that these can be prevented and limited where they arise.
People must be protected The government has set the target that, no later than 2020, no products on the market will contain chemicals with especially problematic health or environmental effects.
In Denmark, people’s quality of life and health must be less affected by pollution from products, food, the working environment, traffic, and the indoor climate. There are no significant rises or falls in the amount of chemical pollution in Denmark, including heavy metals. The toxicological limits for health effects from heavy metals are falling. International developments are moving in the direction of more restrictive assessments of the harmful effects of substances, as well as towards examining the chemical compounds of heavy metals that are relevant for effects harmful to health. Furthermore, control of the chemical pollution involved in production is being continued and strengthened.
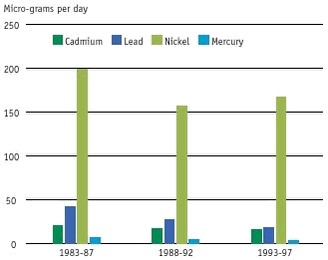
25 H E A V Y M E T A L S I N T H E D A N I S H D I E T Danes eat between 10 and 200 micro-grams of different heavy metals a day. The diagram shows the intake of four heavy metals in the Danish diet in three 5-year monitoring periods. Source: Ministry of Food, Agriculture and Fisheries
This indicator illustrates the change in the contents of heavy metals in food. The contents and intake of the toxic heavy metals cadmium, nickel, lead, and mercury have been monitored since 1984 in the monitoring system for food. All categories of food are monitored, and intake is calculated by combining the monitoring data with the results of the diet survey carried out by the Ministry of Food, Agriculture and Fisheries. The above graph shows intake in three monitoring periods. The intake of the four heavy metals reflects two different trends. The trend for lead and mercury was in decline over the 15 years, and this corresponds to the environmental initiatives against emissions of the two substances over the same period. There is only a slight falling trend for cadmium and nickel, despite intensive environmental initiatives against cadmium in the same period. The reason for this could be that both cadmium and nickel occur naturally in substantial amounts in the soil, and from here they are absorbed by plants, and subsequently by humans and animals. Although the intake of certain heavy metals is falling, it is important to continue to be alert. The international limits for when intake becomes a danger to health are being set at lower and lower levels. Heavy metals such as lead, cadmium, and mercury accumulate in the body. Lead and mercury damage the development of the nervous system, and children and foetuses are especially sensitive. These groups are also often the most exposed. Cadmium accumulates in the kidneys and can lead to kidney damage. Methylmercury presents a risk of reduced intelligence in children, and finally, the content of inorganic arsenic in diet can increase the risk of skin cancer. Heavy metals accumulate in the food chain, and the greatest exposures usually come through food.
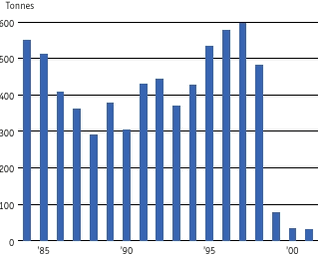
26 S A L E S O F E S P E C I A L L Y D A N G E R O U S P E S T I C I D E S In 1998 almost 600 tonnes of especially dangerous pesticides were sold, and in 2001 only about 25 tonnes. The graph shows sales of pesticide-active substances classified as especially dangerous. Source: Pesticide statistics
This indicator is a statement of the annual sales of pesticides (active ingredients) classified as suspected of being carcinogenic. The graph only includes substances used by agriculture. The indicator shows the development in the level of protection by assessing the health and environmental effects of plant protection agents and biocides. The variation in the sales of pesticides suspected of being carcinogenic is due to shifts between different agents, and in some cases stockpiling of certain agents. The dramatic drop in sales from 1998 to 1999 is primarily due to phasing out iso-proturon, a weed killer. Pesticides with unacceptable effects in normal use are not approved. Reductions in sales of pesticides suspected of being carcinogenic increase the level of protection. The significant drop in sales will contribute to the goal that by 2020 no goods or products on the market will contain chemicals with especially problematic health or environmental effects. RecyclingDanes have become increasingly better at recycling glass and paper. Two out of three glass bottles are returned, and more than 50 per cent of waste paper is recycled. Denmark fulfils the international goals for recycling, but has not yet quite fulfilled the Danish goals. The Danish goals are to recycle three-quarters of glass waste, and 60 per cent of paper from households. We must adapt our consumption patterns and production methods so that production and consumption of goods and services lead to less impact on the environment and better utilisation of resources. In future resources must be exploited more efficiently in order to limit the amount of waste and reduce the spread of pollutants. Resource efficiency can help improve competitiveness, for example through cost savings. Factor 4 As part of the government’s endeavours to achieve sustainable production and consumption patterns, a long-term aim is to limit consumption of resources to about 25 per cent of the current level. Factor 4 means that resource efficiency is raised by a factor of 4 in relation to the level today, ie. double the welfare at half the resource utilisation. The factor 10 concept means that the global materials streams are halved and that utilisation of resources is distributed equally amongst the world’s population. This would mean that consumption of resources in the industrialised countries is made more efficient by a factor of 10. Less waste, more recycling Waste that cannot be avoided should, as far as possible, be recycled so that resources remain in the cycle. Denmark has a long history of recycling a large proportion of its waste. In 2001, Denmark recycled 63 per cent of its total waste. But it must be even better. There is a need to develop new treatment technologies that ensure efficient exploitation of resources at the same time as problems with environmentally harmful substances are eliminated. For example, consumption of resources by the construction sector has a central role in society’s total consumption of resources and impacts on the environment.
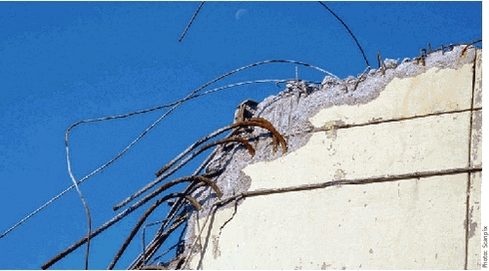
Material consumption by building and construction comprises most of Danish consumption of raw materials. Building and construction produces large amounts of waste, but most of this is recycled. Recycling reduces the need to extract new raw materials.
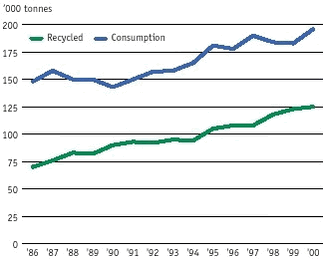
27 R E C Y C L I N G G L A S S Each time Danes use three glass bottles, they return two to the recycling container. Recycling is at 66 per cent. Source: Danish EPA
This indicator shows the changes in consumption and recycling of glass from 1986 to 2000. Glass consumption increased from 1990 to 1997, after which it remained stable. On the other hand, glass recycling increased throughout the period and in 2000 was almost 125,000 tonnes. This corresponds to a recycling rate of 66 per cent of glass. In the national waste plan, Waste 21, the goal for 2004 was to recycle 75 per cent of glass waste. It is expected that the goal in the EU Packaging Directive will be 60 per cent in 2008. The future international goal has already been met, but the national goal has not yet been achieved.
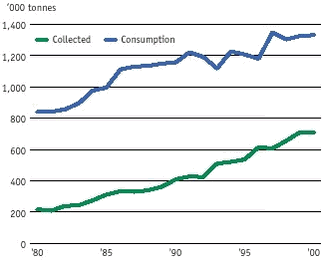
28 R E C Y C L I N G P A P E R Danes recycle more than half of their paper. The indicator shows the change in consumption and recycling of paper and cardboard from 1980 to 2000. Source: Danish EPA Paper consumption is constantly increasing slightly. Collection of paper and cardboard generally increased from 1990 to 2000, and was almost 710,000 tonnes in 2000. This means that 53 per cent of the total amount of paper and cardboard is recycled. In the national waste plan, Waste 21, the goal for 2004 was to recycle 60 per cent of recyclable paper and cardboard from households, and 75 per cent of recyclable paper and cardboard from enterprises and institutions. The goals for recycling paper and cardboard waste are on the way to being met.
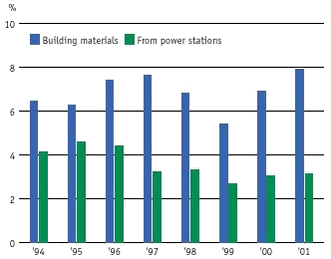
29 R E C Y C L I N G B Y T H E B U I L D I N G A N D C O N S T R U C T I O N S E C T O R The building and construction sector recycles large quantities of materials corresponding to 6-7 per cent of the new raw material extracted. The graph shows recycling of building materials and waste products from power stations as a percentage of new raw materials extracted. Source: Statistics Denmark
This indicator shows the extent to which building and construction materials are recycled. In particular concrete and tiles from demolition work are crushed and recycled as gravel and stone. Residues from power stations in the form of plaster, slag, and flue ash are also used as a replacement for new raw materials. Over recent years, recycling has comprised 6-7 per cent of total extraction from land and sea. About 2/3 of the replacement material originates from the building and construction sector, while 1/3 comes from power stations. From 1996 to 1999, recycling of residues from power stations fell. After this there was a slight increase. After a drop in 1998 and 1999, in 2001 recycling of building and construction materials was at its highest level since 1994. |
