|
Environmental Project no. 904, 2 Consumption and the Environment in EuropeTrends and FuturesContents2 Trends and emerging issues -Environmentally significant consumption clusters 3 The Context: Demography, Economy and Technology 4 Understanding Cultures of Consumption
7 Annex: Three Alternative Consumption Scenarios 1 IntroductionIn recent years, the environmental impacts of consumption have received an increasing amount of attention, in particular in the international discussions of sustainable development. There are three major concerns:
However, those involved in the sustainability debate have yet to agree on the answer to a central question: does sustainable consumption mean consuming less, consuming differently, or some combination of the two? Agenda 21, the policy document agreed by governments at the 1992 Rio Earth Summit, speaks of the need for:
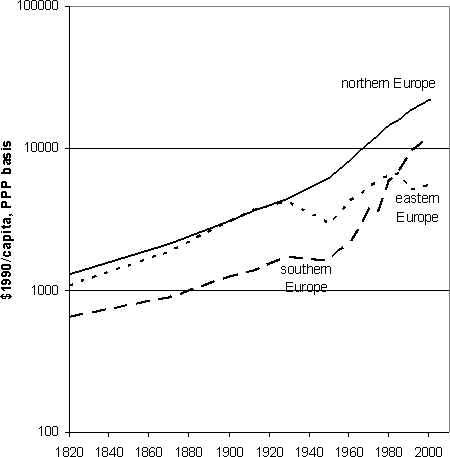
During the 1990s, a number of efforts were made to clarify what is meant by sustainable consumption and how it fits with the sustainable development agenda. Intergovernmental and academic workshops struggled with concepts, definitions and conflicting priorities (Ofstad,1994; Stern et al., 1997; Crocker and Linden, 1998; IIED, 1998). But little progress was made towards shared understanding. The Johannesburg Summit in 2002 called for a 10-year framework of programmes on sustainable consumption and production (UNDSD, 2003a, 2003b). The framework is to promote and facilitate international cooperation in moving towards sustainable consumption and production, among countries, international organisations, the private sector, environmental and consumer organisations and other non-governmental organisations. An expert meeting in Marrakech in 2003 began to identify the key issues and challenges for the programme. Some governments have also begun to develop their own national programmes on consumption and production. But despite the efforts made by governments and others, possible approaches to sustainable consumption are still developed in only the sketchiest of terms. Several international organisations, including the United Nations Environment Program (UNEP), Organisation for Economic Co-operation and Development (OECD), and the European Environment Agency (EEA) are working to deepen understanding of consumption and of possible government strategies to encourage more sustainable consumption. This report for the Danish Environmental Protection Agency seeks to support these efforts. In particular, it will form a background paper for the EEA's report on household consumption and the environment. The current report sets out to make the idea of environmentally sustainable consumption a little more concrete by exploring the outlook for consumption and the environment, considering the forces shaping consumption and reviewing scenarios in which lifestyles and consumption patterns might become more sustainable. Chapter 2 sets the scene. It first notes the level and the complexity of the changes in consumption patterns that have occurred in the last hundred years. It goes on to identify the consumption clusters that are responsible for the greatest environmental impacts in Europe; these are food, housing and transport. It explores some of the economic, technological, social and cultural influences on consumption in those clusters; maps out some of the major consumption trends in the EU15 (the European Union Member States prior to May 2004) and the ten Accession Countries (joining the EU in 2004); and provides a brief evaluation of the environmental implications of those trends. Chapters 3 and 4 look in a little more depth at the demographic, economic, technological, social and cultural factors that are helping to shape the consumer society. They also look at the ways in which these forces may be changing and identify some of the possibilities for future developments. Chapter 5 reviews existing scenarios and outlooks in the literature and evaluates their relevance to the concepts developed especially in Chapter 4. It draws on three European scenarios to 2030, organised around alternative cultural and institutional forms. The scenarios offer three different routes by which the environmental impacts of European consumption could be significantly reduced. The chapter closes by drawing out some of the implications for sustainable consumption strategies. The report concludes that the future is unlikely to conform to any one of the scenarios, but may contain elements of all of them. It identifies some of the implications for possible action that could be taken by governments, business and civil society to prepare for a future transition to more sustainable patterns of consumption. 2 Trends and emerging issues -Environmentally significant consumption clusters2.1 A century of changeIn 1900, most European countries had GDP levels comparable with middle-income developing countries today. The majority of the population lived in rural areas. Even in Britain, the wealthiest and most industrialised country, food, alcohol, clothing and energy constituted over half of household expenditure. Electric lighting was spreading rapidly through homes in European cities, replacing gas lamps. Rural homes (the majority) remained dependent on candle-light and paraffin lamps. The main fuels for heating were coal in cities and wood in rural areas, burned in stoves or open fires. Some of the most significant environmental impacts were associated with industry (with uncontrolled pollution of watercourses, groundwater, soil and air). But solid fuel use in the home was a major source of air pollution. The 20th century saw massive changes in patterns of consumption in Europe. Income increased roughly seven-fold in real terms. Expenditure on food, clothing and energy fell to only about a quarter of total spending. Transport, communication and leisure emerged as major components of mass consumption. However, the transformation occurred at varying paces around Europe, as indicated by estimates of national per capita income at different stages through the 20th century (see Figure 1.2). Figure 1.2. GDP Per Capita through the 20th Century in Major European Regions
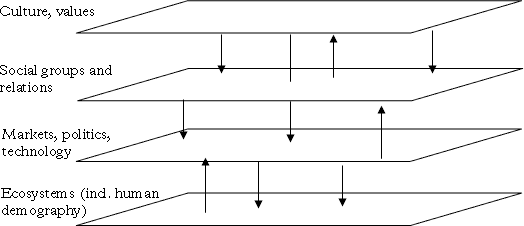
Sources: Maddison, 1995; 2003. At the beginning of the century, Britain, Germany, northern France, Belgium and the Netherlands formed the industrial and commercial heartland. These and the Scandinavian countries saw sustained economic development through the century, apart from the disruption of the two world wars. Mediterranean countries, along with the Republic of Ireland, saw slower and patchier economic development, and were affected badly by the 1930s depression and the Second World War. But after 1950, partly as a result of the Marshall Plan and European economic co-operation, Italy caught up economically with the north and Greece, Portugal and Spain went a long way towards doing so. Eastern Europe had a level of economic development comparable with the north until the 1930s, was deeply disrupted during the Second World War, but saw a rapid recovery until the mid-1980s. This region is now recovering from the restructuring surrounding the collapse of the Soviet Union. Despite widely varying rates of economic development, life was transformed by the 20th century throughout Europe. The following sections will consider a few of the forces shaping consumption and lifestyles: demography and settlement patterns, technology and markets, social structure and culture. None of these can be seen as the prime mover in the transformation process (see Figure 1.3). Changes in technology enabled rural-urban migration and population growth; urbanisation brought about social and cultural changes; cultural changes enabled accelerated technological change. Figure 1.3. Interlinked systems influencing consumption
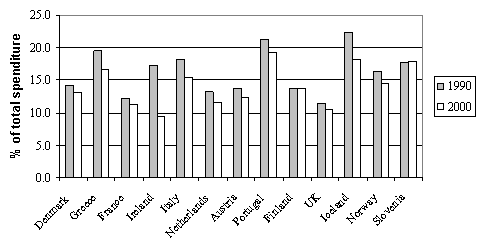
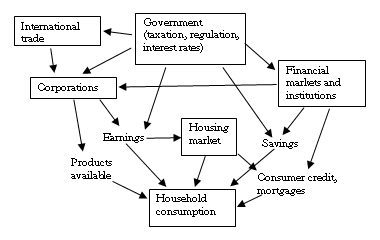
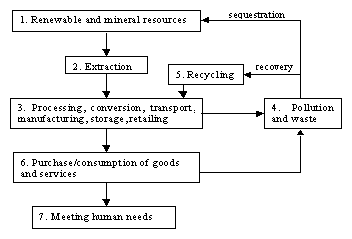
Household consumption in Europe is being shaped by a wide range of demographic, social, technological and economic trends and factors. Families and households are shrinking; the population is aging; and the amount of time spent on activities such as cooking is falling, in favour of leisure and entertainment. Increasing levels of material consumption are also closely bound up with rising personal income, falling commodity prices, and the increasing diversity of products available. Nearly all of households' market-related activities, and most of their non-market activities – whether purchasing goods and services, travelling, watching TV, or visiting a park – have influences on their physical environment (Spangenberg 2002). Their environmental burden begins with habitat disruption, resource extraction, pollution and waste during the production and supply of goods. It continues during the use phase with energy and water consumption and pollution. And it includes the impacts of disposal – sometimes long after items are discarded (e.g., CFCs from refrigerators have an impact over centuries). In recent years, households have spent most of any increase in income on consumption, so that savings as a proportion of GDP have declined. Services form a growing share of that consumption, and as industry contributes a smaller share of production some environmental problems have been brought under control. But other environmental impacts continue to rise. “Services” include energy-intensive forms of transport such as aviation. Commercial buildings, including offices, shops and other service outlets, are the fastest growing users of electricity. Within the last decade the structure of households' consumption expenditure has changed significantly (see Figure 2.1). In all European countries, the share spent on food and beverages has declined. This is a much longer-term trend but the recent fall has been particularly rapid. Expenditure on rent, fuel and power has increased moderately, nearly everywhere. In most countries, spending on transport and communication has remained at about 15% of household budgets since 1980, although some countries have seen a slight increase. Expenditure on recreation/education as well as hotels and restaurants has increased in importance to account for about one third of household budgets in 2000. Figure 2.1. Household Expenditure, 1990 and 2000, Selected European Countries Environmental implications During the second half of the 20th century, pollution prevention and control programmes were effective in limiting some of the direct environmental impacts of production processes. But during the 1990s, the increasing scale of household consumption was increasingly recognised by governments as part of the environmental challenge. While industrial energy use, water consumption and waste appeared to have stabilised or even to be decreasing in some European countries, household energy use, personal travel, water consumption and waste were continuing to grow. Governments have struggled to find ways to address these issues, partly because the trends result from the choices of individual consumers, which seem difficult to influence; and partly because increasing material consumption seems inseparable from economic growth, which is a crucial policy goal. Consumers are also becoming increasingly aware of certain environmental issues, with many products labelled as environmentally friendly. These include phosphate-free washing powders, mercury-free batteries and CFC-free aerosol cans. But, in most countries, public understanding of the relative importance of different consumption changes remains poor. For example, surveys indicate limited awareness of the major contributors to climate change (e.g. Kasemir et al, 2000). A number of studies have sought to evaluate the direct and indirect contribution of different household activities to environmental pressures. Using quite different approaches, all of them highlight three consumption areas which are responsible for the majority of direct and indirect pressures: food consumption, transport and home energy use.
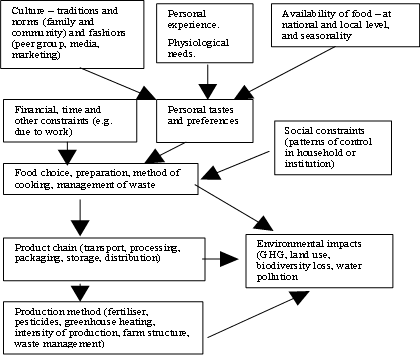
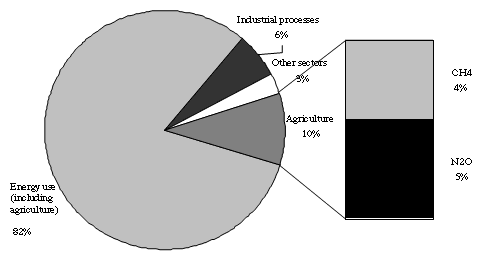
The remainder of this chapter focuses on the priority areas identified by these studies. 2.2 FoodHousehold food consumption has major direct environmental impacts through car-based shopping trips, energy use by home refrigerators and freezers, cooking and waste disposal. However, households have an even larger indirect environmental impact through the rest of the food supply chain, mainly from agricultural production but also from food manufacture, transport of crops and products, storage, retail and food services. Jongen and Meerdink (1998) estimate that close to half of human impact on the environment is directly or indirectly related to food production and consumption. In Germany, the food chain's share in energy and material consumption is about 20%, and agriculture accounts for 56% of Germany's total land area (Lorek et al.1999). Agriculture also makes a substantial contribution to water pollution and eutrophication. Current agricultural practices are causing soil erosion and reducing soil quality (Burdick 1997). Finally, agriculture makes a substantial contribution to European greenhouse gas emissions. In order to feed Europe's 380 million citizens, for instance, 390 million tonnes of CO2-equivalent greenhouse gases (GHG) are emitted per year, i.e. more than one tonne per inhabitant (Eurostat, 2003f). Figure 2.2. Influences on food consumption and its environmental impacts
2.2.1 Influences on food consumption and its environmental impactsIn addition to the basic physiological requirement for nutrition, food consumption is shaped by: economic influences including the availability of foods; the availability of technology for production, transport, storage and preparation; social influences within the household, workplace and elsewhere; and cultural influences such as local traditions and fashions. Physiological needs. The food supply in the EU15, at 3500kcal/capita/day, is a third more than is required for a healthy diet. Yet food supply and consumption continues to increase, albeit slowly, increasing both food waste and obesity levels. Appetites are stimulated by the offerings of a food industry that provides a growing range of food products, many high in fat, sugar and salt. Eating is also being made easier with a shift away from the purchase of raw ingredients towards prepared and frozen meals. Where fresh vegetables are bought, they are often ready-washed and chopped. Prepared food is increasingly available to eat out of home. Consumers are buying foods with more packaging and more food-miles, including exotic and out of season fruits and vegetables. At the same time, shoppers are becoming better educated and more aware of health-related issues and are concerned about the nutritional content and functional value of their food. They are also increasingly seeing production methods as part of product quality. Economic factors such as income and prices are strong influences on the dietary mix for low-income households. However as income rises and food becomes a smaller component of household expenditure, the income and price elasticities of demand for specific foodstuffs tend to fall. For wealthier households, income levels may influence where and how food is eaten (e.g. the number of trips they can afford to exclusive restaurants) rather than what is eaten. Since food consumption is a basic necessity, low income households spend a high proportion of their budget on food. In Portugal for example, the wealthiest 20% of households spend 13.4% of their budget on food. For the poorest 20%, food makes up 36.7% of total expenditure. (Eurostat, 2001). International comparisons show that the national level of calorie intake is only weakly correlated with average per capita income, once this rises above around US$10,000 (€8,000) per year (on a PPP basis). For incomes between $1,000 and $10,000 the variability in calorie intake is almost entirely due to differences in animal product consumption. Within the EU15 countries, the lowest national average per capita income is around $14,000 (PPP), so animal product consumption shows very little correlation with income: Greek and Portuguese citizens, with similar levels of income, consume on average about 830kcal/day and 1070 kcal/day in the form of animal products. Among the higher-income countries, Italians consume 940 kcal/day as animal products, while the French consume 1350 kcal/day (FAOSTAT, 2003). Social trends. Once basic nutritional needs are met, the correlation of income with diet may be due to social and cultural factors. One of the most noticeable social trends is that food consumption is increasingly individualised. Individualisation is visible in the contents of the trolleys in supermarket checkouts. Each person can choose from a growing array of products, creating a highly personalised diet. This contrasts with the limited range of foods available in pre-industrial society and the strong association between food and locality, which made food part of community identity. Individualisation is also visible in the home, where many families no longer sit down together to eat. In those that do eat together, each person may have a different meal. There are several reasons for this trend. One is shrinking family size. In larger families it made sense for one person to cook a single meal for everyone. Another contributor is the increasing number of women in the labour force. In a group of 17 OECD countries more than 75% of women between 25 and 44 are now in paid employment, compared with roughly 40-60% in 1970 (OECD, 2001). The trend has created time conflicts for many families, particularly where cooking remains primarily a female task. More money and less time makes convenience a high priority; and technology and product innovation have come to the rescue. With the spread of convenience foods, freezers and microwave ovens, little time or skill are needed to prepare an individual meal. Technology has also enabled a change in shopping patterns. In particular, the combination of the car and the freezer has led to a decline in the frequency of shopping trips, with many households visiting a superstore once a fortnight or even once a month. Culture. The individualisation of food consumption may be part of a broader cultural trend in which people construct and communicate their personal identities through consumption choices (e.g. Czikszentmihalyi and Rochberg-Halton, 1981). However, some social research casts doubt on the extent to which food consumption choices are truly individualised. In his classic study of the social determinants of taste, Bordieu (1984) found that consumption patterns in Parisian suburban households were closely correlated with socioeconomic class. Warde (1998) carried out a more detailed study in Britain, comparing food consumption patterns of different social groups in the 1960s and the 1990s. He found that food tastes in the 1960s were closely correlated with class. In the 1990s, significant differences remained among the consumption patterns of different social groups, identified by the type of employment of the head of household. However, the cultural characteristics of these households seemed to differ in more subtle ways than in the past and could not be so easily described in terms of socioeconomic status. Market research points to the segmentation of consumers with a variety of consumption styles. Other research (e.g. Dake and Thompson, 1998) has shown that clusters of food consumption styles appear to be linked to other aspects of household culture. The media provide one mechanism for the generation of cultures of food consumption, and for the diversification of eating styles within households. A great deal of television content pertains to food and eating, including advertising, consumer journalism, cookery programmes, travel documentaries, scientific and health information, and drama. Dickinson (1998) finds that dialogues within households about the choice of food draw extensively on arguments and narratives from the media. People are rarely simply persuaded by advertising or health advice, but they play off the different arguments for themselves, and with each other. Globalisation is a widely discussed phenomenon with major effects on food consumption. Migration has played an important role in introducing new cuisines to Europe. National diets now reflect European countries' historical relationships with other parts of the world, but the range of foods demanded and available are continuing to change with new waves of immigration from different regions. Tourism has been a further major contributor to the internationalisation of diets, as European nationals develop new tastes while on holiday, and seek out those cuisines after they return home. Box 2.1. Genetic Modification The development of genetically modified organisms (GMOs) has generated global debate. While consumer fears have concentrated on unknown risks of eating GM products, the more substantive debate relates to the risk of the release of modified genetic material into the environment, and to the control of the technology by multinational companies. Evidence on the environmental effects of GM crops is growing, and it is likely that some crops will be found to offer environmental benefits, while others may encourage increased use of herbicides or other chemicals. Questions remain about the risks of cross-pollination and other routes for the spread of modified genes. The debate has polarized institutions, with governments sometimes taking the side of the companies that have developed the technology. But since many supermarkets and food manufacturers have responded, perhaps reluctantly, to consumer concerns by withdrawing GM products, this issue can be seen as a success for consumer empowerment. An obvious dimension of the globalisation of food supply chains is the growing level of food trade and transport. With the internationalisation of food chains, European and American supermarket chains are growing in size and influence. They help to shape both consumption and production, imposing their standards on farms around the world. With the consolidation of the industry through mergers and takeovers, multinational food manufacturing companies also have an increasing influence, upstream on agriculture, and downstream on retailers and consumers. The globalisation of the food-processing industry is resulting in a homogenisation of the range of food products available throughout the world – especially for affluent consumers. Global branding, marketing and advertising contribute to the development of a common language or value system linked to consumption. However, information on nutritional content, and on the environmental and social characteristics of products, especially those related to the production process, are sometimes left out of the message. 2.2.2 Consumption trendsExpenditure on food. During the 1990s, with growing incomes, household expenditure on food increased in most EU countries. Figure 2.3. Annual spending on food, selected European countries
Eurostat 2003g However, as overall household expenditure increased even more rapidly, the share of food and non-alcoholic beverages in total household spending declined, in some countries quite significantly. Figure 2.4. Annual spending on food, selected European countries
Eurostat 2003g, New Cronos Dietary shifts Despite medical advice, daily calorie supply rose within the EU from 3374 kcal in 1990 to 3539 kcal in 2001 (FAOSTAT, 2003). The increase is mostly in consumption of cereals, vegetable oils and sugar – the basic ingredients of many snack foods, but consumption of meat, fish, dairy products and fresh fruit and vegetables also increased. Table 2.1. Consumption of major food categories in EU15
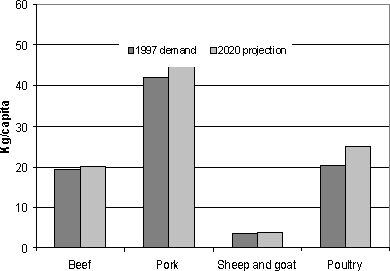
FAOSTAT, 2003 In Europe overall, calorie supply fell over the same period from nearly 3380 to about 3320 kcal, mostly due to a decrease in consumption of animal products in the Eastern European countries. Meat consumption is perhaps one of the most important dimensions of diet from an environmental point of view. European calorie intake per capita from meat consumption has increased by about one third since the early 1960s but is now growing much more slowly. There are significant differences in meat consumption among European countries and in the direction of changes (FAOSTAT, 2003). Figure 2.5. Meat consumption, 1990 and 2001, selected European countries
Eurostat, 2003g; New Cronos 2003 Consumers are choosing less beef and lamb, and more pork and poultry. This trend is due to a combination of factors, including health scares such as BSE and foot and mouth, price differences, and nutritional advice that white meat is healthier than red meat. Poultry meat is also easier to integrate into prepared meals. While this dietary change may be beneficial for the health of consumers, poultry and pig farms are increasingly intensive and there are concerns about animal welfare. Box 2.3. Packaging Packaging waste comprises almost 1/3 of the total waste from daily household activities. Paper and cardboard is by far the largest fraction of packaging waste but with high recycling rates. Plastic packaging accounts for 29 kg/capita of waste per year, metals 9 kg/capita. The average rate of packaging recycling in the EU is close to 50% (28%-65%). From 1996 to 2001, consumption of ready meals rose by 8.8 % within the EU, with major differences between countries. Greece, Spain, and Austria are seeing rapid growth from relatively low levels. The ready meal market in France and Germany is more developed and growing more slowly. Canned and frozen meals are still dominant but chilled product sales rose by 45% over the 5 year period (RTS 2003). Out-of-home consumption also accounts for a significant and growing proportion of European food intake. In 2002, 24.4% of meals and snacks were eaten away from home. This is expected to grow to 27% by 2007. In the UK, almost 32% of meals and snacks are eaten away from home. This is set to increase to 35.5% by 2007. This compares to 20% in Germany and 25% in the Netherlands. (Datamonitor 2003). Approximately 25% of total household food expenditures go to out-of-home food sources. This is expected to reach 30 to 40% (Payer et al 2000). The environmental implications of these trends are not clear. Box 2.2. Food scares – changing consumption? From time to time consumers are faced with scandals about food production. Recent European examples include BSE and foot-and-mouth disease. Beef consumption in Britain and Germany fell from 1987, after the BSE outbreak was recognised in the UK in 1986. UK consumption recovered as the disease was brought under control in the mid-1990s. In Germany, which had no cases of its own until 2000, and in the EU overall it has continued to fall. Beef Consumption
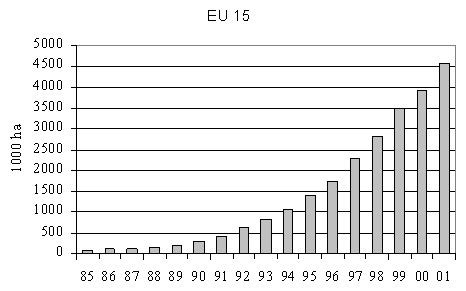
One positive sign for the environment is the growth in demand for organic food. Since the beginning of the 1990s, organic farming has developed rapidly in almost all European countries, and this strong growth is continuing. By the end of 2001 3% of the EU agricultural area and 2% of EU farms were managed organically. Compared to the previous year this was an increase of 17% in the organic land area. Including EU Accession Countries and EFTA countries the increase was 25%. In Austria, more than 11% of agricultural land is organic, in Switzerland 10%. However, some countries have yet to reach 1%, while more than one quarter of the European Union's organic land (1.2 Mha) and almost one third of its organic farms (50,000) are located in Italy (FiBL, 2003). Figure 2.6. Certified and policy-supported organic and in-conversion land area in Europe (in 1000 ha)
Lampkin 2003 The European market for organic food in 2003 is estimated at 10 to11 billion €. While this is less than 2% of the overall EU food market, it accounts for almost half of the global organic food market. EU regulation 2092/91 on organic production provides considerable protection for both consumers and producers. Within Europe, Germany has the largest organic market with a sales value of approximately 2.5 € billion or €31 per capita. However, Denmark (€72) and Switzerland (€68) lead in per capita consumption. These are countries where most products are sold via supermarket chains. This aspect is recognised as a main criterion for enlarging organic market share. In many countries, including Switzerland, already more than 70% of organic products are sold through multiple retail chains. Nevertheless, in most European countries specialised health food and organic shops have benefited from the organic boom (Yuseffi and Willer 2003). 2.2.3 Environmental effects of food consumption trendsA large proportion of the environmental impacts of food consumption are associated with agricultural production. The impacts include:
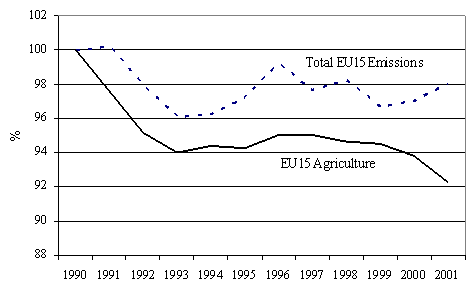
While food consumption levels are increasing in Europe, crop yields and livestock productivity are rising faster. Hence the total amount of land required for agriculture declined from 164 Mha in 1961 to 140 Mha in 2001 for EU15, although the area of irrigated land is rising. Continuing habitat and species loss has mostly been linked to changes in production patterns, such as increasing use of pesticides and the removal of hedges. In addition to their effects on biodiversity, agrichemicals such as pesticides, fungicides and herbicides pollute surface and ground water. The intensity of agrichemical use has declined in many countries although it is increasing in others (EEA, 2003a). Agricultural fertiliser is the main source of nitrate pollution in European waters. In the EU15, fertilizer use has stabilized in recent years after a significant decrease in central and eastern European states in the early 1990s (EEA, 2003a). The aspect of food consumption that has most impact on the environment is the share of animal products in the diet. While animal products supply 30% of food calories in Europe, 40% of agricultural land is under permanent pasture and 65% of grain consumption is for animal feed. Only 25% of grain consumption is for food. Kramer et al (1998, 1999) find that household food spending is correlated with the energy use and CO2 emissions in the food supply chain. Higher value products involve more energy use in greenhouse production, transport and food processing. A Swedish study compared four different meals with the same energy and protein contents in terms of their GHG emissions (Carlsson-Kanyama 1998). It found life-cycle emissions ranging from 190g CO2-equivalent for a vegetarian meal with local ingredients to 1800g for a meal containing meat, with most ingredients imported. Vegetarian meals can have higher life-cycle GHG emissions than meals including meat, if the vegetarian ingredients are transported long distances, or include high emissions in production (e.g. some rice is produced with high methane emissions). The direct energy use in agriculture is small compared with the rest of the food supply and consumption chain. The agriculture sector accounts for about 2.3% of total final energy consumption in the EU15. However, the manufacture of fertilizers and pesticides probably accounts for 3-4% of total final energy consumption. In the EU15, fertilizer use is increasing slowly. There was a significant decrease in central and eastern Europe in the early 1990s. In Europe, CO2 emissions from land-use change are negligible. Non-CO2 greenhouse gas emissions from agriculture consist primarily of methane (CH4) and nitrous oxide (N2O), greenhouse gases which are many times more powerful than carbon dioxide (CO2). Dairy cattle are the principal producer of methane emissions. In the EU-15, the contribution of the agricultural sector to total GHG was almost 10% at over 400 Mt CO2-equivalent in 2001. Agriculture non-CO2 GHG emissions fell by 6.4% between 1990 and 2001, compared with a reduction of 3.5% in overall EU15 GHG emissions. Figure 2.7. Non-CO2 GHG emissions from EU agriculture, 2001 (CO2-equivalent basis)
EEA 2003, GHG inventory More than 500kg CO2-equivalent emissions per capita are from animal production – nearly double the figure from crop production (268 kg), to provide less than half the food calories. Between 1990 and 2000, methane emissions fell by 7% and nitrous oxide emissions by 5.5%. There was also a significant reduction in methane emissions in Accession Countries and GHG emissions from agriculture fell by more than 6% in EFTA countries (Eurostat 2003f). Figure 2.8. Development of non-CO2 greenhouse gas emissions from agriculture
EEA 2003, GHG inventory Impacts of animal husbandry. Apart from GHG emissions and the sheer area of land required for livestock, environmental impacts of meat production include soil erosion due to overgrazing and water and air pollution from animal effluent. The increasing consumption of poultry and pork has intensified environmental pressures from large-scale production (OECD, 2001b). Transport. Within the EU, freight transport in the food supply chain, including agricultural products, live animals, foodstuff and animal fodder, has a share of 30% of total freight tonne-kilometres. Since 1991 in the UK, food-related tonne-kilometres have grown by 26.6% compared with an average 20% across all freight sectors. The average length of haul for food is 129km, substantially further than the average of 94km for all freight. A fifth of food (by weight) moves more than 200km. This is partly because the supply chain has become more complex (Garnett 2003). It is often assumed that food miles constitute a dominant part of the environmental impact of the food supply chain. But several studies show that imported foods sometimes have lower impacts than local food – e.g. when local production requires heated greenhouses (Carlsson-Kanyama 2000, Jungbluth 2000). Energy use within households. Food-related activities such as refrigeration, cooking and cleaning account for 7-12% of household energy use. Historically, growth in household electricity consumption has been due largely to expanding household ownership of food related appliances (refrigerators, freezers, dishwashers, microwave ovens) (OECD 2001c). Waste. On a global basis, one quarter of the food entering the institutional and household distribution system is lost. Levels of waste are closely correlated with levels of income, with little food wasted at low levels of income, but with 30-60% of food requirements lost in high income countries (cited from Carlsson-Kanyama and Faist, 2000). Food waste is the wettest and most dense component of domestic waste streams. Increasing packaging has helped to reduce waste from spoilage but has significantly increased the amount of non-organic wastes entering the waste stream from household food consumption and diversified the materials. Although recycling rates for many packaging materials have increased, wastes from household food consumption are among the least affected by these trends (OECD, 2001c). Impacts of the growth of organic production. Several studies have been carried out on the environmental impacts of organic production (e.g. Vetterli et al, 2002; Shepherd et al, 2003; FAO, 2003). They show that organic farms use 50-70% less energy (direct and indirect) per unit of product than conventional farms mainly as a result of different fertiliser consumption, depending on the product. Organic production also has clear benefits for biodiversity on agricultural land, although lower yields may mean that a larger land area is required than under conventional production methods. Soil erosion and deterioration is generally expected to be lower because of the higher input of organic matter, although there is little empirical evidence for this at present. Runoff of nitrates into groundwater is expected to be reduced, although again there is little evidence at present. Organic livestock production may result in an increase in methane emissions, as food productivity per animal is lower than in conventional agriculture, and there is little evidence for any reduction in methane emissions per animal. On the other hand, methane emissions from slurry and nitrous oxide emissions from fertiliser decomposition are expected to be reduced. Convenience foods. The environmental effects of the trend towards convenience foods depend on a variety of factors. As more of the food preparation process occurs in the formal manufacturing and services sector, energy use and waste by the food industry are increasing. Packaging and packaging waste is also increasing. But food trimming waste and energy use in households might be expected to be falling. Meanwhile, industry has better opportunities than households for recovery of energy and materials and for the environmentally responsible treatment of waste. It is also easier for government to impose and enforce environmental regulations on industry than on households. Table 2.2 Energy use of a ready vs. self made meal
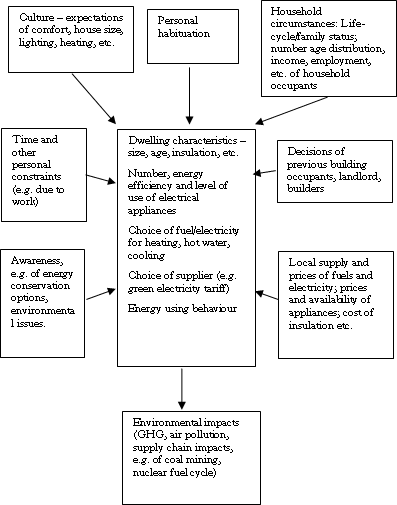
Meier-Ploeger 1997 Several lifecycle analyses have compared freshly made and convenience meals. The results are ambiguous, but the studies show that energy use is the main criterion and can be improved in industry as well as in households. One study compared a ready meal with a home-made meal containing meat loaf, potatoes, pies and carrots. It found similar energy consumption for the two cases, as long as the meal was prepared for only one person. If the meal is to feed more than one, the home-made meal requires less energy. The balance also improves in favour of the home-made meal if it is cooked using natural gas instead of electricity. 2.3 Household energy consumptionHouseholds are one of the largest final energy consumers in the EU, accounting for 26.2% of the total energy consumption in 2001 (compared to 27.7% for industrial use). European households consumed 10 EJ in 2001, equivalent to over a tonne of coal per person or 2.5 tonnes per household. This was 14.5% more than in 1990 (Eurostat, 2003g; New Cronos). Nevertheless, because of a shift in the mix of energy carriers, from coal and oil towards gas and electricity, household energy use is becoming cleaner. In most EU15 countries, it is no longer a major contributor to urban air pollution. Fuel switching both in homes and in power generation has resulted in a reduction in CO2 emissions from residential energy use, despite a continuing increase in the amount of energy used. However, the residential sector does remain a major contributor to overall greenhouse gas emissions (about 22% of total fossil fuel CO2 emissions in 2000). As the power sector “dash to gas” reaches its limit, and without further major expansion of European nuclear power capacity, CO2 emissions from residential energy use are expected to rise in the future. Perhaps the greatest challenge in seeking to reduce the environmental impacts of residential energy consumption is that it is inconspicuous and habitual. People do not notice that they are using energy. Central heating and hot water systems are automated, often heating rooms and water when they are not needed; a growing share of electricity is consumed by appliances on “standby”; and refrigerators and freezers, which function in the background remain among the largest energy consumers. 2.3.1 Influences on household energy consumptionEnergy is a derived demand, in that consumers are usually not interested in consuming it for its own sake. In households, energy is used to deliver services, the most important being space heating and cooling, hot water, lighting, and the operation of appliances such as refrigerators, washing machines and televisions. Whereas food consumption is often part of social interaction, energy consumption is incidental. Much of it is “inconspicuous” consumption resulting from the householder's pursuit of cleanliness, comfort and convenience (Shove and Warde, 1997; Shove, 2003). Energy consumption is shaped to a large extent by cultural expectations, habituation, and household circumstances, as shown in Figure 2.9. However, expectations of cleanliness, comfort and convenience are changing as a result of new technologies, higher incomes, acclimatisation to higher standards of comfort at work, and much else. Figure 2.9. Influences on household energy consumption and its environmental impacts
This section starts by identifying the proximate influences on energy consumption – household size, building fabric, energy efficiency of technologies, energy prices etc. – and then goes on to address the underlying social and cultural influences. Demographic determinants. Household energy demand obviously depends on the number of households, the number of inhabitants per household, and activities within each household. In the European Union, the number of households grew 11% from 167 million in 1990 to 185.8 million in 2000. Over the same period the population only grew 2.8%. Average household size fell from 2.6 people in 1990 to 2.4 in 2000. While the increase in the number of households is achieved partly by subdividing existing buildings, much of it is due to new construction. Hence, the housing area per person increased. The energy requirement for heating, lighting, and some appliances such as refrigerators and televisions, does not differ much between a two-person household and a three-person household. Hence shrinking household sizes results in increasing energy use per person. Technology and infrastructure. The challenge of energy conservation and GHG mitigation in buildings is often defined largely in technological terms – finding ways of introducing more energy-efficient technology into the building stock. Certainly building size, design and fabric have a major influence on energy use. The age of the dwelling may determine the building fabric, the presence and quality of insulation, and the type and efficiency of the heating system. The energy carrier (gas, oil, electricity, etc.) is as important as the efficiency of the boiler itself. Technological progress contributes to an improvement in energy efficiency, but innovation is also creating a growing diversity of energy-using appliances. Lighting and electrical appliances are the main areas of growth in household energy use. The range of domestic appliances is increasing, and the number of appliances per household is also rising. A small but growing cause of inconspicuous energy use is the increasing number of electrical appliances that consume electricity when they are not in use. In some cases this is because of built-in clocks or computers that require power to run; or because the appliance is on “stand-by”, ready to be powered up by a remote control handset. Many appliances consume electricity even when they appear to be turned off, because they contain transformers that are still connected to the power supply. Economic factors. Household energy use is correlated with income (Lorek and Spangenberg, 2002). As in the case of food, higher-income households spend a smaller proportion of their budget on energy than low-income households (i.e. the income elasticity of demand is less than one). Energy costs are a very small component (3-4%) of overall household budgets, so only the lowest-income households are price-responsive in their energy demand. Price differences between fuels, or between suppliers of a given fuel, can have significant influences on consumer choice but in competitive markets, utilities offering cheaper gas or electricity have to go to great lengths to draw consumers' attention to the benefits. Similarly, the experience of energy conservation programmes has shown how little interest consumers have in the cost reductions that can be achieved. The higher energy consumption of wealthier households is partly linked to their larger living space and number of rooms per household member. In German rented flats, the average living space was 102 m² among households with monthly income over €3800, compared to an average living space for all income classes of 67 m². A similar picture can be shown for owner-occupied flats. Here the average for all income groups is 110 m² but the living space for households with an income above €3800 is 144 m² (Federal Statistical Office Germany, 2002). Appliance ownership also depends on income. As household income rises, expenditure on appliances (reported in the statistics in a category with furnishings and textiles) increases at an even faster rate. Comparing income groups within countries shows that the poorest 20% spend between 2.2% (Sweden) and 4.4% (Luxembourg) of total household expenditure on this category, while the wealthiest 20% spend 3.3% (Spain) to 5.9% (Germany). Household composition. Household composition and age also play a role. Families with preschool children may occupy their homes throughout the day, whereas working couples without children are away from home all day. Elderly people may need higher levels of heating than fit young adults, and if they live alone they may keep the TV on all day. On the other hand, older people have usually developed less energy-consuming habits earlier in life than younger people. Younger people dedicate a larger share of their total expenditure to furnishings, textiles and appliances (European Commission 2001, Consumers in Europe). Households whose head is unemployed, retired or otherwise inactive spend a higher than average proportion of their budget on energy (European Commission 2001). These households both have below-average disposable income, and make use of the home during the day. On the other hand, higher-income households with employed heads of household are more likely to own energy-using appliances such as dishwashers. Occupier behaviour. Householders' choices influence energy use through the choice of dwelling (subject to economic and other constraints). They may determine the patterns of ventilation, room temperatures and the pattern of heating through the day. Heating energy consumption can vary by up to a factor of two in similar dwellings because of occupier behaviour. Residents can also influence energy consumption through minor renovations such as draught-proofing. Home owners can influence energy consumption through thermal insulation and the choice of heating systems. (Lorek 2001) Habituation. People are becoming accustomed to higher levels of cleanliness, comfort and convenience. Personal body odours are more noticeable than in the past, because most people shower or bath daily. We expect a roughly constant indoor temperature through the year. Clothes and bedding are changed and washed more frequently. We are able to maintain a well-stocked kitchen with minimum concern about food spoilage. And these expectations are met with a minimum of action on our part, through technology. We have automated hot water systems, central heating, washing machines, refrigerators and freezers. To some degree, technology has clearly made life pleasanter and easier. However, some of the new habits are arguably more a matter of social norm than improving physical quality of life. For example, human beings adapt quite easily to moderate variations in the temperature of their living environment. A room temperature of 16°C is easily adequate for most healthy adults, yet it is now the norm in much of Europe to heat homes to 21°C or more in winter. Social factors. Although energy consumption in itself may be inconspicuous, it is linked in many ways to consumption as a social phenomenon. One of the most obvious aspects of this link is through the house itself. Our homes are closely bound up with our personal identities (Csikszentmihalyi and Rochberg-Halton, 1981). Trends towards smaller household sizes and larger floor areas per person link to wider social and cultural trends, in particular the individualisation process discussed in relation to food. Traditional social forms such as the extended family, and even the nuclear family, are breaking down. Adults are more likely to live alone, and separated parents often maintain bedrooms for their children in both homes. There have been significant changes in the way homes are used, closely linked to the individualisation trend, to the increasing number of women in formal employment, to the increasing flexibility of working hours, and increasing home-working. The growing number of TVs and video game machines provides busy parents with a way of entertaining children and teenagers. Children often have their own bedrooms with their own TV sets. Central heating is one of the facilitating factors in this development, as it enables the whole house to be kept at a comfortable temperature, encouraging household members to spend their time in individual pursuits scattered around the home. The growing number of home appliances is also part of the phenomenon of product diversification in the consumer economy, where businesses compete with each other to supply an increasingly diverse range of products, and to improve on those products faster than each other in order to gain market share. One response among consumers is the development of groups who own and are knowledgeable about those products. In some households, owning the latest model of plasma screen TV may be symbolic of sophistication and success. In others, the prized possession may be a “traditional” oil-burning kitchen range. In still others, it may be the most advanced computer or video game system. At the same time, there seems to be some international convergence in concepts of an ideal home. Students from different countries, when asked to describe the home they would most like to live in, produce a similar vision of a large, well-equipped house in the country (Harper, 2000). The convergence is currently concentrated in mobile, middle class people with a high degree of exposure to the media, but these are the people who are likely to set the lifestyle trends in their own countries in the future. 2.3.2 Household energy consumption trendsThe vast majority of household energy consumption in Europe is in the form of gas, oil and electricity, although coal, coke and wood make a substantial contribution. During the 1990s, European households shifted the balance of their fuel mix away from oil and solid fuels towards natural gas and electricity. Table 2.3. Residential Energy Use, EU15, Mtoe
European Commission, 2003 The largest energy-using activity in households is space heating, which is provided mainly by the burning of natural gas, oil or solid fuels in central heating systems, stoves and fireplaces. Households also use gas and oil for water heating, and gas is used as a cooking fuel. Most other energy applications are based on electricity. The residential share of energy use and its rate of increase vary considerably between countries. Energy consumption is rising most rapidly in countries where current consumption levels are relatively low. Table 2.4. Household final energy consumption
Eurostat 2003g; New Cronos Household expenditure on energy. Europeans in 1999 spent, on average, 3-4% of their total household budgets on energy. The proportion ranged from 2.9% in the United Kingdom to 6.8% in Denmark. On average, electricity amounted to 40% of energy expenditure in the majority of the Member States in 1999, while Dutch and Italian households spent a higher proportion on gas (52.8% and 42.3% respectively). Solid fuels accounted for more than a quarter (28.4%) of energy spending in France and more than a fifth (21.5%) in Ireland (European Commission, 2001). The tax-inclusive prices of residential fuels and electricity increased between 1990 and 2002. The market for household fuel is affected more than the industrial fuel market by weather conditions, with colder years pushing up demand and prices (Eurostat, 2003c). Heating energy. The vast majority of household fuel use is for heating and hot water provision. Residential energy use per capita varies widely among European countries, from 150-350 kWh in Portugal, Spain and Greece, through 500-700 kWh in most of northwest Europe, to over 700 kWh in Scandinavia. Levels in most EU countries are fairly steady, fluctuating from year to year with the weather, but in a few, such as Greece and Spain, residential energy use increased steadily during the last decade. (WRI 2003) The energy efficiency of housing improved during the last decade but saving potentials are still estimated to be in excess of 20% (EEA 2002, E&E in EU). Demand is increasing because of the growing number of households and increasing floor space, along with a decline in energy prices. Box 2.4. Cooling energy A frequently mentioned reason for growing energy demand is air conditioning. Its level of use in Europe is indeed rising sharply. Between 1980 and 2000 a floor area of nearly 80 Million m² was newly-equipped (or renewed) with air conditioning facilities. This growth is partly related to climate changes but also to the development of the tertiary sector, especially office buildings. This explains the higher growth in central European countries (Germany) than in Portugal and France. Households still have a marginal share in this development. Center for Energy Studies, 2003 Electricity. The most environmentally significant trend in energy consumption over the last few decades has been the rapid increase in electricity use. The 90s showed a average growth rate of 2,2%. (EEA, 2002b). Table 2.5 shows the EU 15 average and countries differing most significantly from the average. Table 2.5. Electricity consumption of private households in GWh
Eurostat, 2003g; New Cronos Household appliances. Historically, growth in electricity consumption has mainly been due to the increasing stock of household appliances. However, a study on electricity consumption by domestic appliances in EU15 in 2001 showed a clear drop in energy consumption by major kitchen appliances (see Table 2.6). Altogether, the appliances included in the study consumed about 250 TWh of electrical energy in 2000, about 30 TWh less than in 1990 (Stamminger 2001). All of these household appliances are improving in energy efficiency. Table 2.6. Energy consumption of appliances, EU15 average per household
Stamminger 2001 All of these appliances are increasing in number in the EU15. There is more than one refrigerator per household. Roughly half of all households have a separate freezer. Washing machines were present within 90% of EU households in 2000, whilst dryers (27%) and dishwashers (37%) were far less common. Similar patterns, although at lower penetration levels, can be seen in the Accession Countries. Refrigerators are available in nearly all households in all countries. However, automatic washing machines are less common. In some countries the combination of automatic and non-automatic washing machines adds to a percentage comparable with the EU average. In others, such as Poland, both types add to much more than 100% (European Commission 2001). Where appliance ownership has saturated (refrigerators, freezers, washing machines), energy consumption appears to have passed its peak as stock is replaced with new, more efficient machines. By comparison, where the stock is increasing (dishwashers and tumble dryers), total electricity consumption is also rising. These data do not account for the reduction in energy use elsewhere, e.g. some studies have found that using a dishwasher requires less energy than hand washing of dishes. For most appliances, there is an energy benefit from replacing old stock with new, more efficient technology (Stamminger 2001). Rising income has combined with relatively stable or even falling prices for appliances, to encourage the ongoing expansion in electric appliance ownership. The price of major household (kitchen) appliances fell on average by 1.1% per annum (or 4.3% in total) during the 1990s. On average more than 30% of households buy at least one major household appliance within any year. Countries with high demand for large appliances also have a high demand for smaller appliances, and make more extensive use of repair services for their household appliances. (European Commission, 2001) While appliances are getting cheaper, the cost of repair services rose on average by 3.6% per annum for household appliances, and 2.6% per annum for other electronic goods (European Commission 2001). It is also becoming increasingly difficult to get appliances repaired, supporting the demand for new products. Box 2.5 Consumption of Information and Eurostat reports that on average in the EU people spend 3 hours 26 minutes per day watching TV although other studies find shorter viewing times (European Commission, 2001. The environmental implications are not clear as they depend on what viewers would do otherwise. A trip in the car would have a much greater environmental impact. On the other hand, TV viewing content may encourage environmentally intensive foreign travel or other consumption. Computer and Internet use may similarly be alternatives to environmentally damaging activities, or it may stimulate them. ICT has often been suggested as a means of reducing travel but by helping to strengthen international working and social relationships, and by enabling travellers to stay in touch with home, it may encourage more travel. Electronic goods. While energy use by kitchen appliances is declining, electricity use by electronic goods is rising. Major areas of growth include digital TV receiver-decoders, DVD players, personal computers and peripherals and computer game equipment. For these products, energy efficiency is rarely a purchase criterion. The price of recreational equipment is dropping very rapidly, most notably in the information technology sector, where the consumer price index fell on average by 12.7% per annum between 1996 and 2000. While 97% of private households in EU-15 have a colour TV, a growing number of households – especially where they include teenage children – now have a second or third TV. Further potential for TV sales and increasing energy use lies in the rising number of households, and in the upgrading to new technology, such as digital, wide-screen and plasma screen TV. In Accession Countries, most households have a TV but a significant proportion of these are black and white (Eurostat 2003e). Box 2.6 Entertainment technology Technological development is a major influence on household expenditure for entertainment. The 20th century saw a progression from the first wax cylinder phonographs, to wind-up 78rpm gramophones, to the long-playing record, to cassette tapes and video cassettes, and then to the CD and DVD. With each upgrade in the recording medium, earlier recordings are rereleased in the new form, creating a new market opportunity. In 2001 the average number of titles released for DVD sale per EU country (1 830) had already overtaken the release of video cassette titles (approximately 1 250). The average number of titles released for rental was much higher on DVD (1 562) than on video (634). Over the last twenty years, video cassette recorders (VCRs) have become a normal complement to the TV. According to the European Community Household Panel in 1996, the penetration of VCRs into homes was particularly dependent on the age of the head of household, as the lowest rates were found amongst adults aged over 65, either single (19.3%) or in a couple (45.7%), and retired persons (37.8%). Equipment rates generally increased with household revenue, from 46.0% amongst low-income households to 78.7% for high-income households (European Commission 2001). In 1998 DVD technology was launched in Europe. Since then it has rapidly gained momentum and is expected to eventually replace the VCR (European Commission 2001, Consumers in Europe). The number of households owning DVD players increased nearly threefold between 2000 and 2001. Despite the expectation that video tapes will become obsolete, more than 4 million EU households bought their first VCR during that period. Several eastern European countries have saturation rates similar to the lower third of EU countries. Table 2.7. Ownership of entertainment equipment
Eurostat 2003e As a new information and entertainment tool, personal computers entered households very rapidly. On average in the EU, about 8% of inhabitants owned PCs in 1991. Within ten years the figure had increased nearly fourfold to 31%. Dutch households were particularly well equipped in 2001, with 65.5% owning a PC, 17.7% a laptop and 9.1% a handheld, the highest rates by far in the EU (European Commission, 2001). Eastern Europeans also adopted PCs very rapidly, although from a lower level in 1991 and with a lower ownership level in 2001. Slovenia has an unusually high penetration rate, starting form 0.3 % in 1991 to reach 27 % in 2001 (Eurostat, 2003a). PCs are normally surrounded by a broad range of peripherals such as monitors, printer, scanners, etc. The technology for each device is under rapid technological development, producing new and better generations within 6 to 18 months. Age and income level are the most important factors in determining whether or not a household has a computer. A large difference in ownership levels also exists between unemployed persons (30.7% in 2001) and students (58.8%) or managers (60.2%) (European Commission, 2001). 2.3.3 Environmental effects of household energy trendsEnergy use contributes to a range of environmental pressures and is the major source of greenhouse and acid gases in Europe. The most polluting fuel, in terms of CO2, SO2, NOx and particulate emissions, is coal, followed by oil. Natural gas burns much more cleanly, can be used more efficiently in domestic boilers, and produces only 60% as much CO2 per unit of energy as coal. As Table 2.3 shows, during the 1990s, households in Europe continued a long term trend towards using cleaner and more convenient forms of energy – in particular shifting away from coal and oil towards gas and electricity. Hence, households are making a declining contribution to urban air pollution although this trend may reverse in future as gas consumption continues to grow. Box 2.7 Electrical and Electronic Equipment Waste On average in Europe a personal computer is in use for three years. Together with cameras, cellular phones, notebook computers, TVs and many other small electronic devices, they produce around 5.5-7 million tons of electronic equipment waste per year with a growth rate of 3-5%. The overall composition of electronic equipment scrap is characterized by a high metals content of more than 50%. This is dominated by ferrous metals. Plastics account for approx. 20%, glass contributes just under 10%. Disposal of electronic waste presents serious hazards associated with carcinogenic substances, which can be leached to soil and groundwater over the medium and long term. Uncontrolled landfilling also releases contaminants, with a time lag. Incineration or co-incineration of electronic equipment waste with neither prior treatment nor sophisticated flue gas purification poses a major risk of generating and dispersing contaminants and toxic substances. The EU Waste Electrical and Electronic Equipment Directive (WEEE) came into force on 13 February 2003. Meanwhile, the rapid growth in residential electricity use means that households are responsible for increasing levels of primary energy use, but fuel switching in the power sector is also leading to a reduction in environmental impacts. Power generators are also shifting away from coal and oil, towards gas, renewables and nuclear power. Household energy use, including power generation, accounts for 22% of total EU15 CO2 emissions. Emissions from both fuel use and electricity consumption declined during the 1990s. In both cases, energy consumption was increasing but there was a shift in the mix of fuels, from solid fuels and oil to gas. Nuclear power, hydroelectric power and renewables also increased their share in power generation. Table 2.8. CO2 Emissions from Residential Energy Use, EU15
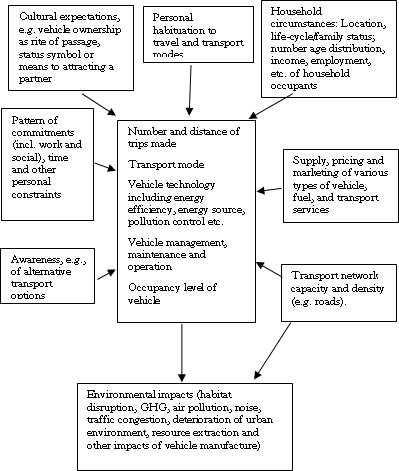
Source: authors' estimates based on Mantzos et al, 2003. The shift in the fuel mix can also be expected to have reduced other environmental impacts in the household energy supply chain, in particular acid gas precursors and particulate matter. In general, gas supply is safer and cleaner than oil or coal supply. However, the growth in nuclear power generation implies an increase in the generation of radioactive waste. Another environmental impact of energy generation is water pollution. An important emerging trend is the growing use of freshwater resources for cooling purposes in electricity production. While water used for cooling is generally returned to the source, it usually has a higher temperature than when it was abstracted. Thermal pollution of waterways can lead to oxygen depletion in freshwater ecosystems. Pollution of water and soil from energy use also occurs directly through leaking oil tanks and indirectly through acidic deposition caused by air emissions of NOx and SOx. This has led to severe effects on lakes and rivers and on forests in some regions, with damage to freshwater fish, other fauna, and habitats. (OECD, 2001b). 2.4 Personal travelOf the three household consumption clusters addressed in this chapter, personal travel is the fastest-growing. While food and agriculture have the largest impact on natural ecosystems, transport has perhaps the greatest impact in human settlements and on quality of life, as well as being a major contributor of GHG emissions. Because of its rapid growth and the self-evident problems of noise, congestion and urban air pollution, mobility has received a great deal of attention in the sustainable development agenda. However, it appears to pose some of the most intractable challenges to politicians and to citizens. If household energy use is inconspicuous consumption, car ownership and use is perhaps one of the most conspicuous forms of consumption. After the home, the car is the largest capital investment for most households. For many people cars, like homes, help to define and communicate their identity and status in society. But cars have also become part of the “habitus”, of the “ordinary” consumption that is necessary to live a “normal” lifestyle in most EU countries. The car emerged as the dominant mode of personal travel during the 1960s, and most people now find it hard to imagine life without one. Proposals for “sustainable” transport often focus on changes in car technology, to achieve radical improvements in energy efficiency, to change the powertrain, and to make use of renewable energy sources. While the growth in car use is now slowing (although not in the new EU Member States), aviation is of increasing significance as a transport mode. Like car travel, aviation is recognised as a sustainability policy challenge. Governments are ambivalent about aviation and most of their policies seek to promote it. There are so far no realistic contenders for an alternative energy source for aviation. And international travel remains one of the strongest aspirations among Europeans. 2.4.1 Influences on personal travelWhereas food and warmth are clearly basic needs for survival, personal travel is much more evidently a socially constructed need. In the mid-19th century, most people in Europe travelled only on foot. By the beginning of the 20th century, growing numbers were able to travel by bus, train and tram, the first urban metros had been opened in London and Paris, and the first cars were on the roads in France, Germany and Britain. It wasn't until the 1960s that cars began to take over as the form of transport for the majority, and by then, a new form of transport, aviation, was increasingly accessible. The desire to travel appears to be very deep-rooted. Children, perhaps especially boys, seem to have an innate fascination with wheeled vehicles, whether cars or trains. Adolescents long for their first motorbike or car – a rite of passage, practical means to personal freedom, and often a prerequisite for finding a partner. Adults, especially those with families, feel that they could not live without a car. So what is shaping car demand? Are there any grounds for supposing that it may one day stop growing or that an alternative mode of transport might emerge as preferable? For most of the last half-century, transport analysts and planners have viewed their role as one of providing for the public demand for mobility. People seem to want to travel, to get from A to B. They travel more as they get wealthier, and as the transport technology available to them gets faster and cheaper. The models used by governments to plan road systems rely on the concept of “trip generation”. People want to get from an “origin” to a “destination”, for whatever reason. Whether they make the trip or not, and the mode of transport they choose, depends on the distance between origin and destination, and the cost and speed of the various transport modes. The planners responded to the predicted demand by building roads, which of course made car travel faster, or at least created the capacity for more people to travel at the same speed, and traffic levels increased. In the last 20 years, this attitude of supply-side management gave way to a more complex view of transport policy. It was increasingly recognised that road-building helped to stimulate traffic. More attention began to be paid to settlement patterns – the locations and density of homes, work places and services – and their roles in shaping lifestyles and travel patterns. This section starts by reviewing the broad understanding of travel behaviour that is emerging. Some of the influences are identified in Figure 2.10. A complex system. Part of the challenge in making sense of transport policy is that personal travel is part of a complex system (Michaelis, 1997b). Transport technology, urban structures and road systems, home designs, patterns of work, shopping and leisure have all evolved together. The transport sector is a crucial part of the economy, thoroughly embedded in cultural life, a source of pleasure, interest, annoyance and grief. From the Industrial Revolution, society has organised itself around a succession of transport systems (Grübler and Nakicenovic, 1991), from canals to railways, then roads and most recently aviation. The current system, based on roads, cars and trucks, developed first in the United States and then spread to Europe. It is now becoming increasingly important in other parts of the world. The United States, as the first developer of the system, saw the slowest growth in car travel but now has a very high, and still rising, level of car ownership. Europe, as a follower region, is seeing faster growth but also shows signs of that growth slowing down (although not yet levelling off) at a lower level of car ownership. A major factor limiting growth of car use in Europe is the design of its cities, most of which were first built at a time when most people walked for most trips. Roads have been widened and parking spaces created, but traffic congestion is inevitably a much greater limiting factor in Europe than in America. Figure 2.10. Influences on personal travel and its environmental impacts
Economic influences on car ownership and travel patterns have been extensively researched. Car ownership increases with income. Several analysts find that historical data are consistent with car users having a constant budget (as proportion of income) for car use. This implies a price elasticity of car use with respect to total cost of -1, and an income elasticity of +1. But the income elasticity is much higher in the Accession Countries than in Europe. One set of transport scenarios assumed an income elasticity of demand of +2.5 in central and eastern Europe for the period to 2020. Table 2.9 summarises some of the econometrically derived relationships between the cost of travel and travel demand, as well as the level of car ownership and fuel economy. Table 2.9. Long-Run Price Elasticities of Travel Demand
Source: Michaelis, 1996b. Various factors in addition to transport costs and income affect travel activity, including household size, the occupation of the head of the household, household makeup, and location. People in higher-skilled occupations, requiring higher levels of education, are more price- and income-responsive in their transport energy demand than people in lower-skilled occupations. Families are more price- and income-responsive in the early years of child-rearing than in the later stages (Michaelis, 1996a). Car ownership, and the association of cars with personal status, has been encouraged in many countries by the use of company cars as a tax-efficient form of employment benefit. Once a household has access to a car, it usually becomes the main mode of transport. From the 1970s, companies developed quite detailed rankings of the types of car that could be provided to employees at different levels in the hierarchy. In Britain, company cars formed a large part of the new car market and were rapidly sold on as second-hand vehicles, tending to skew the characteristics of the national vehicle population towards larger engines and higher levels of in-car equipment than would be chosen by households buying their own cars. Settlement patterns and transport planning influence travel patterns in a variety of ways. Car ownership levels are highest in rural and suburban areas, and lowest in high-density city centres. While car ownership has been seen as a sign of affluence in Europe, in recent years it is the rural poor who have become particularly car-dependent. Within cities, the amount of traffic and the public choice of transport modes depends on the distribution of homes, workplaces, shops and services. In the 1960s, many city authorities adopted zoning policies, separating industrial estates from housing and creating growing transport demand. Since the 1980s, the development of out-of-town shopping centres has contributed to further growth in car use in many countries. The view among urban planners now is that the best path to more sustainable urban travel patterns is via mixed use development, with homes, shops, jobs and services co-located. However, in some European countries they face a major challenge in achieving this aim, with property prices within city boundaries often excluding many of the people employed there from home ownership and encouraging the growth of outlying villages and towns. Urban planners have tried a wide variety of experiments to manage car use, ranging from the urban motorways of Paris and Birmingham (aiming to get the traffic off the city streets) to congestion charging and pedestrianisation. While it is now apparent that urban motorways simply generate more city-centre traffic, no traffic demand approach has been fully satisfactory. On the whole, the emerging wisdom is that cities need a broad-based mix of measures to limit car use and provide for public and non-motorised transport (ECMT, 1995). Car-based lifestyles. Car dependency arises partly from the combined trends in infrastructure development, property and job markets, incomes and the relative prices of different transport modes. It is also part of a lifestyle that has emerged in Europe over the last 30-40 years. In surveys and focus group discussions, many people say that they cannot imagine life without a car because they simply could not carry out all of the tasks and activities that are now part of their life. Prior to the dominance of the car, lives were organised around local communities, with longer trips organised to fit in with public transport schedules. Car users have built their lives around the flexibility of the car. They combine shopping trips with travel to work or leisure outings. In-car storage space means that childcare equipment, shopping, and all kinds of personal effects can be carried around wherever they go. Socialising patterns have also developed to reflect the ease of travelling off the main transport routes. And cars have generated new patterns of dependency in relationships within families and communities, as children and teenagers need their parents to drive them wherever they go, and older people and others unable to drive require lifts to get out of their homes. Population mobility is a further major contributor to car dependence, as family members are increasingly scattered to different cities, and even continents (see below under aviation). No choice. Transport patterns are a classic example of the phenomenon of “lock-in”, where there appears to most people in the system to be no choice but to continue with the current combination of technologies and practices. Transport users feel that their choices have already been made by governments, local authorities, supermarket owners, vehicle manufacturers etc. Car companies and transport service providers argue that they are simply operating within the system, responding to consumer demand and subject to government regulation. Government officials also work within a culture that says that they must seek to support consumer freedom, and protect the competitive interests of companies. Car psychology. The car has become – perhaps always was – much more than a means of transport. In fact, car ownership has different meanings for different people. For a young man it may be a sign of virility; for a woman it may be a place of security from the dangers of city streets; and for the executive it may be a peaceful haven in which to unwind after a stressful day in the office. And for some, it is just a means of getting from A to B. Götz (2003) finds that transport users fall into four cultural clusters, with their own sets of values and priorities, travel behaviour patterns, and environmental impacts:
The wider set of social and psychological functions of the car have helped to shape the design of new vehicles. Indeed, manufacturers have nurtured the imagery associated with cars through their advertising, with the help of motoring journalists and enthusiasts. Vehicle types are increasingly designed in accordance with social function, from the sports utility vehicles that represent independence, fun, adventure and individuality for younger people, to the small minibuses that are “needed” by families to transport children and their friends (Schor, 1998). Bigger cars seem safer (at least for the occupants). Increased passenger space allows the driver to be sure of always being able to offer a lift. Meanwhile, car users tend to have a negative perception of other modes of transport. Götz (2003) finds that this is particularly true of his “status-oriented automobilist” cluster. Goodwin (1985) found that car users believed that public transport was both more expensive and less reliable than it actually is. Porter et al (1999) find that car users have much more realistic images of rail travel than of bus travel. Indeed, travelling by bus can seem socially challenging, as it involves much more personal contact with other travellers in a confined space than travelling by rail or car. Bus travel is also widely seen as a lower social status mode of travel than rail travel. Aviation. For most of the 20th century, the aviation industry was strongly encouraged by European governments, all of which had their own national airlines. Rapid growth in air travel in the 1970s and 1980s responded to, and helped to create, the demand for business travel. But with the growth of the charter flight industry, and more recently of the budget airlines, leisure travel has now taken over as the main area of growth. Europeans appear to have a strong taste for travel. Perhaps part of the desire to travel is simply linked to the fun and excitement of going somewhere else. But it is also part of the cultural value set and of the system of roles and identities within modern European society. Schor (1998) observes that many Americans appear to travel in order to talk about it afterwards. Young people are told that travel will look good on their CVs. It is an extension of the 19th century European tour that was part of becoming a cultured, sophisticated person. Like the car, air travel is becoming increasingly part of a normal lifestyle. As we develop friendships and working relationships in different countries, and as we meet and marry people from other parts of the world, aviation becomes necessary for basic social functioning. The environmental impacts are not well-understood by most travellers. It comes as a shock to most to realise that a long-haul flight typically involves burning half a tonne of fuel per passenger. The strong propensity to fly is reflected in very high income elasticities (in the region of 2 – i.e. each 1% growth in income leads to a 2% rise in air travel), and low price elasticities (in the region of -0.1) (Michaelis, 1997a). While there have been discussions in Europe of a tax on aviation fuel, it would be unlikely to have much effect on travel demand although it could encourage higher fuel efficiency. 2.4.2 Personal travel trends2.4.2.1 Household expenditure on travel Many studies have found that transport spending remains roughly constant as a proportion of household budgets. As Table 2.11 shows, the changes in the transport share are indeed quite small over the period 1990-2000, with most countries for which data are available seeing a slight decrease. Table 2.10 Changes in household spending on transport, 1990-2000
Source: Eurostat, 2003g, New Cronos However, within countries, the transport share of household expenditure increases with income. Vehicle operating expenses are a roughly constant proportion of household spending, but wealthier households spend a larger proportion of their household budgets on purchasing cars. The purchase of a car is usually the second most important household expenditure decision, behind the acquisition of a flat or a house. It is also the main component in transport expenditures (5-7% of total budget). Fuel accounts for approximately two thirds of that. Car maintenance and repair is an important additional component, accounting for 1% of total household budgets (Eurostat 2001, Consumers in Europe). The relative price of transport rose at a faster pace than the all-items consumer price index in every country (other than Greece) between 1996 and 2000. The index of consumer prices for transport (including transport services) gained 10% in the EU, while general consumer price inflation was equal to 6.4% (Eurostat 2001, Consumers in Europe). 2.4.2.2 Car ownership Car ownership in Accession Countries is below the EU15 average but comparable to the lower third of EU15 countries. Exceptions with ownership rates over 400 cars per 1000 inhabitants are Malta and Slovenia (EEA 2002a). Figure 2.12. Car Ownership (per `000 in population)
Eurostat 2003c Table 2.11 summarises survey results for EU countries on the level of car ownership at different household income levels and for different household compositions, as well as the reasons stated by households without cars for not owning one. As one might expect, wealthier households are more likely to own a car than poorer households. The households most likely to possess a car were those with two adults and dependent children. Young people also show a greater tendency to own a car. Portugal and Greece have the highest proportion of households unable to afford a car, while the Netherlands and Denmark have the highest proportion of households not wanting to own a car. Table 2.11. Car ownership in EU countries
Eurostat, 2001 2.4.2.3 Modal split Europeans travelled, on average, more than 10,000 kilometres during 2000 by car. The total number of passenger kilometres travelled by car grew, on average, by 3.1% per year from 1970. Only air transport recorded faster growth, with passenger kilometres increasing 78% during the last decade or 6% per year (see below). Travel by rail and bus is also increasing, despite reductions in the density of the railway network throughout Europe (Eurostat 2001). The increase in kilometres travelled is partly due to a growth in the number of trips, and also to an increase in average trip length. People are travelling further to shop, for example. Shopping accounts for a fifth of all personal trips (216 trips a year) 55% of which are food shopping. The average distance travelled per year for shopping is 1428 km, over a third of which (558 km) is for food. 60% of shopping trips are by car. 2.4.2.4 Roads 2.4.2.5 Car travel Total EU car traffic amounted to 3788 Billion passenger kilometres in 2000, an increase of 18,5% on 1990 (Eurostat, 2003g). Figure 2.13. Development of car mobility, EU15 and Norway
Eurostat, 2003g The number of car trips per person (on average 3 per day) and occupancy rates (1.66 persons per car) are ratios that remained relatively stable during the 1990s. On the other hand, the average length of each car trip has increased. The most significant category of car use is for leisure (40% of trips), ahead of commuting purposes for work or education (30%) and shopping trips (20%) (European Communities 2001). The average car fleet renewal rate in EU 15 was 8% in 2000, implying an average 12.5 years of use for each car. The number of petrol cars fitted with catalytic converters has grown rapidly since their mandatory introduction for new cars in 1993. As a result, some 58% of all passenger cars in the EU had a catalytic converter by 1998 (European Communities 2001). Additionally, newer cars have lower fuel consumption (on average below 7 litre/100 km) than the fleet average of 8 litre/100 km. This is partly a result of the voluntary agreement between car manufacturers and European Commission. The improvements in fuel economy to date are estimated to have improved the fuel economy of the entire EU car fleet by 2% (EEA 2003). 2.4.2.6 Fuel use There has been a marked growth in the proportion of unleaded petrol consumed during the 1990s. The price of unleaded gasoline was kept low during the early 1990s to encourage conversion from leaded, largely with the aim of reducing lead pollution. The shift was further encouraged with the introduction of catalyst-equipped cars, which cannot use leaded petrol. The unleaded share rose to 80% in the EU in 1999 and by 2000 only Greece, Spain and Italy continued to receive deliveries of leaded petrol, along with the Eastern European countries. Between 1991 and 2002 the retail (tax inclusive) price of unleaded gasoline rose by 59% while the price of diesel increased by 39%. However, on average, diesel prices remained about 25% cheaper than unleaded gasoline prices. Both fuels exhibited price volatility over the period 1990 to 1999 reflecting global oil market developments. In 2000, the price of unleaded gasoline and diesel increased due to the rise in world oil prices and remained rather high for the next two years (Eurostat 2003). 2.4.2.7 Aviation The number of international passengers carried from or to EU Member States in 2000 was 434 million, an increase of 8.7 % compared to 1999. However, 2000 was the last year of substantial growth before the events of September 2001, which have significantly affected the airline industry. 12% of the total international intra-EU passenger volume in 2000 represented movements between the UK and Spain (both directions) alone, 9% between Germany and Spain (both directions). Among routes with a volume over 50,000 passengers, the Liverpool-Palma route recorded the highest growth rate (+171%) (Eurostat 2003h). These trips are clearly linked to holiday and leisure. Table 2.12 Development of aviation passenger transport
1estimated Figure 2.15 Development of aviation passenger transport
Eurostat 2003h 2.4.3 Environmental effects of travel trendsThe environmental effects of personal travel include:
The most significant single contributor to the environmental impacts of the sector is car use, however, aviation is growing in environmental significance. The transport sector accounts for about 32% per cent of European final energy use and 29% of CO2 emissions (European Commission 2003). Since the sector is almost entirely dependent on oil (the main exception being electrified railways), energy use and CO2 emissions are directly linked. EU 15 energy consumption, and hence CO2 emissions, in transport were 22% higher in 2000 than in 1990. Increases in energy consumption can be observed in all modes of transport: 10% in rail transport, 19% in road transport and 58% in air transport. The road share of transport energy consumption fell within Europe on average because of the growth in aviation. However, several individual countries saw an increase in the road share, including Greece, Portugal and Spain, as well as the eastern European countries. The large increase in energy use in air transport results from the growth in air travel in the EU 15 between 1990 and 2000. Over the same period, in the Accession Countries energy consumption by rail transport fell by 33%, while that of road transport rose by 26% (Eurostat 2003c). In Europe, over 80% of transport energy consumption is by road vehicles. Estimates of the share of road fuel used for private consumption are based on survey data as fuel retail statistics do not distinguish consumption by cars and other vehicles. However, surveys in industrialised countries typically show that personal vehicles consume about two thirds of road fuel, with goods vehicles taking most of the remainder. Toxic pollutants from the sector include lead, various types of particulate matter, volatile organic compounds, nitrogen dioxide, carbon monoxide, ammonia and sulphur dioxide. Ozone is also formed from atmospheric reactions of NOx and VOCs. NOx, CO and VOCs from cars declined during the 1990s due to introduction of catalytic converters from 1993. Between 1990 and 2000, SO2 emissions from road transport were reduced by almost 76% in the EU 15 and by 74% in Accession Countries. The reduction is mainly attributed to the low sulphur content gasoline which has been made available in several member states since 1992. 3 The Context: Demography, Economy and TechnologyChapter 2 identifies some of the areas of consumption that are responsible for the greatest environmental damage and resource use, and those that are emerging as having significant environmental impacts. It also explores some of the influences underlying consumption trends in those areas. The current chapter explores some of the links between consumption and the wider context in European society, in particular in demography, the economy and technology. 3.1 DemographySeveral demographic trends are linked to the growth of consumption. This section briefly reviews the links to population growth and the demographic transition, migration, urbanisation, the ageing of the population, and the trend toward smaller households. 3.1.1 Population growth and migrationImproved public health and medical care enabled a near-doubling of the European population during the 20th century. But the food supply has grown faster, and the productivity of agricultural labour has increased faster still, so that the population has been able to move from agricultural labour to industry, and then to work in services. In general, the physical quality of life is greatly improved, at least as measured by life expectancy and physical health. Fertility rates have declined in recent decades from their peak in the 1960s. Among European Union countries, women on average have 1.7 children over their lifetime, too few to maintain the population level through reproduction alone (Eurostat, 2003). Nevertheless, in western Europe the population continues to grow by about one million per year, mainly because of net immigration. In central and eastern Europe, the population has been roughly constant since 1988. The so-called “demographic transition” to below-replacement fertility levels is closely connected with some of the influences on consumption discussed in Chapter 2. It follows on from the development of the contraceptive pill. The greatly increased personal choice and freedom helped to generate the individualisation trend that is shaping the way we eat, travel and use our homes. Reduced family sizes have given parents more time to pursue their own interests or careers, the option of spending their income on their own consumption rather than on raising children, and the ability to concentrate more of their resources on the children they have. Individual children now are more likely to have their own bedrooms, and have much more influence over family choices. Consumer sovereignty starts young. Lower fertility levels combined with the increase in mobility also mean that people are less likely to live with their families. Households are getting smaller, but the housing space per person is increasing, contributing to higher levels of material and energy consumption. Increasing divorce rates contribute to the smaller household sizes and to an increasing amount of housing required per person, as absent parents have rooms for their children to stay in. Increasing migration has probably had more influence on other world regions than on Europe, by creating family links between Europe and other parts of the world, and so contributing to the export of consumer culture. At a superficial level, immigration has clearly contributed to the diversification of consumption patterns within Europe, with the introduction of cuisines, clothing styles, art and music from other world regions. At a more fundamental level, the mixing of cultures and religions has helped to challenge the dominance of traditional European cultures. In breaking down cultural assumptions, it has again paved the way for the growth of individualism and pluralism. As Chapters 4 and 5 will show, these two trends have important consequences for consumption and for the potential for coherent responses to the sustainability challenge. 3.1.2 UrbanisationThe 20th century saw a large shift in the rural-urban balance of population in most European countries, continuing a process that had begun early in the 19th century. In Europe, the urban population was about 38% of the total in 1900 (Bairoch, 1988). There were substantial variations between countries and regions, and Table 3.1 shows how urbanisation proceeded from 1950 to 2003. Table 3.1. Urbanisation in Europe, 1950-2003
Sources: UNPD, 2001, 2003 Urbanisation was a key part of the emergence of the consumer society. This process was underpinned by increasing agricultural productivity, which enabled a growing proportion of the population to work outside food production. It permitted the growth of the industry and commerce that supply goods and services for consumption. But urbanisation may have also helped to create the demand for consumer goods. Kempton and Payne (1997) suggest that, in crowded city life, where it is difficult to know one's neighbours intimately, social status and community position are increasingly established and communicated through visible display of material possessions. Hence, it is in urban areas that “conspicuous consumption” (Veblen, 1898) and the demand for “positional goods” (Hirsch, 1976) are most pronounced. However, in Europe now, there is little difference in consumption levels between sparsely and densely populated areas. The highest levels of household consumption are found in areas of intermediate population density – i.e. wealthier suburbs – rather than in high-density city centres (Eurostat, 2001). 3.1.3 AgeingWith increasing life expectancy, radically reduced child mortality, and lower fertility levels, the European population is ageing. This is creating a challenge for governments, especially in countries where the state is the main pension provider. As the working age population shrinks and the retired population grows, falling tax revenues have to pay for growing pension and health bills. A number of solutions are being explored (Casey et al., 2003). Many governments are raising the retirement age or reducing the pension and other benefits available in retirement, especially at early retirement. Some are encouraging the take-up of private pension plans. A few are actively encouraging immigration of working age people. In the short term, some increase in consumption as a proportion of national income might be expected as a result of ageing. On average, over-60s are less wealthy than younger people, and their household expenditure is lower, but they are at a phase in their lives when they are running down their investments rather than increasing them. Many who were young adults during the boom years of the 1950s and 1960s, and who also were able to establish generous final salary pensions, now have the opportunity to travel and otherwise enjoy their retirements. The ageing process may slow GDP growth as people spend more of their life in retirement (OECD, 2001), although it is also possible that it will become the norm to retire later as state pension provision becomes increasingly inadequate. Households headed by older people generally spend a higher proportion of their expenditure on food and health care, and less on transport and recreation (Eurostat, 2001). Nevertheless, people do tend to follow social trends through their lifetime, spending more on transport, for example, as they get older (Greening and Jeng, 1994). As successive cohorts reach retirement age, expectations of an active retirement are likely to increase. In the long run, it is possible that the expectation of a longer life, and the reduction in state pensions, will lead a greater awareness of the need to provide for the future. This might result in higher rates of saving and lower levels of consumption among younger adults, while people will spend more in retirement. 3.2 The Economic ContextThe economic context influences consumption in a wide variety of ways. Figure 3.2 illustrates just a few of the connections in a highly complex system. It focuses on the chain of influences on household consumption, but of course the various institutions and markets are all highly inter-connected and all of the influences operate in both directions. Figure 3.1. Some economic influences on household consumption
This section focuses on three groups of influences on household consumption:
3.2.1 Supply of goods and servicesOne major feature of the consumer society in the last 20 years has been the diversification of goods and services. Whereas the early years of mass consumption focused more on quantity and cost reduction, companies now work increasingly hard to find and develop market niches. For many, diversification and innovation is a matter of survival. Another widespread pattern is consolidation. One way to go on producing the same product, and to have consumers continue buying it over the long term, is to stay ahead of the competition in terms of both quality and price. Companies often seek to keep up with the competition, maintain market share, diversify their product portfolio and keep their costs down through mergers and takeovers, especially in the food, cleaning materials, transport services and energy industries. Hence, consumers are faced with institutions of growing cultural and political power, whose main objective is to sell them goods and services, and to find new ways of persuading them to consume. While companies are sometimes painted as the villains of the sustainable consumption challenge, they have little choice but to compete to sell more products and services, and to increase market share. It is extremely difficult in the current business environment for company boards to pay attention to issues such as sustainable development. Their top priority, often by law, is to meet the priorities of shareholders, whose main concern is to maximise the return on their capital. Meanwhile, governments regulate to encourage competition and minimise the prices of goods and services. 3.2.2 The job marketEmployment markets differ significantly among European countries, but there is a general trend away from the certainty of a job for life, towards a need for workers to be flexible. Instead of having a well-defined trade or profession, we are increasingly expected to have a personal curriculum vitae, which expresses our own unique experiences and qualities. Beck (1988) links this trend in the labour market with the broader cultural process of individualisation, which was connected in Chapter 2 with the trends in the consumption of food, transport and household energy. The job market also helps to lock people into a high-consuming lifestyle in a variety of ways. Employers generally prefer to have their employees work longer hours (perhaps earning overtime pay) rather than to take on new staff and incur additional training, insurance, office accommodation and other costs. At the same time, in an uncertain job market, employees need to strive to prove their value to their employers. One of the results is a culture of excessive working hours, common in the United States (Schor, 1998) and the United Kingdom, as well as some other European countries (Sanne, 2002). There is a significant counter-current to the overwork culture, most notably in some Scandinavian countries, and in particular in the recent introduction of a 35 hour working week in France (see Table 3.2). Table 3.2. Working hours and holidays in the EU15, 2003
Source: Incomes Data Services Ltd. (www.incomesdata.co.uk), 2004. Demonstrating employability also depends on having a healthy-looking progression of salary increases on one's CV. Hence, overwork is motivated by the fear of being left without a job, more than the desire to earn more money, and those in highly competitive job markets may be working and earning more than they would otherwise wish. The other side of what Schor and Sanne call the cycle of “work and spend” is that staying in the job market requires people to consume. Many jobs depend on being able to drive. Getting to work usually depends on having a car. Looking respectable in the office may mean wearing expensive clothes that need to be dry-cleaned. And for many, working long hours stimulates higher levels of expenditure on convenience foods and appliances, toys and entertainment equipment for the children, and foreign holidays to let go of the stress (Schor, 1998; Sanne, 2002). 3.2.3 Savings and creditAnother major engine of the consumer boom has been the growth of consumer borrowing, whether in the form of mortgages, consumer credit or bank loans. The forms and extent of borrowing differ considerably among European countries. The largest single loan taken out by most households is to buy their home. As Figure 3.3 shows, the level of mortgage debt is rising throughout Europe, although it varies from country to country depending on the form of the housing market and the way purchases are financed. Overall in the EU, 22% of the population have mortgage loans. In Denmark, the outstanding debt is comparable with one year's GDP. Consumer credit is also growing and takes a variety of forms. Hire purchase loans (provided by the seller to purchase a particular item) are particularly common for buying cars and other expensive items, including computers. In the EU, 11% of the population has an outstanding car loan and 9% has outstanding loans on other goods. The use of credit cards is growing rapidly. In 1999 there were 215 million credit cards in the EU, with a growth rate of about 16% per year. These are in addition to store cards, payment cards, and consumers drawing on overdrafts in their current accounts. Again, the level of credit card and current account debt varies considerably between countries (ECRI, 2000). While credit clearly makes life easier for many consumers, its growth results largely from a commercial imperative. The financial services industry has been one of the most buoyant sectors of the economy in recent years. One of its most lucrative sources of profits is the high interest rates charged on consumer credit, and especially credit cards. The proportion of income saved in the EU fell through the 1990s to about 9% in 2000, partly as a result of the growth in credit. While the savings ratio is much higher in Europe than in the United States, it is much lower than in Japan. It seems possible that the shift towards private pension provision as a result of ageing, as discussed above, will lead to an increase in savings and a decrease of the proportion of income spent on consumption. 3.2.4 Resource efficiency and technological innovationEconomic efficiency and profit maximisation underpin economic growth, and economic growth is one of the most important indicators of a successful government. This is despite growing recognition among experts and in organisations including the OECD and the World Bank that GDP is a poor indicator of welfare (Jackson and Marks, 1999; World Bank, 1997). Economic growth is not in itself a problem for the environment, the problem is the depletion of resources and release of persistent toxic substances into the environment. Perhaps one of the central questions within the sustainable development agenda is whether technological innovation can decouple consumption from resource use and environmental damage. Environmental experts have argued that factor-of-ten improvements in resource efficiency are needed over the next 30-50 years. Resource use would be cut by a factor of five, while the economy doubles in size. This aim has found considerable support in some government and business circles, including discussions at the UNCSD and the OECD. Publications such as Factor Four (von Weizsäcker et al., 1997) and Natural Capitalism (Hawken et al., 1999) have also encouraged a hope that technology might deliver resource savings without lifestyle changes. However, a review of historical rates of change in resource productivity, in a variety of countries, sectors, and economic and political circumstances, suggests that technology could deliver at most only about half of the Factor 10 target, which would require annual improvements of 5-8% per year (see Table 3.3). Table 3.3. Historical increases in a range of productivity indicators (OECD, 1998)
Sources: a: Maddison, 1995; b: OECD and IEA statistics; c: WRI, 1997; d: Schipper, 1996; e: ICAO statistics; f: Tuppen, 1997. The higher rates of productivity increase in this table are associated with a variety of influences: competitive pressures; strong price or regulatory incentives; catching up or recovery; or a good “climate for innovation”. Mostly, the circumstances for rapid change do not last long, although some sectors have sustained very fast improvements over considerable periods. These examples do not help us to predict exactly what rate of improvement in resource efficiency might be possible but they help to identify some challenges for governments. Obvious areas for action include: reforming government policies that limit competition in resource-intensive industries; removing subsidies and other policies that encourage resource use and environmental damage; and internalising externalities. Unfortunately, this is not an easy recipe. The more rapid rates of change in Table 3.3 have occurred only in response to very strong price signals: nominal aviation fuel prices increased nearly ten-fold between 1970 and 1980. Nominal crude oil prices increased by a factor of 30 in the same period while real prices rose ten-fold. It is not surprising, then, that the aviation industry and industry in general made huge efforts to reduce their oil consumption, effectively “decoupling” CO2 emissions from economic activity. Experience with rapid “catching-up”, for example in Japan during the 1950s and 1960s, can help to give some insight into the potential for whole sectors or economies to move towards “best practice”. The Japanese experience is often used as a model for creating a “climate for innovation” (e.g., Freeman, 1987; Rosenberg, 1994; Wallace, 1995). Another observation from Table 3.3 is that economy-wide changes are much slower than changes in industrial sectors. A key challenge for policies to promote sustainable development is to achieve more rapid change in consumption patterns. 3.3 Linking technology and consumptionTechnologies influence everyday life in a variety of ways (Røpke, 2001). Some inventions, such as the refrigerator and the internal combustion engine, perform pre-existing functions more cheaply and efficiently than the previous technology. Others, such as radio and the phonograph, perform functions that had not previously been anticipated. Either way, they stimulate increased consumption. Economic analysis tends to focus on these two results of technological change: improving the efficiency of supply of goods and services, and generating new goods and services. But technology and consumption are intertwined in more complex ways. Technology shapes our worldview, which in turn shapes behaviour in all sorts of ways, including feeding back to the direction of technological development. In considering how recent and ongoing technological innovations may change life over the next 30 years, the following “taxonomy of innovations” (derived from Freeman and Perez, 1988) could be used as a guide to different types of change.
This typology is illustrated in Figure 3.1 which also shows how technological change is linked to human behaviour and consumption. On the whole, the greater the technological change, the larger the behavioural change that is required to accompany it. This human dimension of technological change is often ignored in the advocacy of new, “sustainable” technologies. An innovation such as an alternative transport fuel or a compact fluorescent light bulb appears to offer performance comparable with that of the conventional technology. But there are many small subtle differences in the way the technology fits into the life of the user – and some, such as up-front costs, that are not so subtle. Hence, government programmes to introduce new technologies have often had disappointing results. All technological innovations entail behavioural change somewhere in society, even if only during the production process. This behavioural link is a major part of technological “lock-in”, a phenomenon widely observed by historians of technology where a particular technology becomes dominant despite the existence of apparently superior alternatives (Rosenberg, 1994). An often-quoted example of lock-in of is the QWERTY typewriter keyboard, which is designed in a way that avoids the keys sticking in a mechanical typewriter but is not necessarily the best layout for a computer keyboard. Where technologies become locked in, they are often connected with behavioural patterns that become similarly fixed. It then becomes extremely hard for any alternative technology or behaviour to compete. Lock-in can have tremendous social, economic and environmental significance. Perhaps the best example is the car. Mass car ownership was pioneered in the United States before the Second World War, while Europeans followed mostly in the 1950s and 1960s (see Table 3.4). By the 1970s, car ownership in western Europe had risen to levels in the region of 250 per thousand in the population, so that the majority of households had a car. By 2000, with ownership levels in the range 350-550 per 1000, there is more than one car per household. Table 3.4 Cars in Use (per `000 in population)
Source: Maddison, 1995; 2003; Eurostat, 2003; Davis, 2001 It is now hard for many West Europeans to imagine a lifestyle that does not depend on car travel. Other transport modes have become uncompetitive, as off-peak usage declines, and they fail to keep up with the falling real costs of car use. Work, shopping and leisure are increasingly organised around the car. Non-car owners are disadvantaged in a growing range of normal activities. Where technological innovations do succeed, they can have unexpected effects on social structure and culture. Long before the 20th century, one of the most significant culture-changing technologies may have been the printing press. Eisenstein (1983) suggests that this 15th century development may have given rise to modern science and the European Enlightenment. It may even have transformed the self-conception of modern Europeans through exposure to others' ideas and the development of a much richer interior life. It may be too early to tell how 20th century technologies are changing culture. Putnam (2001) identifies the television and the car in particular as having contributed to increasing individualism and the decline of community participation. A host of technologies, such as television, personal stereos and computer games, may be contributing to a decline in communication within families. They may also be bringing about psychological shifts – for example, in cognitive and emotional development, self-image, and models for social interaction. In recent years, the mobile phone has brought new changes, offering the promise of much greater connectedness within families and social groups. Rapidly declining telecommunications costs are contributing to the strengthening of international relationships and networks. Continuing technological innovation is motivated by some of the tensions inherent in modern society (Røpke, 2001). Some of these tensions are practical – for example, between the desire for material consumption and the need to protect the environment. This tension may be addressed, if not resolved, by developing more eco-efficient technologies. Others are cultural – for example, between desires for individual freedom and family belongingness. This particular tension may be partly addressed by the freezer and microwave oven, which allow families to eat diverse individual meals together. 4 Understanding Cultures of ConsumptionChapter 3 described some of the dynamics that help to shape the economic and physical infrastructure in which consumption takes place, the supply of consumer goods and services, and consumers' financial resources with which to buy them. But perhaps the hardest challenge in considering the future of consumption is to produce an adequate description of the psychological, social and cultural processes shaping consumer tastes, preferences and behaviour. Policy analysis, grounded in the economic theory of utility, often views consumption as the principal way in which people achieve individual and collective well-being. Consumers are assumed to act rationally in the market according to their personal preferences, to maximise their own satisfaction or utility. The economic approach is certainly useful for tackling some policy questions, but avoids the question of how preferences arise. The policies recommended by economic analysts do not seek to shape preferences, but to satisfy them (including social and environmental preferences). The central policy goal is to maximise the consumer utility function deduced from consumer behaviour (which is assumed to indicate consumer preferences). This approach leads to policies that support consumption of more of the same. Research by psychologists, sociologists and economists into satisfaction and well-being calls the mainstream assumptions into question. Firstly, consumers do not behave according to the economic concept of rational optimisation (Dietz and Stern, 1995; Jaeger et al, 1998). Even when making considered choices, we are only able to consider a small number of variables, leading to behaviour better described as “satisficing”. Much of our behaviour is habitual. Choices are often better understood as a process of internal debate among alternative scripts, rather than an internal optimising algorithm. Hence, we are guided by the scripts available to us – to a large extent supplied by the people around us and through the media (Dennet, 1993; Dickinson, 1998). Secondly, we do not necessarily use these decision processes to choose behaviours or options that will increase our personal satisfaction. Although we do appear to be strongly motivated to pursue wealth, Argyle (1987) and Inglehart (1996) find that increasing income and consumption is correlated with satisfaction only up to a point. As discussed in Chapter 3, public surveys from a number of countries show that, once national average income exceeds about US$10,000 (€8,000), further GDP growth does not appear to make people happier. Argyle finds that some of the most important determinants of happiness are health, family relationships, friendships and having meaningful work. Those with a high relative income are more satisfied than those with a low relative income, but the absolute level of income is unimportant provided basic needs are met and individuals are able to function normally in society. Figure 4.1. Supply-chain view of processes to meet human needs
Figure 4.2. Alternative view of the link between the production/consumption system and meeting human needs
One of the challenges in thinking about consumption is getting away from the understanding that tends to dominate economic and government thinking. Figure 4.1 illustrates a supply-chain view of consumption and its environmental and resource impacts. According to this perspective, human needs are met by consumption. Consumption depends on the production and supply of goods and services. There are impacts on the environment throughout the supply chain including the production, use and disposal phases. The challenge for sustainability is then to maximise consumption while minimising the environmental impacts. This is not the only way of thinking about the various activities that surround production and consumption. Figure 4.2 turns the supply chain conception of human needs around. In fact, all of the phases of supply, use and disposal contribute directly to meeting human needs. The activities are likely to be shaped by the needs of those who carry them out, and those who are affected directly and indirectly by them. Including this alternative perspective suggests that we may need to think in much more complex ways about the many goals that need to be addressed in the search for sustainability. 4.1 Individual motivation, habit and needThe human motivation to consume is often described in the language of needs, wants and desires. However, “need” is an elusive concept unless it is clearly linked to a particular objective. While some needs are founded entirely in individual physiology, many of our needs result from interaction with our social context: we need a basic level of nutrition for physiological survival; we need socially appropriate clothing to walk the streets without shame. Thus Maslow (1954) distinguished basic physiological and safety needs from needs for belongingness, esteem and self-actualisation. He initially proposed that needs formed a hierarchy, so that belongingness would only become important for people who had already satisfied their physiological needs. But it is easy to find counter-examples, such as people who have starved to death rather than lose their self-esteem (Douglas et al, 1998). Maslow later reconsidered the idea of the hierarchy but his categories of needs remain useful. Other writers have developed a variety of theories of human need (e.g. Max-Neef, 1991; Doyal and Gough, 1991). Max-Neef, in particular, distinguishes “needs” from “satisfiers”. Many types of satisfier may be able to meet any given need – e.g. different types of food to provide basic nutrition. We may sometimes choose false satisfiers – e.g. eating to remediate a feeling of emptiness associated with a lack of direction or a weak sense of personal identity. False satisfiers are often habit-forming and some, such as certain drugs, are harmful. Our perceived consumption needs are almost always socially contingent; appropriate satisfiers depend on the social context. We can understand some needs in terms of the capabilities required to function satisfactorily in society and hence to flourish (Sen, 1993). Satisfiers may include appropriate clothing, mobility, education and much else. Nussbaum interprets capabilities as freedoms, and hence links them to the more political concept of rights (Nussbaum, 1998). Perhaps we can agree on some basic and universal human needs (Doyal and Gough, 1991), but it might be more transparent to call these rights. 4.2 Consumption as a collective phenomenonEven where the social contingency of consumption is acknowledged (e.g. OECD, 2002; Røpke, 1999; Jackson and Michaelis, 2003), culture and social structure are usually understood primarily as influences on individual choice. While this focus on the individual is a useful and valid perspective, it is not the only one (Jaeger et al, 1998). Individual behaviour can also be understood as a phenomenon of the group. Practices may emerge in a community or society without any individual ever making a conscious choice. In any case, there is considerable evidence that our sense of individual agency is at best transitory, and in many circumstances illusory (Dennet, 1993). Consumption is perhaps one of the realms in which it is most obvious that behaviour is established at least in part by the social context. That context has many components and we operate in a variety of communities and social realms (see Figure 4.3). In these various realms we may be influenced both to adopt normative consumption behaviours, and to develop behaviours that differentiate us, defining and communicating our unique personal identities. 4.2.1 Positional consumptionCritiques of consumerism have often focused on status seeking behaviour – the desire to “keep up with the Jones's”, or even to do better than them. There is a pressure to differentiate our consumption, to prove and communicate our identity. It is perhaps in the discussion of competition for status that it is most apparent that individuals may be motivated to increase their consumption levels without improving their quality of life. The 19th century critique of the “conspicuous consumption” of the lower middle classes by Veblen (1898) is taken up in less snobbish terms by Hirsch (1977), with his discussion of positional goods and the need to establish social limits to growth, and by Frank (1985) in his work on “relative consumption”. Schor (1998) finds in the United States that television plays an increasingly strong role as celebrities are emulated as if they were high-status members of viewers' own communities. TV viewers try to keep up with the high-consuming lifestyles portrayed in primetime soap operas, rather than with their own next-door neighbours. However, surveys and focus group studies find that status consumption is associated mostly with certain cultural subgroups. In studies in Britain (Dake and Thompson, 1999; Hines and Ames, 2000) these subgroups appear to be in a minority but such groups tend to be highly visible because they are consuming for public display. In Hines and Ames study, the consumers most likely to discuss consumption choices in their peer group, and most concerned with brand names and image, were younger than average. 4.2.2 ConformitySchor (1998) finds that consumption is driven as much by the desire to belong to a group as by the desire for status. Thus, a large car enables parents to participate in a group of people who drive each other's children to school. Participation in social groups may require particular standards of dress, and reciprocity in treating others to restaurant meals. When it is clear that the alternative to belongingness is to be socially excluded, this kind of consumption appears less a luxury and more a necessity. Chapter 2 noted that Bourdieu (1984) provided an empirical demonstration of the social determination of taste for inhabitants of Paris suburbs. People may adopt the consumption patterns of those around them simply because those are the options that are available; because they are emulating their parents and peers,; or because departures from the norm are viewed negatively, criticised and punished. We internalise consumption norms in many different ways, and in different contexts:
The social influence takes place at many different levels, within households and organisations, in local communities and cities, in nations and internationally. The media are a major part of the social influence on consumption (Michaelis, 2001). Surveys find, depending on the approach, that Europeans spend somewhere between 2 and 3½ hours per day watching television, twice as much time as they spend socialising (Eurostat, 2001; 2003b). Baudrillard (1970) is scathing about the conformity of the majority in a system of mass consumption, promulgated through the mass media. Beck (1988) writes of “individualisation” in modern society as the illusion of individual choice and freedom which is actually conformity to a new set of social norms. We talk and think about ourselves as if we were free but are in fact trapped by a system that forces us to establish an identity – a story about ourselves – that will endure as we move through portfolio careers and ephemeral communities. 4.2.3 Lock-in and “ordinary” consumptionChapter 3 addressed the role of technology, markets, and the physical and economic infrastructure in shaping and sometimes “locking-in” consumption patterns. These practical influences are quite widely acknowledged and fairly well understood by policy analysts. But social and cultural circumstances also contribute to a sense that consumption patterns are locked in (Sanne, 2002). We are captured by pressures to standardise our behaviour arising from the need to succeed in the job market, to behave in ways that are consistent with others' expectations. Once we accept a normal role in society – parent, employee, participant in social and civic activities – a great deal of “ordinary” consumption becomes almost inevitable. Those who do not own homes are subject to the condescension of local governments and communities; those without cars have a limited choice of work, home and services; and those who do not eat a “normal” diet may be constrained in their ability to maintain a social life and to spend time away from home. These pressures go a long way to explaining the apparent increase in citizens' “need” to consume (Segal, 1998). 4.2.4 Consumption, symbolism and identityThe role of consumption in formation and communication of identity has been explored in a variety of contexts. Douglas and Isherwood (1978) show from ethnographic studies, for example, how consumption is used to establish suitability for marriage. Csikszentmihalyi and Rochberg-Halton (1981) show the importance of material possessions for personal identity and a psychological sense of meaning. However, the nature of the symbolism and the implications for the environment vary considerably among different cultures (Ger et al, 1998) – for example, a pressure cooker may represent a modern lifestyle in Turkey but simple tradition in Denmark. The advertising industry has made particular use of the symbolic function of consumption, and indeed has augmented it tremendously. For example, TV advertising makes use of sophisticated artistic and dramatic techniques to create associations between particular brands and deeply held values in the collective consciousness. A make of car might represent reliability. A brand of coffee might symbolise sophistication. Or a clothing label might be associated with celebrity and status. The associations are also made with idealised lifestyles and identities – happy families use the right kind of ultrasoft toilet paper. Independent and confident young people use a certain underarm deodorant, and so on. 4.3 Collective discourse and personal tasteDespite the importance of the social forces and mechanisms mentioned above, it is perhaps discourse and narrative that is of most interest in the context of sustainable consumption (see box). It is through discourse that we question and affirm the values, goals and priorities that shape our system of production and consumption. We use discourse, in our own minds and with others, to make our conscious choices about how to live and consume. And it is partly through discourse that we learn from parents, teachers and others to associate particular practices with values, status and belongingness, and with meeting our own needs. Dickenson (1998) describes how people draw on discourse from many types of media content to construct their own narratives about food and food choices. Box 4.1. Discourse and Narrative Our thoughts form internal narratives about our values, goals, the world around us, other people, and the way we should behave. They are fundamental to our sense of self (Dennett, 1993). They also lie at the heart of our sense of meaning, whether we describe it in terms of divine purpose, biological evolution, pleasure or survival. Hence, narrative helps to shape the identities, worldviews, values and symbols that are associated with lifestyles and consumption patterns (Jackson and Michaelis, 2003). Narrative is one of the main links between individual and collective choice. We express our narratives and they may be modified through dialogue or discourse with others – especially with people particularly significant to us such as parents, teachers and friends. Our narratives draw increasingly on discourses from the media (Michaelis, 2002). We may also conduct discourses in our own minds, helping to develop our personal narratives. Current mainstream discourse, emerging over centuries of debate by philosophers, theologians, scientists, economists and politicians, encourages material consumption by emphasising:
Thompson et al (1990) help to characterise the diversity of worldviews and discourses with “cultural theory” (CT). CT analyses social groups and cultural orientations along two axes: “group” and “grid”. Strong group implies strong links between people. Strong grid implies a high level of social differentiation. Strong group, strong grid gives a hierarchical society; weak group, weak grid gives an individualist society, and strong group, weak grid gives an egalitarian society. Dake and Thompson (1998) find from a study of households in northwest England that a) that cultural attitudes can be characterised effectively at the household level using the CT framework and b) households' CT types are correlated with their consumption patterns and lifestyles. Thompson's work in Nepal suggests that the framework is valid across wide differences of economic circumstance and social tradition. Dake and Thompson (1999) identify five distinct cultures of consumption which can be summarised as follows:
Each of these cultural types or “solidarities” (as Dake and Thompson call them) has the potential to be concerned about, and take action for, environmental and social issues, but it has its own narrative about human nature, the environment, and appropriate solutions for sustainability (Thompson and Rayner, 1998). The mainstream discourse of consumerism and sustainability corresponds best to individualist culture. A study of British consumers by MORI (Hines and Ames, 2000) also found five clusters, based on attitudes and approaches to ethical consumption. The clusters do not correspond exactly to Dake and Thompson's categories but there are some interesting overlaps, with the largest groups corresponding roughly to “traditional”, “cosmopolitan” and “fatalist” consumers, and a small group (5% of the sample) which Hines and Ames called “Global Watchdogs” corresponding roughly to Dake and Thompson's “natural” consumers. All of the groups except for the one that appears closest to the “fatalist” solidarity shared a concern about environmental and social issues, but they had different ways of acting, or not acting, on their concern. Only the Global Watchdogs were prepared to make significant lifestyle choices based on ethical concerns. 4.4 Social and cultural change in consumption scenariosWhereas Thompson et al avoid expressing a preference for any of the types, and suggest that a healthy society has a mixture of types, other studies suggest that societies pass through a succession of different cultural forms, which may be healthy at different times. Beck and Cowan (1996) develop a theory of social and organisational change based on a more complex cultural typology, within which CT types would represent a limited range of worldviews and modes of behaviour. The typology is illustrated in Table 1. Each mode of culture and consciousness in this system combines a view of human nature, a worldview, a sense of the purpose of life, and a set of core values. It may be expressed in personal and communal narratives, in social structures, and in individual and collective behaviour. The modes emerge in succession, alternating between individualist differentiation and collective integration, liberty and belongingness. The development of consciousness is a dialectic process leading to increasing complexity, in which each phase reacts against and builds on the mental structures of the previous stage. In healthy development, each stage incorporates the functions of the earlier phases in a new synthesis. A similar approach is adopted in various theories of personality type, which view healthy development as the incorporation of additional attributes and functions. As we develop, we gain greater flexibility, maintaining the capabilities, conceptual frameworks and emotional patterns of earlier phases, although we also sometimes become trapped in the needs or limitations of those phases. Hence Beck and Cowan's phrase, “spiral development”, to emphasise that developmental progress is not simple and linear nor firmly bound to particular ages or sequences. At each step a particular mode or complex of worldviews, attitudes, values and goals is expressed (Beck and Cowan use their own language for these complexes but here they are referred to simply as “modes”; we have also adopted our own labels for the modes, which Beck and Cowan refer to by colours; see Table 4.1). Table 4.1. Psycho-social modes (based on Beck and Cowan, 1996)
There is an obvious correspondence with the CT individualist, hierarchist and egalitarian types; fatalists could correspond to the kin-attachment mode; and some hermits might correspond to the holistic mode. As in CT, at the heart of each of these psycho-social modes is a set of understandings or narratives about the world, human nature, preferred social forms, and the meaning of life. In this framework, the dominant modes in the politics of industrialised countries are the hierarchic, strategic and pluralistic; however, many groups in society function in the kin-attachment and heroic power modes. Beck and Cowan emphasise that it is normal and healthy for individuals and groups to function in several of these modes, depending on circumstances. Beck and Cowan's modes correspond roughly, but not exactly, to stages of development identified by others (e.g. Torbert et al., 1991; Wilber, 1981; 1996). There is also some association with Maslow's hierarchy of needs and with Piaget's and Kohlberg's stages of cognitive and moral development. Questions about the future of consumption can be framed in this model. First, there might be a shift in behaviour within one of the modes (e.g. as a result of government policies suggested in the right hand column of Table 1, or because solar panels replace fast cars as the dominant fashion accessory symbols of individualists). Second, consumption behaviour can change by a shift in the prevalence people and organisations operating in different modes. For example, there might be a shift from individualism to egalitarianism, with a much higher value placed on environmental and social concerns). Third, new modes might emerge, with creative development of new behavioural forms. One possible pattern for a large-scale shift is:
An example might be mobile phones. Another possible pattern is:
Examples might include Forest Stewardship Council timber or fair trade foods. These processes have much in common with the dynamics of technological innovation, starting with a process of search and experimentation by a small group, with new behaviours then diffusing and being adapted by other groups, eventually to die out or be adopted by society at large. This innovation and diffusion process is fundamentally unpredictable, in much the same way that technological change is unpredictable. The behaviours that will dominate Europe in thirty years time may already be present now in cultural niches somewhere in the world, but we cannot tell which they are in advance. All that future studies can do is to identify candidate behaviours and narratives, and explore the implications if they were to spread or become dominant. Some of the major questions about the future of consumption relate to cultural tensions within Europe over a wide range of issues. They include broad social and political challenges:
They also include issues related more specifically to consumption and the environment:
5 Consumption outlooksChapters 3 and 4 open up a series of questions about the future, which stem from different interpretations of current trends and the historical forces shaping consumption and technology. Some of the most important are:
This chapter explores these questions and their implications for consumption and the environment. It draws first on a number of economics-derived reference or business-as-usual outlooks for particular sectors, briefly reviewing their implications for the environment. It then explores some alternative possible futures, drawing on three storylines following themes from existing scenarios in the literature. 5.1 Economic projectionsChapter 2 identified food, transport and housing/residential energy use as the most environmentally significant consumption clusters. In addressing consumption outlooks, this section therefore focuses mainly on the energy and transport outlook developed by the European Commission (TREN, 2003), and on existing food and agriculture projections (IFPRI, 2001). We also draw on narrower sector outlooks, such as those for aviation in Europe developed by the International Civil Aviation Organisation (ICAO, 2003) and Eurocontrol (ICAO, 2002). Each of the outlooks makes its own assumptions about, or calculations of, population growth, GDP, commodity prices and other economic factors that influence consumption. 5.1.1 Demographic and Economic OutlookThe various outlooks reviewed here make their own assumptions about income and population growth. While some of them discuss issues such as migration and ageing as factors that help to shape consumption, their projections, e.g. of car use, are mostly based on assumptions about future income and price elasticities of car ownership and travel, combined with either assumptions or modelling results on future per capita income and travel costs. Detailed effects of different scenarios of demographic and economic change can only be captured by the modellers making assumptions about the implications for changes in the variables in their models. The TREN outlook contains the most detailed economic and demographic projections of relevance to this report and the other outlooks do not provide sufficient detail – e.g. on household sizes – for meaningful comparisons to be made. The TREN outlook for the EU15 countries is developed using PRIMES, an energy system model including modules to represent energy technology and markets in different sectors in great detail (Capros, undated). It uses exogenous assumptions about macroeconomic and demographic variables to develop detailed calculations of energy and transport technology stocks, their levels of use, energy consumption and environmental impacts. Accession Countries are modelled in the less detailed ACE model. In the TREN outlook, population growth in the EU15 region follows the EUROSTAT base case projection and is assumed to slow between 2000 and 2020, leading to a slight fall between 2020 and 2030 to end up only 2.7% higher than in 2000. Household sizes continue to shrink rapidly; by 2030 the average household has only two occupants, down from 2.4 in 2000. This implies a 25% growth in the number of households with major implications for the amount of household energy consumed, and the number of vehicles and household appliances required. Factors contributing to the fall in household size include the ongoing ageing of the population, increasing rates of divorce, and shifts in lifestyle, all following the trends of the last 30 years. In particular there is a growing number of single people, elderly people living alone, and of one-parent families. The rate of change in household size varies considerably from country to country, with the most rapid reductions in Italy, Ireland and the United Kingdom, and the slowest in Greece. Figure 5.1. GDP per capita, TREN outlook
Manzos et al, 2003. Economic growth assumptions in this outlook are developed from a number of existing projections, in particular those of the European Commission, DG Economic and Financial Affairs. Detailed qualitative assessments were made on a country-by-country and sector-by-sector basis. The projections assume gradual convergence of the EU economies with rising per capita income. The overall rate of per capita economic growth is higher during 2000-2010 than that seen in the 1990s, but it declines gradually in subsequent decades. Growth rates are higher in the Accession Countries than in the EU15. Consumption expenditure remains roughly constant as a share of GDP, at about 58%. In the TREN outlook, the relocation of industries away from developed countries contributes to the dematerialisation of the European economy. Industry accounts for a declining share of GDP, with continuing growth in services, although this trend is slower than in the past. Manufacturing is based on increasingly high-quality materials so that smaller quantities can be used – for example with a trend towards lightweight cars. It is also focused on high value-added sectors such as pharmaceuticals and ICT. In contrast to historical volatility, especially in the oil market, international energy markets are assumed to remain well-supplied to 2030, with continuing new oil and gas discoveries and advances in extraction technology. Oil prices fall from a 2000 level of $28/bbl to around $20/bbl, and then rise gradually through the period to reach $28/bbl again by 2030. As a result, there is little prospect for a substantial introduction of alternative energy sources. The outlook assumes no new policies to address climate change or meet Kyoto commitments. EU15 emissions of CO2 from energy use are 4% higher in 2010 than in 1990. In 2030, emissions are 19% above 1990 levels. To 2010, the emission increase is driven mostly by growth in the transport sector. From 2010 to 2030, the increase results from growth in electricity demand, especially for households and the tertiary sector (government and commercial services). 5.1.2 Personal travelLong-term outlooks for the transport sector in Europe have been developed by several organisations. This report draws mainly on the TREN outlook (Mantzos et al, 2003), the IEA transport outlook (IEA, 2002), and the POSSUM scenarios (Banister, 1998). The IEA (2002) estimates that cars and personal light trucks account for 77% of energy demand for travel in OECD Europe. Air travel accounts for a further 15%. Hence cars and aircraft together make up 92% of energy use associated with travel and these two modes will be the focus of this section. Although this study concentrates on personal travel, both outlooks address the transport sector overall. In the TREN outlook, road freight overtakes cars as the main energy user by about 2020, but in the IEA outlook cars and light trucks remain the dominant energy user. Figure 5.2. Comparison of projected energy use for travel, IEA and TREN
IEA, 2002; Manzos et al, 2003. 5.1.2.1 IEA, 2002; Manzos et al, 2003Car travel and energy use Figure 5.3. Projected per capita car travel, TREN
Manzos et al, 2003 The IEA transport outlook similarly anticipates a slowing of growth in car traffic in OECD Europe, but also sees slower fuel economy improvements – indeed, it sees the energy intensity of cars and personal light trucks increasing during the next 20 years. IEA also sees slower growth in bus and rail use than the TREN outlook. The two studies address geographic regions with slightly different boundaries, but this is unlikely to explain major differences in results. The OECD Europe region modelled in the IEA outlook includes the EU15 and the larger Accession Countries (Poland, Hungary, Czech Republic). The IEA study appears to take greater care in addressing the gap between new vehicle fuel economy based on official tests, and actual on-road fuel economy. It anticipates that the gap will grow due to increasing use of air conditioning and other equipment in cars, following recent trends. Figure 5.4. TREN projections of EU25 car travel and energy use, 1990=100.
Manzos et al., 2003 The POSSUM reference case sees car use increasing by 50% (1.6% per year) between 1995 and 2020. Energy intensity falls by 30-40% (1.4% to 2% per year). The outcome is a change in European car energy use and CO2 emissions between -10% and +5%. Meanwhile, NOx emissions from cars fall by 85-90% over the period. 5.1.2.2 Air travel Table 5.1. Air travel projections, European routes, billion passenger-km
Following the rapid historical energy intensity improvements in the aviation sector (Michaelis, 1997), the 1990s only saw a reduction of 1.3% per year (Manzos et al, 2003). Projected rates in the future are in the region of 2% per year, implying an increase in aviation energy use by about 2.5% per year and leading to a near doubling by 2020. Air transport increases its share of transport energy use from 15% in 1997 to 20% in 2020. 5.1.2.3 Environment and energy implications Even in the TREN outlook, with its optimistic assumptions about energy efficiency improvements, transport accounts for a growing share of overall energy use over the next 30 years. EU25 transport sector (including freight) CO2 emissions increase 30% from 971 Mt in 2000 to 1261 Mt in 2030. The transport share of overall CO2 emissions from fossil fuel burning increases from 26% in 2000 to 29% in 2030. In the IEA outlook, transport becomes much more significant as a contributor to climate change. In OECD Europe, passenger transport CO2 emissions increase by 52% in a 23 year period, from 607 Mt in 1997 to 922 Mt in 2020. Freight transport emissions grow more rapidly, from 427 Mt in 1997 to 751 Mt in 2020. The aviation share of CO2 emissions from passenger travel increases from 15% in 1997 to 19% in 2020. In both outlooks, traffic and its impacts (noise, congestion, general deterioration of urban and rural quality of life) can be expected to continue to grow rapidly. However, emissions of local pollutants, in particular NOx, could fall by a factor of about ten (Banister, 1998). 5.1.3 Residential Energy UseDuring the 1990s, household energy use in the EU15 increased by 7% to account for 26% of total EU energy consumption. During the same period, the Accession Countries' residential energy consumption fell 12% as a result of economic restructuring. Manzos et al (2003) project growing household energy use in both regions over the next 30 years, to end up 20% higher in 2030. Figure 5.5. Residential final energy consumption, TREN
Manzos et al, 2003 Over the outlook period, the residential sector has slowly increasing direct fuel use, with a continuing shift from coal and oil to gas. Electricity use continues to increase relatively rapidly. Within the household, there is a shift to cleaner and more convenient energy forms. Indeed, even including power generation, energy use is becoming cleaner with the general shift to gas. However, including emissions from power generation and district heat, the residential sector currently accounts for about a quarter of overall energy-related emissions of CO2. Its share remains fairly steady over the outlook period and absolute levels increase by 16% between 2000 and 2030, in contrast with a 9% decline during the 1990s. Electricity accounts for a growing proportion of residential CO2 emissions. 5.1.4 Changes in electricity useFigure 5.6. Residential energy-related CO2 emissions, including power generation, TREN
Manzos et al, 2003 One very detailed study has been carried out including a European outlook for residential electricity and gas use in lighting, water heating and appliances (Fawcett et al, 1990). They take 1998 as their base year. EU15 residential final energy consumption amounted to 2878 TWh in that year, of which 613 TWh was electricity. Lights, appliances and water heating accounted for approximately 520 TWh (Fawcett et al, 2000), the remainder being for heating. They estimate the breakdown as shown in Table 5.3. Table 5.2 Breakdown of Household Electricity Consumption for Lights, Appliances and Water Heating, EU15, 1998, TWh
There are no Europe-wide projections available of the evolution of this breakdown over the next 30 years, but Fawcett et al develop an outlook for Britain, the Netherlands and Portugal, focusing on consumer electronics and home appliances. Current trends in appliance ownership are expected to continue, with a major increase in electronic equipment, in particular associated with the introduction of digital television. Table 5.3. Ownership of energy-using equipment in 1998 and 2020. % of households
Trends in appliance use are expected to include an increase in TV watching, but a decline in the use of cooking equipment and dishwashers as more food is eaten out of the home. Shrinking household size is a major influence on energy consumption. Hence the reduction in household size in the TREN outlook could be expected to contribute to growing household energy use. On the other hand, appliances are expected to become significantly more energy efficient over the next 20 years. Table 5.4. Projected Improvements in Appliance Energy Efficiency, 2020 (Fawcett et al, 2000)
The overall effect of trends in household size, appliance ownership, appliance use and energy efficiency is that electricity use is expected to continue to rise in the UK, Netherlands and Portugal. Declining energy use for cooking and refrigeration is offset by increasing standards of lighting, consumption of hot water, and use of consumer electronics. However, the growth in electricity use is expected to slow from 2010 to 2020. Table 5.5. Household Electricity Use for Lighting, Appliances and Water Heating, 1990-2020 (Fawcett et al, 2000)
5.1.5 Food consumptionWhile industry and retail analysts regularly produce short-term outlooks for food consumption in Europe, there are very few long-term outlooks publicly available. Those that exist focus mainly on demand for agricultural products rather than diets and the social and cultural patterns surrounding household food consumption. Figure 5.7. Meat demand in Europe
IFPRI, 1991 The OECD Environmental Outlook sees a decline in the share of food and beverages in household expenditure between 1995 and 2020. Most spending categories (energy, services, motor vehicles and dwellings) grow by roughly 150% in central and eastern Europe and 60% in western Europe. Food and beverages expenditure increases by only 70% in central and eastern Europe and less than 10% in western Europe (OECD, 2001). Figure 5.8. Agricultural commodities supplied in Europe, IFPRI.
IFPRI, 1991 The International Food Policy Research Institute (IFPRI, 2001) develops an outlook for agricultural commodities demand in major world regions to 2020. It projects a continuation of recent trends in the EU15. Food consumption continues to grow slowly. Meat consumption, which has stagnated in recent years, grows by 0.66% per year. The composition of meat consumption continues to shift from red meat to poultry, although pork consumption also increases. The historical increase in vegetable oil consumption is also expected to continue IFPRI does not give separate estimates of food cereal demand in Europe, but sees per capita cereal consumption in the “developed world” growing from 131 to 134 kg/year. As cereal yields continue to grow faster than demand, albeit slower than in the last 30 years, they see an increasing proportion of cereals being used for feed, and an increasing proportion of developed world cereal production being exported. Table 5.6. Cereals consumed as food, developed world, kg/capita (IFPRI, 2001)
Note: European cereal consumption in 2001 averaged 133kg/capita. 5.1.5.1 Environmental implications The European Fertilizer Manufacturers' Association (EFMA, 2004) projects a shift in EU15 crop production, away from coarse grains towards wheat. It expects fertiliser use to continue its recent decline over the next ten years, both as a result of reduced areas of land in production and as a result of efficiency improvements. The decline is expected to be largest in the use of potassium and phosphate fertilisers, and smaller in the use of nitrogen fertilisers, with increasing nitrogen application for wheat production. The continuation of recent trends in both the OECD outlook and IFPRI suggests that food consumption out of the home will continue to grow rapidly. This trend offers opportunities for environmental policy and action – it may be easier for restaurants to adopt sustainable energy and waste practices than for homes. On the other hand, it may be associated with increased car use, and declining consumer awareness of the sources of foods, and of the environmental and social implications of their consumption choices. 5.1.6 Implications for consumption and the environmentThe studies reviewed above are essentially projections in which historical trends are continued with moderate variations – e.g. in the rate of economic growth and technological change, in the price and income elasticity of food, transport and energy demand, and in price trends. They contain no surprises or sudden changes in direction. The outlooks offer no hint at possible sources of the “factor-of-ten” reductions in resource use per unit of economic activity that have been advocated by some environmental experts in industrialised countries. Despite very slow growth in European population, household numbers are expected to continue to grow, maintaining demand for new construction as well as household furnishings and appliances. Energy use in the transport and residential sectors is also set to grow, with a continuing increase in GHG emissions. One area where environmental impacts could fall is agriculture, but any reductions are projected to be very slow, and the impacts of the rest of the food chain (not considered in these outlook studies) are likely to continue to grow with the shift towards convenience foods and eating away from home. Where comparable projections have been identified, in particular for the transport sector, the studies reviewed reveal considerable uncertainty, especially in the rate of technology improvement. The IEA and TREN outlooks have quite similar projections of car and air travel growth, but the IEA outlook anticipates growth in GHG emissions from cars at three times the rate in the TREN outlook (1.4%/year compared with 0.4%). The growth rate for air travel is nearly double the rate in the TREN outlook (2.8%/year compared with 1.7%). The outlooks reviewed here assume no new policies to address, for example, European countries' commitments in the Kyoto Protocol. Many of them include sensitivity studies, exploring the implications of higher or lower GDP growth, or different price or technology assumptions. However, they are able to explore the implications of alternative demographic, technological and economic developments only at an aggregated level, using the simplified representation that is possible within computer models. They do not address the questions identified at the beginning of this chapter about the social and cultural forces that underlie lifestyles and consumption. The cultural forces shaping society cannot yet be satisfactorily represented in computer models, and it may never be possible to do so. To gain greater insight into the role of these forces, it is necessary to turn to scenario analysis. 5.2 Alternative scenariosEnergy industry and many government energy analysts adopted scenario analysis in the 1980s to explore possible sources of future departures from recent market trends. Since then, scenarios have been used in a variety of contexts, including business planning, government technology foresight exercises, and in the exploration of strategies for sustainable development. Environmental scenarios in the literature explore a variety of themes – shifts in government policy, public values, the geopolitical context, or other forces that could be part of different futures. These themes are captured in the scenario storylines – qualitative descriptions, which are sometimes used to explain assumptions behind quantitative scenario indicators. Table 5.7 identifies a few scenarios from the literature, summarising their main features and approaches to consumption. Table 5.7. Environmental Scenarios from the Literature
Some of the most widely developed scenario themes are:
Most existing environmental scenarios appear to start from assumptions about technological and economic change. Alternative scenarios may explore rapid or slow economic growth and technological change. They may explicitly address more complex questions about the current state of the economy. Are we in the downturn of an economic “long wave” or does new technology promise the beginning of a new upsurge? Are we approaching a post-consumer phase of economic development? Will environmental pressures and regulation lead to a reduction in economic growth, or will they stimulate more innovation and accelerate growth? However, scenario assumptions about technological and economic change also have to be grounded in an underlying set of assumptions or storylines about human motivation and its cultural and institutional context. Are human wants insatiable? Are people inherently competitive and self-interested? The following sections briefly consider major questions about technology and culture. 5.2.1 Technology in consumption scenariosTechnology plays a central role in the sustainability of consumption. There have been numerous business and government foresight exercises to search for sustainable technologies (see, for example, OECD, 1999). Key technology areas relating to the consumption of food, transport and housing include:
Some of the most widely mentioned technologies include GM organisms; photovoltaic solar power; fuel cells running on hydrogen; and lightweight cars (Stokes, 1999). Scenarios often feature the various promising technologies as solutions to environmental problems. However, technological development is fundamentally uncertain and the future performance and deployment of these technologies cannot be predicted. This report does not attempt to review technology studies or to “pick winners” among technologies. Rather, it looks at the way technology can be incorporated into consumption scenarios, seeking to identify links between technology preferences and the social and cultural framework. 5.2.2 Culture in consumption scenariosThis chapter will mainly use cultural theory (CT: introduced in Chapter 4) as a conceptual framework for distinguishing scenario storylines, and to explore links to cultures of consumption and lifestyle. Figure 5.9 maps out some of the scenario themes mentioned above on the CT axes of group versus grid. Whereas scenarios often depict a world in which one cultural type dominates, the real world contains a mixture of types, as shown by Dake and Thompson's work. Strong governance may reflect a hierarchical cultural bias, but it may also emerge from an egalitarian democratic process. Globalisation may reflect the hierarchical power of big business, or the libertarian individualism of free markets and international networks. A hierarchical government or business culture may actually require a fatalist culture on the part of voters, soldiers or workers (Thompson et al, 1990). Individualism and the market needs a regulatory (hierarchical) framework in which to operate. Nevertheless, scenarios are usually designed to follow through a particular institutional logic or theme, and such themes can usually be interpreted using the CT framework. The VISIONS scenarios offer some description of specific changes in consumption patterns and contextual factors. They address especially travel and energy use; technological shifts and developments; changes in market structures and other institutions; developments in social structure, inclusion and exclusion; and changes in public values and concerns. Table 5.8 below identifies the CT logic of the scenarios, and summarises their key consumption-relevant features. It can be seen here that some of the questions identified at the beginning of this chapter, relating to demography, technology, economy, social structures and culture, could have a tremendous influence on consumption patterns and their environmental impacts. However, the VISIONS scenarios do not begin to quantify consumption or its environmental impacts, apart from indicating levels of renewable energy use towards the end of the scenario periods. Only one of the scenarios, Convulsive Change, entails a significant shift towards more sustainable patterns of production and consumption. In this scenario, the change is the result of increasing evidence of the need to respond to climate change and other environmental challenges, early in the scenario period. Table 5.8. Consumption patterns in the VISIONS scenarios
5.2.3 Potential for a shift towards sustainable consumptionThe Annex to this report provides three scenario storylines which describe possible transition towards more sustainable patterns of consumption and production. The storylines were prepared as desk studies, inspired largely by the VISIONS scenarios and strongly informed by the individualist, hierarchist and egalitarian value systems from CT. Whereas Thompson et al see these three value systems as fundamental and invariant in the healthy functioning of any society, Beck and Cowan (1996) suggest that they are part of a progression of human civilisation and culture, with hierarchy, individualism and pluralism as successive stages within a longer chain. The tone of the storylines draws partly on their thinking in viewing Individualist Europe as a continuation of 1990s individualism, Traditional Europe as a reversion to earlier hierarchic values, and Egalitarian Europe as a progression, with the development of value systems that are currently emerging. The storylines can be summarised as follows:
In the VISIONS scenarios, only Convulsive Change, which is the scenario most consistent with egalitarian values, shows signs of a major transition towards sustainable consumption and production. In contrast, all three of these new storylines are potentially consistent with a radical reduction in European CO2 emissions:
Some of the outcomes for consumption patterns in food, homes, home energy and transport are summarised in Table 5.11. Table 5.11. Food, homes, energy and transport in the scenarios
5.3 Implications for sustainable consumption strategiesThe storylines discussed above are thought experiments that help to show how governments, business and civic society all have roles to play in any transition towards more sustainable consumption patterns. The nature of their respective roles and responsibilities depends on the scenario but in the real world all are likely to be needed, since the future across Europe is likely to include a mixture of all of the storylines, along with others not considered here. At present, policy analysts mostly recommend strategies consistent with the individualist storyline – working with the market to encourage the development of new technology that will allow consumption growth to become sustainable. However, these strategies may not work on their own in a world where the reality includes a strong dose of the hierarchic or traditionalist storyline – regulations and clear priorities may be needed to provide direction in making consumption more sustainable. And there may be more effective strategies for working with communities and networks that are closer to the egalitarian storyline – essentially by making it easier for them to take their own initiatives, and encouraging others to follow their example. Effective government strategies for sustainable consumption are likely to include price incentives, awareness raising and voluntary agreements with industry. But these are unlikely to be sufficient (Jackson and Michaelis, 2003). Sustained global reductions in resource use would require levels of price incentives that are currently politically unimaginable, although they might arise, as in these storylines, as a result of political instability or resource exhaustion. And the economic theory that advocates such measures as the most efficient way of achieving sustainability ignores the many other ways in which governments can engage in the processes that shape consumption. Jackson and Michaelis (2003) offer six key messages for governments developing sustainable consumption strategies:
The outlooks and scenarios reviewed in this chapter show how the future might turn out if governments do not develop effective sustainability strategies in the near term. One way or another, it is quite possible that radical changes would be forced on European citizens, whether by rapid climate change, exhaustion of oil reserves, or geopolitical tensions. The development of a strategic policy approach is beyond the scope of this study. Rather, this is something that governments need to do in close consultation with a range of different stakeholders. 6 ConclusionsConsumption patterns have received increasing attention in international discussions of sustainable development. But despite government commitments at the Johannesburg Summit to develop a framework of programmes for sustainable consumption and production, the debate over the basic principles of sustainable consumption remains unresolved. It is clear that, in industrialised countries and especially in Europe, household consumption accounts for a growing share of resource use and environmental burden, as supply chains become cleaner and more efficient. Studies based on input-output modelling, life-cycle analysis and other approaches track the majority of resource use and environmental damage back to three areas of household consumption: food, transport and housing (including home energy). Within these three areas, the largest impacts are associated with the consumption of animal products, car use, and home electricity use. In recent years, consumption in all of these areas has risen, in some cases quite rapidly. Many Europeans over-consume food (inasmuch as they have become overweight or obese), yet consumption levels are continuing to rise, with a 5% increase in calorie intake during the 1990s. Although consumption of animal products is increasing, the fastest growth is in consumption of vegetable oils, nuts and oilseeds, and fish. Consumption of potatoes and animal fats is declining. There is a trend toward increasing consumption of prepared food and eating out, with a corresponding decline in home cooking. Overall, environmental impacts of European agriculture such as overall land use, greenhouse gas emissions and fertiliser run-off are fairly steady. Other major impacts in the food supply chain include those of food manufacturing, freight transport, household shopping trips, cooking and waste disposal, as well as the environmental impacts of restaurants and other food service providers. Among these, the main areas of growth are in transport and services, which are using increasing amounts of energy as well as using land for roads and car parking. Personal travel is continuing to rise and although cars are being made with more efficient technology, the energy use per kilometre driven is fairly steady, because of a trend to larger vehicles, increasing use of energy-using accessories, and more energy-intensive driving styles. Despite the downturn in air travel from 2001, aviation is still the strongest area of transport growth and, with the greenhouse impacts of emissions of NOx and water vapour at high altitude in addition to CO2 from fuel use, seems set to become one of the most important sources of greenhouse gas emissions in the future. The introduction of catalytic converters and lead-free gasoline has helped to reduce urban air pollution by cars. However, land use and habitat destruction for roads are continuing, with most of the emphasis on new motorways, often affecting relatively unspoilt rural areas. The amenity impact of personal travel is also worsening, including traffic noise and the visual dominance of cars in urban and, increasingly, rural areas. There is growing demand for home furnishings, appliances and home energy per person. Of particular environmental significance is the growing residential demand for electricity. Although kitchen appliances are becoming more efficient, new areas of electricity use keep emerging and growing, with home electronic equipment consuming a growing share of electricity. Despite rising energy use – and especially electricity consumption – CO2 emissions from home energy use have fallen in recent years, mainly because of fuel switching. Households are consuming less coal and oil, and more gas and electricity. Meanwhile, electricity generators are shifting away from coal and oil to gas and nuclear power, with rapid growth in renewables from a low level. The demographic, economic and technological forces behind consumption growth are relatively well-understood. Although the European population is growing very slowly (about 0.3% per year), household numbers are rising quite rapidly as more people live alone, as couples or in smaller families. Immigration and more general mobility are also contributing to the development of more cosmopolitan consumption patterns. The ageing of the European population can also be expected to affect consumption, partly as a result of a shift in the way people save and consume over their lifetime. Economic forces promoting consumption have included the rising supply and falling cost of goods and services, as producers compete to maintain or increase market share. In some countries workers are experiencing increasing pressure to compete in the job market, by working longer hours and demonstrating a steady salary progression. This means that they have more money but less free time, so that consumption is stimulated by the need for convenience. Another major engine of the consumer boom has been the growth in consumer borrowing. This takes different forms in different countries, but includes consumer credit, mortgages and bank loans. Technology is the main hope of most policy-makers for moving towards sustainable consumption. But technological change has mostly contributed to increasing levels of consumption and resource use. The factor-of-four to –ten resource productivity improvements advocated by some environmental experts over the next 30-50 years would require a dramatic change in technology trends, with very significant shifts in the economic, social and other forces that shape technological innovation and markets. The social and cultural aspects of consumption have been extensively researched but are poorly addressed in most environmental policy analysis. Governments tend to follow the assumption of mainstream economics that consumption patterns reveal personal preferences, and so consuming more of the same will increase consumers' personal utility. Hence, economic growth is one of the highest priorities for governments. Social and psychological research shows that happiness or satisfaction is not increased by material consumption above a certain level (corresponding to an income in the region of €8000 per person per year). Consumption then contributes to quality of life mainly through its role in social interaction. Policy instruments tend to focus on information and incentives for people as individuals, whereas a large part of the determination of consumption occurs in groups, families or communities. Important social forces include the role of consumption in establishing belongingness and status within a group – promoting on the one hand conformity and on the other competitive differentiation. Collective choices also give rise to “lock-in” of consumption patterns – for example it is becoming increasingly difficult to function in some European cities without a car as the infrastructure and services are all designed for car users. Consumption also plays a role in personal identity formation and in symbolic communication. The advertising industry makes particular use of this symbolic function. It is perhaps discourse and narrative that is of most interest in the context of sustainable consumption. Governments do play a role in shaping collective narratives or stories about values, goals, and the nature of the Good Life. In recent years, they have fallen in with the mainstream narrative, which sees people as autonomous, rational individuals whose highest potential is to be achieved through their work and demonstrated through rising levels of wealth and consumption. Society is understood as nothing more than a collection of individuals, whose collective purpose is to enable individual members to meet their needs. The natural world is mostly understood as a resource base for meeting human needs. Cultural theory identifies this mainstream narrative as “individualist”. However, there are competing narratives present in European society. In particular, “hierarchists” advocate a strengthening of social responsibility and law and order, reviving traditional values. “Egalitarians” advocate a strengthening of community, direct democracy and shared values, with an emphasis on social and environmental concerns. The future of consumption in Europe depends, then, on the outcomes for a range of different forces and trends in society. These include demography, technology and innovation, economic development, social structure and cultural values. This report reviews a number of business-as-usual or reference outlooks, focusing on particular areas of consumption and the associated supply chains. These outlooks pay particular attention to assumptions about population, technological efficiency, income growth and commodity prices. They are mostly based on economic models. The outlooks essentially point to a continuation of past trends, with rising levels of consumption of food, transport and housing. Resource use and greenhouse gas emissions, especially linked to transport and housing, are expected to increase over the next 20-30 years, with only moderate improvements in energy efficiency and very small shifts to renewable energy. The report also reviews alternative scenarios including three storylines included in the Annex. These scenarios reflect the possible implications of playing out different value systems in Europe. All three of the annexed storylines are potentially consistent with reducing environmental impacts of consumption, with a particular focus on CO2 emissions.
In two of the scenarios, Traditional Europe and Pluralistic Europe, the emission reductions are partly the consequence of disastrous circumstances. Nevertheless, all of the scenarios contain elements that would be abhorrent to some people, and aspects that others might find highly attractive. They suggest that the grey clouds in the disaster scenarios might have silver linings. Fortunately, it is highly unlikely that any of these scenarios will come about, but the future may contain elements of all three. They point to the potential for a range of social and economic actors to play a role in bringing about more sustainable consumption patterns, including government, the business community and civil society. They also suggest that both technological and social innovation will be required. At present, six years after Kyoto, there seems to be little sign of adequate GHG mitigation policies being introduced. In the transport sector, the most substantial hope for limiting energy use appears to be the car manufacturers' voluntary agreement limiting vehicle CO2 emissions per km, but the IEA projections cast some doubt on the effectiveness of that measure, especially in the light of rapidly growing car travel. Even the most stringent conventional policy measures currently under discussion are unlikely to achieve the scale or pace of consumption change needed to move towards a sustainable society. In addition, they tend to underestimate the complexity of underlying motivations, and ignore the diversity of ways in which government can engage in the processes that shape consumption. A new mindset is needed in policy development for sustainable consumption. The most important aspects of this new mindset are likely to be:
Government has a vital role to play in shaping the institutional, social, cultural and ethical context within which individual consumer behaviour is negotiated. But to play this role it must go beyond the rigidity of “control” and “persuasion”, to view government and public as collaborators and learning partners in the process of change. 7 Annex: Three Alternative Consumption ScenariosKey Features of Individualist Europe Central values: individualism, materialism, competition, efficiency Sustainability challenge: environmental impacts of excess consumption due to competitive materialism The following three sections describe alternative developments in the social, cultural, economic and technological factors shaping consumption, and the environmental implications. These “storylines” have been developed drawing on ideas in the VISIONS scenarios (Rotmans et al, 2001), the IPCC Special Report on Emissions Scenarios (Nakicenovic and Swart, 2000) and also on insights from Thompson et al (1990) and Beck and Cowan (1996). The timeframe for the scenarios is very approximate, in the region of 2005 to 2030. 7.1 Individualist Europe [1]The global context in this scenario is a decline in international tensions, as the “war against terrorism” peters out. The main issues facing the international community are those surrounding globalisation, demographic transition and sustainable development. The solution that is established emphasises the free market, individual rights and freedoms, and technological innovation to meet consumer expectations within the Earth's ecological constraints. In the Rio+15 summit, industrialised country politicians finally commit themselves to achieving factor-of-ten improvements in resource efficiency and especially in the carbon intensity of the economy by 2050, taking 1990 as the baseline. The aim is to stabilise CO2 concentrations in the atmosphere at 550ppmv. This is a Europe that continues to play out the dream of the consumer society. Its values are essentially materialist, individualist, and competitive. Trade is increasingly free both within Europe and between Europe and other major regions. There is a continued migration out of Europe of jobs in heavy industry, and also of routine and repetitive jobs in the information industry. Mass-produced goods are mostly imported from low-wage economies, but there is a rapid development in technology producing custom goods in low volumes. The European economy is increasingly based on specialised, knowledge-rich, customer-focused services. Considerable resources are devoted to retraining workers made redundant from industries in decline. But even so, the market for highly educated workers is expanding rapidly at a time when the European working age population is in decline. Immigration makes up the shortfall. Those who cannot compete for these jobs find work in more menial, low-paid service occupations, often with informal and insecure working conditions. The spread of Internet access, and the rapid development of new forms of service, organisation, and community based on it, have an impact on society comparable with the growth of car use and the TV in the 1960s. The EU15 states maintain an average economic growth rate of 3.5% per year for a couple of decades. By 2030 the average per capita GDP is €45,000. The acceding central and eastern European states catch up rapidly with the EU15, with an average growth rate of 7% over the same period, and reach average per capita GDP of €30,000 by 2030. This is the boom phase of an economic long wave and a time of rapid technological, economic and social change. In this scenario, government plays an important role ensuring that markets work efficiently, and that social and environmental concerns are addressed through effective market mechanisms. These include a range of charges, regulations and trading systems in “goods” and “bads”. 7.1.1.1 Early stages The rapid growth of new industries combined with the burgeoning service sector is creating jobs at all skill levels, so that Europe is finally returning to near-full employment. There is a decline in social tensions and crime. Household budgets continue to shift away from food, towards leisure, recreation and cultural activities. ICT also represents a rapid growth area in household spending. Food consumption patterns are shifting rapidly. Home cooking is in decline as convenience and take-away foods become cheaper, household budgets increase, and lifestyles become more hectic. In city-centres, eating styles are comparable with those in New York in the 1990s, with a proliferation of always-open delicatessens, salad bars and speciality restaurants. In rural areas, the norm is to have a monthly delivery of a wide range of frozen convenience foods. Cooking usually involves heating in a microwave oven. There is a rapid growth in health-promoting functional foods, responding to and fuelling consumer demand. Health-awareness is also contributing to continued growth in the consumption of fresh fruit and vegetables, farmed fish and poultry. Consumption of red meat, especially beef but also including pork, is falling. Personal travel continues to rise, with increasing passenger volumes on urban mass transit systems, rising interurban car use, and very rapid growth in air travel. Most of the growth is in leisure travel. Shopping trips continue to increase in frequency and length, following the 1990s trend, but the growth rate slows. There is no growth in travel to work, due to the increase in home working. The energy efficiency of cars continues to improve, nominally meeting the 140g/km CO2 target agreed by European manufacturers for 2008 and achieving a further 15% reduction by 2015. However, with an increasing gap between official new car test figures and the actual energy use, and with a growing trend towards four-wheel drive and other exotic vehicles, there is no overall improvement in the energy intensity of personal travel. Household size continues to fall, especially in urban areas. Larger households tend to live in cheaper rural locations. Children are ferried to school in towns. Populations are growing in urban areas throughout Europe, and there is a growing demand for well-designed new housing, leading to some renewal of the housing stock to replace the apartment blocks of the 1960s and 70s. The construction boom helps to stimulate the economy and is also contributing to energy conservation, with increasing use of low-cost, high thermal performance materials. As energy use by kitchen and washing appliances continues to fall, ICT begins to make a significant contribution to household electricity consumption. Technological improvements are devoted to performance increases rather than saving energy. In affluent households with numerous computers, network routers and other equipment always on, ICT equipment becomes the main user of electricity. Electricity consumption continues to grow in line with household income. GDP per Capita, Individualist Europe
Environmental implications. Energy and material use were relatively stable during the 1980s and 1990s. The economic boom, in particular the increase in construction and personal travel, leads to a sudden upturn in both. Efficiency improvements accelerate because of housing renewal, as well as rapid turnover of vehicles and personal appliances. But the economy is growing even faster. Technological improvements in the supply chain lead to factor-of-ten reductions in emissions of conventional pollutants over the decade. Renewable energy sources also begin to take off, contributing 10% of Europe's energy needs by 2015. Meanwhile, the almost complete shift from coal to highly-efficient combined cycle gas turbines in power generation mean that CO2 emissions continue the decline of the 1990s, and the European Union meets its modest obligations under the UN FCCC. 7.1.1.2 Further developments The cracks in the Individualist world are beginning to show. It is becoming apparent that the Factor 10 target will not be achieved. The CO2 intensity of the economy is improving at about 2% per year, slightly slower than economic growth, so that overall CO2 emissions are continuing to increase. Oil reserves are dwindling rapidly and prices rise from 2020, reaching $200/barrel by the end of the period. Synthetic fuels from renewable sources finally become competitive without government subsidies, but towards the end of the period supply is unable to keep pace with demand so that there are frequent shortages and fuel prices are extremely volatile. Gas reserves are also in decline, leading to a growing penetration of renewable electricity supplies. Social divisions are growing between the “connected” and the excluded populations who cannot afford the new technology, and struggle to survive with the reduction in social security provision and the rising commodity prices. Civic unrest is growing as communities excluded from the new technological age begin to organise themselves into effective protest movements. At the same time, climate change and its impacts are becoming more apparent. Governments and businesses are spending increasing amounts on adaptation, and on reparations after extreme weather events. Some areas of Europe are suffering population flight because of the changes. Food consumption continues along the trends of the previous decade. In cities, most food is prepared away from home in the form of restaurant meals or take-aways. With the growing rural population, most household receive monthly deliveries to stock up their freezers, but food deliveries also begin to be made by air. Food preparation in affluent homes is largely automated. Consumers have the option of buying prepared meals (computer chips in the reusable, reprogrammable smart packaging provide instructions to the smart cooker), or using increasingly sophisticated and diverse kitchen equipment to “make their own” bread, cakes, roast meat, steamed vegetables etc., using prepared ingredients. The technology provides perfect cooking every time. Advanced food storage technologies bring about the decline of the home freezer (ice cream and ice cubes are produced by specialised appliances on demand, rather than being kept frozen). Personal travel by road begins to level off, as more affluent consumers abandon their cars for air taxis or personal private flymobiles for intercity and rural travel. Personal flymobiles are fully automated. With intelligent, networked and automated guidance systems which negotiate routes to avoid collisions, congestion is not a problem. Cities begin to introduce rapid transit systems, in which passengers are conveyed in electrically powered personal vehicles. A wide variety of systems are tried, including rail-based, road-based and maglev. Where the systems are introduced, city authorities are able to impose a complete ban on parking so that car drivers are forced to abandon their cars. However, lower income households cannot afford the high costs of local air travel or the rapid transit systems. Cars remain important for local travel outside city centres. There is a rapid shift to electric or fuel cell cars. Homes are now fully automated. With rapidly rising fossil fuel prices, energy conservation is becoming a high priority. ICT becomes much more efficient, as innovation is devoted to energy saving more than performance improvement. Room temperature and lighting are intelligently controlled in response to the location of the occupants. New housing has extremely high thermal performance and the needs for heating and cooling are roughly equal, managed by electrically powered heat pumps transferring heat to and from the ground. Older housing is increasingly retrofitted with insulation but has a higher energy requirement for heating and cooling. Micro-CHP becomes widespread, with electricity and heat generated by in-house fuel cells. Environmental implications. Material use cycles have largely been closed, with high-tech systems for the return and reuse of packaging. Household waste systems are fully automated, carrying out composting and separating waste streams for collection and reuse or recycling. The shift to virtual reality shopping has, in any case, more or less eliminated packaging waste as delivery services are also required to collect the reusable packaging from food and other household consumables. The computer chips in the packaging include instructions for return, reuse or recycling. With the shift away from fossil fuels, air quality is continuing to improve. The major concern is the continuing increase in extreme weather events associated with climate change, and the almost continual drought experienced in southern Europe. Nevertheless, there is optimism that greenhouse gas emission are falling rapidly. New technologies are being developed to scrub CO2 and other GHGs from the atmosphere. Towards the end of the scenario period there is a period of recession, characterised by soaring prices for energy and food resulting partly from extreme weather events that disrupt both agriculture and renewable energy supplies. Many European economies are also flagging because of the large number of people who took early retirement in the years 1990-2010 without adequate private pensions, and who now have life expectancies in excess of 100. The recession weeds out some of the less efficient businesses still relying on old technology. Energy demand in Europe finally begins to fall as prices rise. Final energy use per unit of GDP declines by about 3% per year, but fossil fuel use falls at about 5% per year with a rapid shift to renewables. It is beginning to become imaginable that Europe could reduce CO2 emissions – but only if this rate of fuel switching is maintained. 7.2 Traditional Europe [2]Key Features of Traditional Europe Central values: security, order, power Sustainability challenge: social inequality and exclusion, slow technological change With an intensification of the “war against terrorism”, this is a “clash of civilisations” scenario (Huntington, 1996) in which major world regions consolidate into blocks based on cultural affinity, and communication and trade between the blocks declines. In response to the growing external security and economic threat, European governments show unprecedented unity in moving towards a strong federal constitution, with a unified tax system and currency. After 50 years of peace and growing individual freedom in western Europe, the war footing forces a retreat to more traditional values. Governments take control, imposing law and order, restricting the freedom of information, trade and international movements of people. As it becomes harder for individuals to assert their rights, power begins to become concentrated within “old boy networks”. Whereas in the Individualist scenario, what you know is important, in Traditional Europe what really matters is who you know. Within government and business, equal opportunities policies are maintained on paper, but in practice, job promotion and success is based increasingly on having the right contacts and background. Business also consolidates, with mergers and takeovers leading to a declining number of trans-European companies with strong government connections. With a resurgence of protectionism and the goal of sourcing commodities from within Europe, industries that had been shrinking, such as iron and steel and textiles, begin to grow. Economic growth in this scenario is slower than during the last couple of decades of the 20th century, in the region of 1.5% per year on average, but faster in the Accession States. As a result of immigration controls the European population continues to age and begins to decline. Technological innovation is focused on developing products for the mass market, and on achieving European self-reliance in energy and other commodities. The global environment is a low priority as the UN system collapses, taking international environmental treaties with it. 7.2.1.1 Early stages The 1990s privatisation trend continues, on the one hand providing one-off windfall gains for governments, and on the other reducing the fiscal burden of maintaining public services. The substantial reduction in taxation across Europe helps to make a move to federalisation more palatable. However, the former public sector companies maintain their natural monopolies in areas such as telecommunications, utilities, construction and road and rail maintenance. Consumption patterns in this scenario are roughly in line with the 1990s trends, with growth particularly in mass-produced products. There is sufficient competition between the major consumer products companies to achieve ongoing cost reductions, price regulation keeps utility prices down. Trade unions become more powerful in this scenario, and although wage increases are relatively slow, they succeed in negotiating a continued shortening of the working week. With declining public service provision, there is a growth in volunteer community involvement in the provision of care to the needy. In this scenario, ICT becomes an important instrument for government and business activities and influence. In homes it is a channel for the delivery of information and entertainment services, and there is a growth in Internet shopping and transactions, but this is less rapid than in Individualist Europe. As material production remains an important part of the European economy, the trend towards home-working is limited. Food consumption in this scenario sees a continuation of many 1990s trends, with increasing intake of manufactured products, especially take-away and snack foods based on cheap ingredients. Home cooking continues to decline with increasing use of frozen convenience foods. Consumer choices are shaped to a large extent by supermarket buying and marketing policies. The market for organic food dwindles, although there is a growing emphasis on low-input agriculture to keep costs down. Consumption of dairy and meat products, especially pork and chicken, grows. New, distinctly European, fast food concepts are developed. With the emphasis on European production, there is a decline in the consumption of out-of-season and exotic fruit and vegetables. Fresh fruit and vegetable consumption stagnates with the decline in home food preparation. Fish consumption also declines as Atlantic stocks collapse. Travel patterns follow historical trends with some shifts. In particular, long-haul air travel decreases significantly and there is an increase in holiday-making within Europe, contributing to a growth in short-haul flights and long-distance car use. Considerable effort is devoted to expanding the European high speed rail network with private financing and this begins to provide effective competition to air travel for flights of 500km or less, opening up landing slots for longer flights. Europe is increasingly suburbanised and car-dependent. However, with high fuel prices, the growth in car sizes is halted and there is only limited growth in car travel per capita, at about 1.5% per year. Total car energy use begins to decline. Housing replacement is slow. Although European population is falling, there is substantial migration from the poorer to the more affluent regions. Planning restrictions are relaxed around some thriving cities, leading to suburban sprawl, while others maintain tight controls and see rocketing property prices. The trend towards single person households is addressed mostly by subdividing existing properties. As prices of gas (imported from outside the EU) begin to rise towards the end of the period, there is growing concern to retrofit insulation to these properties. Household energy demand for heating is fairly steady. Electricity demand grows slowly with the spread of consumer electronic equipment, in particular digital TV (mostly from broadcast and broadband Internet). Environmental implications. High commodity prices, low economic growth, and the need to source materials from within Europe, result in a slight decline in overall material flows. GHG emissions also decline, continuing the trend of the 1990s. The adoption of cleaner technology is slower than in Individualist Europe, as environmental pressure groups are less influential vis-à-vis big business and government interests. The shift from coal to gas in power generation is halted as a result of growing concerns about energy security, and declining international pressure to reduce GHG emissions. But there is also a resumption of nuclear power plant construction. The car fleet becomes cleaner overall, as pre-catalytic converter vehicles are scrapped, but there are no significant new initiatives to reduce air emissions further. The environmental impacts of agriculture (nitrate runoff, pesticides, GHG emissions) also decline gradually as farmers seek to minimise the use of inputs whose cost has been increased because of the high energy prices. GDP per Capita, Traditional Europe
7.2.1.2 Further developments Technological innovation has all but disappeared, and any improvements in production processes are achieved through second-rate copying of new techniques from rapidly industrialising southeast Asia. Economic growth slows to a near standstill. Government and business abandon the pretence of liberal values such as equal opportunities and transparency. Cronyism becomes a dominant way of operating. Consumer information regulations are not enforced and companies find new, creative ways of selling substandard products without breaking the letter of the law. Income disparities within the population grow, as redistributive taxes are cut at both national and federal level. In particular, there is a growing class of long-term unemployed, and of people able to find work only in part time informal jobs. The ageing of the population is continuing, with fertility rates remaining well below replacement levels and tight controls on immigration. The dominant mode of funding retirement is now through private pension plans, but a number of fraud scandals have damaged public confidence in these. While the official retirement age has not been increased, a growing number of older people are returning to work, doing menial, low-paid jobs. Destitution is increasingly common among the elderly. Health care is a growing burden on some national governments and there is a new demand for a unified European system. When this emerges, it takes the form of an insurance-based, mass-provision model, with large parts of health care (hospital services etc.) provided by big business although doctors manage to maintain their status as independent professionals. Companies increasingly operate in multiple sectors – e.g. catering, building, cleaning or transport services for schools, hospitals and prisons. With declining competition, standards deteriorate. Some food consumption trends of the early stages continue, with increasing volumes of cheap snack, take-away and fast foods. But there is also declining consumption of fresh foods. Home food consumption is completely dominated by pre-packaged meals. Standards decline, as manufacturers find cheaper ways of making products using lower quality ingredients. Meat consumption falls as more water, cereal, and new synthetic products are used to bulk out processed foods. Transport patterns are divided between those who have secure positions in business and government, and low income households relying on meagre wages and benefits. Rail and air transport services cater mainly for the wealthy, but poor management leads to a series of accidents with large numbers of fatalities. This leads to a resurgence of growth in car use for longer distance travel. Low-income households are dependent on cars or on growing informal, low-cost bus networks. Oil remains the main fuel for road and air transport, but high fuel prices constrain most households' travel. There is a strong trend towards smaller, cheaper cars with relatively low fuel consumption. The housing stock is deteriorating due to a lack of investment and poor quality of repairs and replacement materials and equipment. With the rising price of gas, some households revert to using coal and wood as a heating fuel. Electricity supplies become less reliable, and there is growing use of home-generated renewable electricity, but declining use of TV and other consumer electronics as the quality of the entertainment available deteriorates. Environmental implications. There is a significant reduction in European GHG emissions as a result of economic decline. A growing proportion of agricultural land falls into disuse and reverts to forest. At the same time urban air quality deteriorates as old vehicles are kept on the roads and households burn more solid fuels. Packaging waste continues to grow, and is disposed of mainly through incineration, contributing further to urban air pollution. Towards the end of the period the unemployed and other discontented groups finally take to the streets, overwhelming the police and forcing the establishment to take notice. The EU begins to include NGOs in negotiations with big business and trades unions, leading to policy reforms. The result is a new growth of small enterprises and locally run transport services meeting people's real needs, and providing hope for the future. 7.3 Egalitarian Europe [3]Key Features of Egalitarian Europe Central values: equality, stakeholder involvement Sustainability challenge: lack of direction and focus The global context in the early years of this scenario is one of declining confidence in government as trans-national corporations and media increasingly seem to shape policy. The war on terrorism peters out, and Europe returns rapidly to prosperity and economic growth. By 2005, the media spotlight has turned back to issues that were abandoned in September 2001: globalisation and climate change. The latter is becoming increasingly evident, with regular droughts and forest fires in southern Europe, alternating with floods and storms with unprecedented winds. The IPCC Fourth Assessment, approved in 2005, finds that climate change is proceeding very rapidly, and raises its estimates of the warming impact. It also announces that sea level rises are beginning to be observed, at rates close to the upper confidence limit of the Third Assessment. Governments seem unable to act. They have become committed to stakeholder involvement and consultation, and cannot find a way of reconciling the many points of view expressed by business, NGOs and others. Other concerns return to the media spotlight. Food scares seem to be coming one-a-fortnight. There are major radioactive releases from ageing nuclear power stations. New concerns emerge about fly-by-wire aircraft, and about European air traffic control, after a series of mid-air-collisions between large passenger aircraft. At the same time, sporadic terrorist attacks are continuing throughout the rich world. The insurance industry is in crisis and many risks in Europe are becoming effectively uninsurable. In this context, civil society begins to get organised. It is clear that government cannot provide adequate regulation in an age of global sourcing and technological complexity. The conventional police and military establishments are unable to provide security. People are looking for something new. Informal networks of local groups, established as part of the anti-globalisation/anti-consumerism movement, begin to form thriving cyber-communities sharing ideas, values, and good practice. The values in this scenario emerge from this increasingly important global phenomenon. They are egalitarian and pragmatic, focused on the search for sustainable solutions that meet the needs of the environment and address the situations that make young people willing to die in suicide bomb attacks. This is a crisis scenario. European civilisation approaches collapse as sea level rise and extreme weather events combine to destroy agricultural land, cities and other infrastructure. In this emergency situation, with destruction of a magnitude comparable with that of the Second World War, the population at large is ready to entertain a profound shift in values and priorities. There is some loss of population, and massive migration, as large areas of land become uninhabitable. But later on, as a new Europe begins to find its feet, there is a sense of optimism and a more robust society, with many experiencing a higher quality of life than in the 1990s. Family and community life becomes more important, and fertility levels settle close to replacement levels. 7.3.1.1 Early stages Prosperity turns to drawn-out recession as Europe faces year after year of extreme weather events. Agricultural production is halved and with other world regions facing similar problems, food prices rise rapidly. GDP plunges, bottoming out at about 30% below 2000 levels. Life is more difficult in Europe than it has been for 60 years, with economic collapse leading to unemployment rates of up to 40%, compounded with the high food prices and the costs of coping with storm damage. Consumption patterns are substantially changed. Over this period, ICT has grown in social importance. The Internet has become the main means of one-to-one communication (including voice and video connections) and the main channel for meetings and for reaching audiences. With a proliferation of information and entertainment sources on the Internet, broadcast TV and the media giants have been unable to keep up with local tastes and culture. Food. Early in the period, major health scares lead to a reduction in meat consumption, especially affecting factory farming of pork and poultry, which had been the fastest growing areas in the 1990s. Pesticides are also in the headlines. There is a rapidly growing but still small market for local, organic produce from small farmers. People are experimenting with new ways of managing the local food economy. Farmers' markets are held regularly in village halls, schools and churches. In areas served badly by supermarkets, community shops are springing up selling locally produced fresh food, staffed by volunteers who are paid in produce. Vegetable box delivery schemes are increasingly popular. Household food budgets begin to increase as people are willing to pay more for quality and security. Later, as recession takes hold, these local sourcing routes become increasingly important. With falling incomes and rising prices, many households are spending 50% of their budgets on food. The proportion of animal products in their diets has decreased significantly. A growing proportion of unwaged households rely on local currency and exchange systems to buy their food. Transport. Terrorist attacks and some high profile accidents lead to a sustained reduction in travel by train, metro and especially air. People are becoming more car-dependant but congestion is worsening rapidly. Effective solutions are developed at a local level in a few towns and cities. In some, the creation of complete networks of bus-only routes encourages a growth in small, local public transport providers. In others, congestion charges lead to more people choosing the bus or cycling. But overall, car traffic and car energy use increases. People are choosing larger, more comfortable cars to sit out the traffic jams. Later, falling household income leads to a rapid reduction in demand for new cars. Car travel also declines as people cannot afford to run the large, high-tech vehicles that are most common, with their high fuel and servicing costs. The new cars that are bought are much smaller and more energy-efficient. Housing. Households initially continue the 1990s trends: fewer people per household, higher levels of comfort, declining energy use in conventional appliances but growing energy use in consumer electronics. At the same time, there is a growing number of experiments in alternative household structures and home provision by the growing anti-consumerism movement, including co-housing, new forms of housing co-operative and self-build. As time progresses, the combination of recession (with little new construction) and mass migration means that in many areas there is tremendous housing pressure. Despite falling incomes, house prices rise and people are forced to live with their immediate and in some cases extended families. Environmental implications. Early in the period, environmental indicators continue their 1990s trends. There is moderate growth in GHG emissions, resulting mostly from a growth in energy use in transport and in the service sector. There is a slowing of progress in addressing local pollution as government becomes powerless to regulate the globalising manufacturing industry. No new vehicle emission standards are established. Pesticide use is on the increase as farmers struggle to deal with growing pest problems caused by warmer winters. The car manufacturers fail to meet their voluntary target for reducing car CO2 emissions, as consumers continue to choose larger, more energy-consuming vehicles. As climate change impacts become more evident, this becomes the main environmental concern. But GHG emissions begin to fall because of the recession. GDP per Capita, Egalitarian Europe
7.3.1.2 Further developments There is growing pressure for households and local communities to be self-sufficient. Electricity grids suffer frequent storm damage and there is a rapid take-off of distributed (local, small-scale) generation, much of it from renewables and using micro-CHP. With the formal economy in tatters, the social innovations of earlier years begin to take off. In some regions, local exchange systems become the most important channel for trading in services and food. Credit unions, housing co-ops and other community organisations provide a safety net, and a base from which the economy begins to recover, although growth in monetary terms is slow compared with the 1990s. The established community initiatives become the legends that everyone else seeks to imitate. Food consumption patterns have been significantly altered. Initially, people eat local, in-season, vegetarian food because that is all they can afford. But as the economy recovers, LOAF (local, organic, animal-friendly, fair-trade) principles are widely followed by both organisations and households. With stronger communities and less time spent in formal employment, it is becoming more popular to cook at home, from raw ingredients. The specialised domestic appliances bought at the beginning of the century are wearing out, and most people cannot afford replacements, so most homes have reverted to relatively simple kitchen equipment. Compost is very much in demand by local growers, so households are careful to save any organic waste. Transport. With the emergence of strong neighbourhood communities and increasingly vibrant local services and production, the demand for transport only increases modestly during the economic recovery. New ways of organising transport are emerging, including various forms of car-sharing, community car provision and leasing. The average car size is rapidly shrinking as the fleet is replaced by ultra-light, ultra-efficient vehicles, powered by electricity or biofuels. There is a rapid growth of bus systems and minibus taxi services, and also greatly improved provision for non-motorised transport. Housing. There is a growing need to rebuild and redesign homes, partly because of damage by storms and other extreme weather events, partly because climate change means that homes need to be designed to cope with different weather conditions. However, as the economy remains fragile, there is rapid growth in self-build and community housing co-operatives, constructing homes with excellent thermal properties from local materials. With relatively few appliances, and the improving efficiency of new appliances, electricity demand is falling. Environmental implications . The environment has been badly affected by climate change, but Europeans are now developing a much simpler lifestyle, with low levels of waste, high levels of composting and recycling. Energy consumption is falling, and there is a growing shift to renewables. Air pollution is increasing due to the growing use of biomass energy. Towards the end of the period, the signs are clear that Europe is getting back on its feet. Although in monetary terms people are less wealthy than in 2000, the wealth is more evenly spread. Mental health is better than it has been since the 1960s and crime levels have decreased substantially. Public surveys show high levels of life satisfaction. Footnotes[1] This section draws principally on the VISIONS “Knowledge is King” scenario, and also on the IPCC SRES A1 scenarios. The dominant culture in this scenario is represented in Table 4.1 as Strategic/Individualist mode. [2] This section draws principally on the VISIONS “Big is Beautiful” scenario, and also on the IPCC SRES A2 scenario. The dominant culture in this scenario is represented in Table 4.1 as the Hierarchy mode, with growing elements of the Heroic Power and Kin Attachment modes. [3] This section draws principally on the VISIONS “Convulsive Change” scenario, and also on the IPCC SRES B2 scenario. The dominant culture in this scenario is represented in Table 4.1 as Pluralistic mode, with growing elements of the Synthetic mode. 8 ReferencesBanister, D. 1998. POSSUM: Final Report for Publication. University College, London. Baudrillard, J. 1970. The Consumer Society- myths and structures (reprinted 1998). Sage Publications, London. Beck, U. 1988. Risk Society: Towards a New Modernity, English translation by M. Ritter, 1992. Sage, London. Beck, D., and C. Cowan. 1996. Spiral Dynamics: Mastering Values, Leadership and Change. Blackwell, Oxford, England. Bird, L., Rolf Wüstenhagen and Jørn Aabakken. 2002. Green Power Marketing Abroad: Recent Experience and Trends. National Renewable Energy Laboratory, Colorado. Bourdieu, P. 1984. Distinction - a social critique of the judgement of taste. Routledge and Kegan Paul, London. Brewer, M., and W. Leon. 1999. The Consumer's Guide to Effective Environmental Choices. Three Rivers Press, New York, NY. Burdick, B. 1997. Die Landwirtschaft produziert zu viel...Treibhausgase. Umwelt kommunale ökologische Briefe 13-14. Burgess, J. 2003. Sustainable consumption: is it really achievable? Consumer Policy Review Volume 11: pp. 78-84. Capros, P., undated. The PRIMES Energy System Model: Summary Description. National Technical University of Athens. Carlsson- Kanyama, A., and M. Faist. 2000. Energy Use in the Food Sector: A data survey. AFR report No. 291. Environmental Strategies Research Group, Stockholm. Carlsson-Kanyama, A. 1998. Climate change and dietary choices - how can emissions of greenhouse gases from food consumption be reduced. Food Policy 32: 277-293. Casey, B., H. Oxley, E. Whitehouse, P. Antolin, R. Duval and W. Leibfritz. 2003. Policies for an Ageing Society: Recent Measures and Areas for Further Reform. Economics Department Working Papers No. 369. OECD, Paris. Center for Energy Studies. 2003. Air Conditioning - Key figures. http://www-cenerg.ensmp.fr/english/themes/syst/html/cles.htm#composants. Cohen, M., and J. Murphy (Eds.). 2001. Exploring sustainable consumption. Elsevier, Oxford, UK. Crocker, D. A., and T. Linden (Eds.). 1998. Ethics of consumption: The good life, ethics and global stewardship. Rowman and Littlefield, Lanham, MD and Oxford, UK. Czikszentmihalyi, M., and Rochberg-Halton. 1981. The Meaning of Things: Domestic Symbols and the Self. Cambridge University Press, Cambridge, England. Dake, K., and M Thompson. 1999. Making ends meet, in the household and on the planet. GeoScience 47: 417-424. Datamonitor. 2003. Savory Snacks Market. Datamonitor, UK. Davis, S. C. 2001. Transportation Energy Data Book, Edition 21. Oak Ridge National Laboratory, Oak Ridge, TN. de Geus, M. 1999. Ecological Utopias: Envisioning the Sustainable Society. International Books, Utrecht. Dennet, D. 1993. Consciousness Explained. Penguin, London. Dickinson, R. 1998. Modernity, consumption and anxiety: television audiences and food choice. pp. 257-271 in R. Dickinson, R. Harindranath and O. Linné, ed. Approaches to Audiences: A Reader. Arnold, London. Dietz, T., and P.C. Stern. 1995. Toward a Theory of Choice: Socially embedded preference construction. Journal of Socio-Economics 24(2): 261-280. Dosi, G., C. Freeman, R. Nelson, G. Silverberg and L. Soete (eds). 1988. Technical Change and Economic Theory. Pinter, London and New York. Douglas, M., and B. Isherwood. 1980. The World of Goods - towards an anthropology of consumption. Penguin Books, London. Douglas, M., D. Gasper, S. Ney and M. Thompson. 1998. Human needs and wants. pp. 195-263 in S. Rayner and E. L. Malone, ed. Human Choice and Climate Change, Volume 1: The Societal Framework. Battelle Press, Columbus, Ohio. Doyal, L., and L. Gough. 1991. A Theory of Human Needs. Macmillan, London. ECMT [European Conference of Ministers of Transport], 1995. Urban Travel and Sustainable Development. OECD, Paris. ECRI [European Credit Research Institute]. 2000. Consumer Credit in the European Union. ECRI, Brussels. EFMA [European Fertilizer Manufacturers' Association], 2004: Forecast of Food, Farming and Fertilizer Use in the European Union, 2001 to 2011. Accessed from Web site, www.efma.org on 22/1/04. Eisenstein, E. L. 1983. The Printing Revolution in Early Modern Europe. Cambridge University Press, Cambridge, England. European Commission. 2003. European Energy and Transport - Trends to 2030. Office for Official Publications of the European Communities, Belgium. European Communities. 2001. Consumers in Europe - Facts and Figures. Office for Official Publications of the European Communities, Luxembourg. European Communities. 2003. 50 years of figures on Europe. Office for Official Publications of the European Communities, Luxembourg. European Environmental Agency. 2002a. Paving the way for EU enlargement (TERM 2002). EEA, Copenhagen. European Environmental Agency. 2002b. Energy and environment in the European Union. EEA, Copenhagen. European Environmental Agency. 2003a. Europe's environment: the third assessment. EEA, Copenhagen. European Environmental Agency. 2003b. Annual European Community greenhouse gas inventory 1990–2001 and inventory report 2003. EEA, Copenhagen. Eurostat. 2001. Analysis and Forecasting of International Migration by Major Groups Part II. Office for Official Publications of the European Communities, Luxembourg. Eurostat. 2002a. Highlights of the panorama of transport 1970 - 1999. Statistics in focus Theme 7 - 3/2002. Eurostat. 2002b. Transport infrastructure in the European Union and Central European Countries. Statistics in focus Theme 7 - 4/2002. Eurostat. 2003a. Eurostat Yearbook 2003. Eurostat, Luxembourg. Eurostat. 2003b. Time Use at Different Stages of Life: Results from 13 European Countries. Office for Official Publications of the European Communities, Luxembourg. Eurostat. 2003c. Energy, transport and environment indicators - Data 1990-2000 - Pocketbook. Eurostat, Luxembourg. Eurostat. 2003d. Europe's environment the third assessment. Eurostat, Luxembourg. Eurostat. 2003e. DVD and video statistics. Statistics in focus Theme 4 - 34/2003. Eurostat. 2003f. Between 1990 and 2000, European agriculture has reduced its greenhouse gas emissions by 6.4 %. Statistics in focus Environment and Energy, Theme 8 - 1/2003. Eurostat. 2003g. New Cronos, data sets. Eurostat, Luxembourg. Eurostat. 2003h. International air transport of passengers 1993-2000. Statistics in focus Theme 7 - 2/2003. FAO. 2003. Organic Agriculture, Environment and Food. FAO, Rome. FAOSTAT. 2003. http://apps.fao.org/. FAO. Federal Statistical Office Germany. 2002. http://www.destatis.de/basis/d/bauwo/wositab2.htm. Frank, R. 1985. Choosing the Right Pond : Human Behavior and the Quest for Status. Oxford University Press, New York. Freeman, C., and C. Perez. 1988. Structural crises of adjustment: business cycles and investment behaviour. Pages 38-66 in Dosi et al, ed. in: Technical Change and Economic Theory. Pinter, London and New York. Fuchs, D., Lorek, Sylvia. 2001. An Inquiry into the Impact of Globalization on the Potential for "Sustainable Consumption" in Households. Prosus, Oslo. Fukasaku, Y. 1999. Environment in technology foresight. pp 49-72 in OECD, ed. Technology Foresight and Sustainable Development. OECD. Paris, Proceedings of the Budapest Workshop. Document DSTI/STP/TIP(99)8/FINAL. Gallopin, G., A. Hammond, P. Raskin and R. Swart, 1997: Branch Points:Global Scenarios and Human Choice. Stockholm Environment Institute, Stockholm. Garnett, T. 2003. Wise Moves project report food, transport and CO2: exploring the relationship. Transport 2000, UK. Ger, G., H. Wilhite, B. Halkier, J. Laessoe, M. Godskesen and I. Røpke. 1998. Symbolic meanings of high and low impact daily consumption practices in different cultures. working paper prepared for Second European Science Foundation Workshop on Consumption, Everyday Life and Sustainability, Lancaster University, England. See http://www.lancs.ac.uk/users/scistud/esf/title.htm. Giddens, A. 1994. Reflexive institutions. pp. 56-109 in U. Beck, A. Giddens and S. Lash., ed. Reflexive Modernisation, Polity Press, Cambridge. Goedkoop, M. J., Jakob Madsen, Durk S Nijdam and Harry C. Wilting. 2002. Environmental load from private Dutch consumption. Paper presented at: Lifecycle Approaches to Sustainable Consumption. IIASA, Laxenburg, 22.11.2002. Goodwin, P. B. 1985. Chapter in Changes in Transport Users. Motivations for Modal Choice: Passenger Transport. European Conference of Ministers of Transport Round Table 68. OECD, Paris. pp. 61-90. Götz, K. 2003. A research concept for mobility styles. Moving Through the Nets: The Physical and Social Dimensions of Travel, 10th International Conference on Travel Behaviour Research, Lucerne. Green, K., and W. Young. 2000. Shopping, Cooking and Eating Function, Final Report, SusHouse Project. University of Manchester Institute of Science and Technology, Manchester. Greening, L. A., and H.T. Jeng. 1994. Life-cycle analysis of gasoline expenditure patterns. Energy Economics Vol. 16 No. 3: pp. 217-228. Grossman, G. M., and E. Helpman. 1993. Endogenous Innovation in the Theory of Growth. Working Paper no. 4527. National Bureau of Economic Research (NBER), Cambridge, MA. Grübler, A., and N. Nakicenovic. 1991. Evolution of Transport Systems: Past and Future. International Institute for Applied Systems Analysis. RR-91-8., Laxenburg, Austria. Harper, P. 2000. The Lifestyle Lab. Schumacher Lecture, Centre for Alternative Technology,, Machynlleth, Wales. Heap, B., and J. Kent (Eds.). 2000. Towards sustainable consumption: a European perspective. The Royal Society, London. Hines, C., and A. Ames. 2000. Ethical Consumerism: research study conducted by MORI for the Co-operative Bank. Presentation available at http://www.co-operativebank.co.uk/downloads/ethics/ethics_mori.pdf. Hirsch, F. 1977. Social Limits to Growth. Revised edition 1995. Routledge, London. Hobson, K. 2002. Competing discourses of sustainable consumption: does the "rationalisation of lifestyles" make sense. Environmental Politics Vol. 11, No. 2: pp. 95-120. Huntington, S. P. 1996. The Clash of Civilisations and the Remaking of World Order. Simon and Schuster, New York. IIED. 1998. Consumption in a Sustainable World. Ministry of the Environment, Oslo and International Institute of Environment and Development, London, Report of the Workshop Held in Kabelvåg, Norway, June 2-4 1998. International Civil Aviation Organization (ICAO). 2003. Industry situation and airline traffic outlook. Information Paper presented by the Secretariat at Worldwide Air Transport Conference: Challenges and Opportunities of Liberalization, Montreal. IFPRI [International Food Policy Research Institute], 2001. Global Food Projections to 2020, IFPRI, Washington, DC. Jackson, T and N Marks 1999. Consumption, Sustainable Welfare and Human Needs - with reference to UK expenditure patterns 1954-1994, Ecological Economics 28(3), 421-442. Jackson, T., and L. Michaelis. 2003. Policies for Sustainable Consumption. UK Sustainable Development Commission. Available at www.sd-commission.gov.uk/pubs/suscon/. Jaeger, C. C., O. Renn, E.A. Rosa and T. Webler. 1998. Decision analysis and rational action. pp. 141-215 in S. Rayner, and E.L. Malone, ed. Human Choice and Climate Change. Battelle Press, Columbus, Ohio. Jongen, W., and Gerrit Meerdink. 1998. Food Product Innovation: How to Link Sustainability and the Market. Agricultural University, Wageningen. Kasemir, B., U. Dahinden, Å. Gerger Swartling, R. Schüle, D. Tabara and C. Jaeger. 2000. Citizens' perspectives on climate change and energy use. Global Environmental Change 10: 169-184. Kempton, W. a. C. P. 1997. Cultural and social evolutionary determinants of consumption. pp. 116-123 in P. Stern, T. Dietz, V. Ruttan, R. Socolow and J. Sweeney, ed. Environmentally Significant Consumption. National Academy Press, Washington, DC. Kramer, K. J., Henri C. Moll, Sanderine Nonhebel and Harry C. Wilting. 1998. Greenhouse gas emissions related to Dutch food consumption. Energy Policy 27: 203-216. Lampkin, N. 2003. Institute of Rural Studies, University of Wales, Aberystwyth. Landes, D. S. 1969. The Unbound Prometheus: Technological Change and Industrial Development in Western Europe from 1750 to the Present. Cambridge University Press, Cambridge, England. Lorek, S., Spangenberg, Joachim H., Felten, Christoph. 1999. Prioritäten, Tendenzen und Indikatoren umweltrelevanten Konsumverhaltens. Endbericht des UBA-Forschungsvorhabens 209 01 216/03. 125. Wuppertal Institute, Wuppertal. Lorek, S. 2001. Household Energy and Water Consumption and Waste Generation - German Case Study. 134. OECD, Overath. Lorek, S., and J.H. Spangenberg. 2002. Environmentally Sustainable Household Consumption. From Aggregate Environmental Pressures to Indicators for Priority Fields of Action. Wuppertal Paper: 1-57. Lorek, S., Lucas, Rainer. 2003. Towards Sustainable Market Strategies - A Case Study on Eco-textiles and Green Power. Wuppertal Institute, Wuppertal. MacIntyre, A. 1985. After Virtue, Second edition. Duckworth, London. Maddison, A. 1995. Monitoring the World Economy 1820-1992. Development Centre Studies. OECD, Paris. Maiteny, P. 2002. Mind the gap: summary of research exploring 'inner' influences on pro-sustainability learning and behaviour. Environmental Education Research Vol. 8: pp. 299-306. Mantzos, L., P. Capros, N. Kouvaritakis and M. Zeka-Paschou. 2003. European Energy and Transport Trends to 2030. European Commission Directorate General for Energy and Transport, Office for Official Publications of the European Communities, Luxembourg. Manzini, E. and F. Jégou, 2000, The Construction of Design Orienting Scenarios, Final Report, SusHouse project. Delft Univesity. Maslow, A. 1954. Motivation and Personality. Harper and Row, New York. Max-Neef, M. 1991. Human Scale Development - Conception, Application and Further Reflection. Apex Press, London. Merck Family Fund. 1995. Yearning for Balance: Views of Americans on Consumption, Materialism and the Environment. Merck Family Fund, Takoma Park, MD. Metschies, G. 2003. International Fuel Prices. gtz, Eschborn. Michaelis, L. 1996a. Mitigation options in the transportation sector. pp 679-712 in R. Watson, M. Zinyowera and R. Moss, ed. Climate Change 1995: Impacts, Adaptations and Mitigation of Climate Change: Scientific-Technical Analyses. Cambridge University Press, Cambridge. Michaelis, L. 1996b. Sustainable Transport Policies: CO2 Emissions from Road Vehicles, Policies and Measures for Common Action, Working Paper 1, Annex I. Expert Group on the UNFCCC, OECD, Paris. Michaelis, L. 1997a. Special Issues in Carbon/Energy Taxation: Carbon Charges on Aviation Fuels. Working Paper 12 in the series "Policies and Measures for Common Action" Under the UN FCCC. , OECD, Paris. Michaelis, L. 1997b. Innovation in Transport Behaviour and Technology. Working Paper 13 in the series "Policies and Measures for Common Action" Under the UN FCCC. , OECD, Paris. Michaelis, L. 2000. Ethics of Consumption. Oxford Centre for the Environment, Ethics and Society, Mansfield College, Oxford. Michaelis, L. 2001. The Media: A Resource for Sustainable Consumption. Oxford Centre for the Environment, Ethics and Society, Mansfield College, Oxford. Michaelis, L., and J. Vowles. 2002. Towards Sustainable Food Consumption - draft report to the Oxford Commission on Sustainable Consumption. Oxford Centre for the Environment, Ethics and Society, Oxford, England. Moisander, J., : , ,. 1998. Motivation for Ecologically Oriented Consumer Behaviour. working paper prepared for 'Second European Science Foundation, Workshop on Consumption, Everyday Life and Sustainability'. Lancaster University, England. See http://www.lancs.ac.uk/users/scistud/esf/title.htm. Munksgaard, J., K. A. Pedersen and M. Wier. 2001. Changing consumption patterns and CO2 reduction. International Journal of Environment and Pollution 15: 146-158. Myers, I. B., and P.B. Myers. 1993. Gifts Differing. Oxford Psychologists Press, Oxford, England. Nakicenovic, N., and R. Swart (eds.). 2000. Emission Scenarios, A Special Report of Working Group III of the Intergovernmental Panel on Climate Change. Cambridge University Press, Cambridge, UK. Nussbaum, M. C., and A. Sen (eds.). 1993. The Quality of Life. Oxford University Press, Oxford, England. Nussbaum, M. 1998. The good as discipline, the good as freedom. pp.312-341 in D. A. Crocker, and T. Linden, ed. Ethics of Consumption: The Good Life, Justice and Global Stewardship. Rowman and Littlefield, Lanham, MD and Oxford, England. OECD. 1998. Eco-Efficiency. OECD, Paris. OECD. 1999. Technology Foresight and Sustainable Development. Proceedings of the Budapest Workshop, Document DSTI/STP/TIP(99)8/FINAL. OECD, Paris. OECD. 2001. Sustainable Consumption: Sector Case Study Series - Household Food Consumption: Trends, Environmental Impacts and Policy Responses. OECD, ENV/EPOC/WPNEP(2001)13, Paris. OECD. 2001a. Environmental Outlook, Paris. OECD. 2001b. Sustainable Consumption: Sector Case Studiy Series - Household Energy and Water Consumption and Waste Generation: Trends, Environmental Impacts and Policy Responses. ENV/EPOC/WPNEP(2001)15, Paris. OECD. 2001c. Sustainable Consumption: Sector Case Studiy Series - Household Food Consumption: Trends, Environmental Impacts and Policy Responses. OECD, ENV/EPOC/WPNEP(2001)13, Paris. OECD. 2002. Environmental Data Compendium 2002. OECD, Paris. OECD. 2002. Towards Sustainable Household Consumption? Trends and Policies in OECD Countries, Paris. Payer, H., P. Burger, and S. Lorek. 2000. The Environmental Impact of Household Food Consumption in Austria. Paper for the OECD Environment Directorate, Programme on Sustainable Consumption, Paris. Pfeiffer, C. 2000. Shelter: Function Report. The SusHouse Project. Deflt University of Technology, Delft, the Netherlands. Porter, J., O. Romosan, M. Marciani, L. Thorkildsen and F. Kenny,. 1999. The Results of the Stimulus Project. European Commission, DG Research,, Brussels. Putnam, R. D. 2001. Bowling Alone: The Collapse and Revival of American Community. Simon and Schuster, New York. Raskin, P., T. Banuri, G. Gallopín, P. Gutman, A. Hammond, R. Kates, R. Swart, 2002, Great Transition: The Promise and Lure of the Times Ahead. A report of the Global Scenario Group. Stockholm Environment Institute, Stockholm. Roepke, I. 1999. The dynamics of willingness to consume. Ecological Economics 28: 399 - 420. Rosenberg, N. 1994. Exploring the Black Box: Technology, Economics and History. University Press, Cambridge, England. Røpke, I. 2001. New technology in everyday life - social processes and environmental impact. Ecological Economics 38. Rotmans, J., C. Anastasi, M. van Asselt, D. S. Rothman, J. Mellors, S. Greeuw, C. van Bers, 2001. VISIONS: The European Scenarios. International Centre for Integrative Studies, Maastricht. RTS Associates. 2003. Ready meal products. Ingredients Strategist 29/04/2003. Sanne, C. 2002. Willing consumers - or locked-in? Policies for a sustainable consumption. Ecological Economics 42: 273-287. Schafer, A., David G. Victor. 2000. The future mobility of the world population. Transportation Research Part A 34(3) 171-205. Schor, J. 1998. The Overspent American. Basic Books, New York. Segal, J. 1998. Consumer Expenditures and the Growth of Needs-Related Income. pp. 176-197 in D. A. Crocker, and T. Linden, ed. Ethics of Consumption: The Good Life, Justice and Global Stewardship. Rowman and Littlefield, Lanham, MD and Oxford, England. Sen, A. 1993. Capability and Well-Being. pp. 30-53 in M. C. Nussbaum, and A. Sen, ed. The Quality of Life. Oxford University Press. Shepherd, M., B. Pearce, W. Cormack, L. Philipps, S. Cuttle, A. Bhogal, P. Costigan and R. Unwin. 2003. An Assessment of the Environmental Impacts of Organic Farming. Department of Environment, Food and Rural Affairs, London. Shove, E., and A. Warde. 1997. Noticing Inconspicuous Consumption. paper presented to the ESF TERM Programme workshop on Consumption, Everyday Life and Sustainability. http://www.comp.lancs.ac.uk/sociology/esf/inconspicous.htm, Lancaster University, April 1997. Shove, E. 2003. Comfort, Cleanliness and Convenience: the social organisation of normality. Berg Publishers, Oxford, forthcoming. Spangenberg, J. H., Lorek, Sylvia. 2002. Lebensstandardmessungen einschließlich nicht-marktlicher Dienstleistungen (Measures for the standard of living including non-market services) in G. Bosch, Hennicke, P., Hilbert, J., Scherhorn, G., ed. Zukunft der Arbeit in der Dienstleistungsgesellschaft. Wissenschaftszentrum NRW, Gelsenkirchen/Wuppertal. Staats, H. J., and P. Harland. 1995. The Ecoteam Program in the Netherlands. Study 4: A Longitudinal Study on the Effects of the EcoTeam Program on Environmental Behaviour and its Psychological Backgrounds, Summary Report, E&M/R-95/57. Centre for Energy and Environmental Research, Faculty of Social and Behavioural Sciences, Leiden University, Leiden, the Netherlands. Stamminger, R. 2001. Energy consumption of domestic appliances in European households. European Committee of Domestic Equipment Manufacturers, Brussels. Stern, P. C. 1986. Blind Spots in Policy Analysis: What Economics Doesn't Say About Energy Use. Journal of Policy Analysis and Management Vol. 5: pp 200-227. Stern, P., T. Dietz, V. Ruttan, R. Socolow and J. Sweeney (eds.). 1997. Environmentally significant consumption. National Academy Press, Washington, DC. Stokes, G. M. 1999. Critical technologies for the environment. pp. 73-82. in: Technology Foresight and Sustainable Development: Proceedings of the Budapest Workshop, Document DSTI/STP/TIP(99)8/FINAL. OECD, Paris. Stoll-Kleemann, S., T. O'Riordan and C. Jaeger. 2001. The psychology of denial concerning climate mitigation measures: evidence from Swiss focus groups. Global Environmental Change Vol 11: 107-117. Stø, E., Gunnar Vittersø and Pål Strandbakken. 2000. The tension between micro and macro strategies for short term changes in consumer behaviour: Introducing the green household budget. Paper presented at the ProSus/CSTM Workshop on Sustainable Household Consumption: Impacts, Goals and Indicators for Energy-use, Transport and Food, University of Twente, November 17- 9, 2000. Tainter, J. 1996. Complexity, problem solving and sustainable societies in R. Costanza, O. Segura and J. Martinez-Alier, ed. Getting Down to Earth: Practical Applications of Ecological Economics. Island Press. Taylor, C. 1989. Sources of the Self: The Making of the Modern Identity. Cambridge University Press. Thompson, M., and S. Rayner. 1998. Cultural discourses. pp. 265-343 in S. Rayner, and E. L. Malone, ed. Human Choice and Climate Change. Volume 1. The Societal Framework. Battelle Press, Columbus, Ohio. Thompson, M., R. Ellis and A. Wildavsky, 1990. Cultural Theory, Westview Press, Boulder, CO. Torbert, W. R., D. Fisher and D. Rooke. 2001. Personal and Organisational Transformations Through Action Research. Edge/Work Press, Boston, MA. UNDSD [United Nations Division for Sustainable Development], 2003a. Survey of International Activities on Consumption and Production Patterns. Background paper for the International Expert Meeting on a 10-Year Framework of Programmes for Sustainable Consumption and Production, Marrakech, June 2003. UNDSD, New York. UNDSD, 2003b. International Expert Meeting on the 10-year Framework of Programmes for Sustainable Consumption and Production. Summary by the co-chairs of the meeting. UNDSD, New York. UNEP [United Nations Environment Program], 2002. Global Environmental Outlook 3. Earthscan, London. UNPD. 2003. World Population, 2002. UNPD, New York. UNPD [United Nations Population Division]. 2001. World Urbanization Prospects, The 2001 Revision. UNPD, New York. Veblen, T. 1899. The Theory of the Leisure Class, 1993 edition, Dover. Vergragt, P. 2000. Strategies Towards the Sustainable Household, Final Report, SusHouse Project. Delft University of Technology, Delft, the Netherlands. Vetterli, W., R. Perkins, J. Clay and E. Guttenstein. 2002. Organic Farming and Nature Conservation. OECD Workshop on Organic Agriculture, 23-26 September 2002, Washington D.C. von Weizsäcker, E. U., A.B. Lovins and L. Hunter Lovins. 1997. Factor Four. Earthscan, London. Vringer, K., and K. Blok. 1995. The direct and indirect energy requirement of households in the Netherlands. Energy policy 23(10). Warde, A., E. Shove and D. Southerton. 1998. Convenience, schedules and sustainability. draft paper for European Science Foundation workshop on sustainable consumption, Lancaster University, March 27-29, 1998. Westra, L., and P. H. Werhane, (Eds.). 1998. The business of consumption: Environmental ethics and the global economy. Rowman and Littlefield, Lanham, MD and Oxford, UK. Wilk, R. 2002. Consumption, human needs, and global environmental change. Global Environmental Change Vol 12: 5-13. World Bank. 1997. Expanding the Measure of Wealth: Indicators of Environmentally Sustainable Development, Environmentally Sustainable Development Series and Monograph Studies, No. 17, The World Bank, Washington, D.C. World Commission on Environment and Development. 1987. Our Common Future. Oxford University Press, Oxford and New York. World Resource Institute. 2003. http://earthtrends.wri.org/searchable_db/index.cfm?theme=6&CFID=417742&CFTOKEN=95704057 Yussefi, M., and Helga Willer. 2003. The World of Organic Agriculture 2003 – Statistics and Future Prospects. International Federation of Organic Agriculture Movements (IFOAM), Tholey-Theley.
|
|||||||||||||||||||||||||||||||||||||||||||||||||||||||||||||||||||||||||||||||||||||||||||||||||||||||||||||||||||||||||||||||||||||||||||||||||||||||||||||||||||||||||||||||||||||||||||||||||||||||||||||||||||||||||||||||||||||||||||||||||||||||||||||||||||||||||||||||||||||||||||||||||||||||||||||||||||||||||||||||||||||||||||||||||||||||||||||||||||||||||||||||||||||||||||||||||||||||||||||||||||||||||||||||||||||||||||||||||||||||||||||||||||||||||||||||||||||||||||||||||||||||||||||||||||||||||||||||||||||||||||||||||||||||||||||||||||||||||||||||||||||||||||||||||||||||||||||||||||||||||||||||||||||||||||||||||||||||||||||||||||||||||||||||||||||||||||||||||||||||||||||||||||||||||||||||||||||||||||||||||||||||||||||||||||||||||||||||||||||||||||||||||||||||||||||||||||||||||||||||||||||||||||||||||||||||||||||||||||||||||||||||||||||||||||||||||||||||||||||||||||||||||||||||||||||||||||||||||||||||||||||||||||||||||||||||||||||||||||||||||||||||||||||||||||||||||||||||||||||||