|
Environmental Project no. 929, 2004 Valuation of Chemical related Health ImpactsEstimation of direct and indirect costs for asthma bronchiale, headache, contact allergy, lung cancer and skin cancerContents
10 Unit costs - summary of results
Appendix 1. List of sources for the direct cost calculations 1 Dansk resuméFormålet med projektet er at estimere enhedsomkostningerne for udvalgte kemikalierelaterede sygdomme. Værdierne tænkes anvendt i forbindelse med samfundsøkonomiske analyser på kemikalieområdet. Enhedsomkostningerne skal afspejle omkostningerne for hele samfundet ved et tilfælde af en given sygdom. Dette inkluderer således både de direkte omkostninger i form af omkostninger ved behandling samt de indirekte omkostninger, der omfatter såvel produktionstabet som det individuelle velfærdstab. Fokus i projektet er estimering af de direkte omkostninger, som suppleres med skøn for produktionstabet og velfærdstabet. De udvalgte sygdomme er:
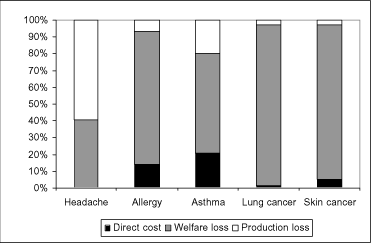
Metode Det individuelle velfærdstab estimeres på basis af benefit transfer fra eksisterende betalingsvilligheds-studier. Her korrigeres for pris- og købekraftsforskelle i forbindelse med anvendelse af studier fra andre lande. Produktionstabet beregnes ved brug af den gennemsnitlige primærindkomst per person i og uden for arbejdsstyrken. Astma Enhedsomkostningen per astmaanfald beregnes til knap 2.000 kr. hvoraf de direkte omkostninger udgør ca. 420 kr., velfærdstabet knapt 1.200 kr. og produktionstabet ca. 390 kr. Hovedpine Enhedsomkostningen per tilfælde hovedpine beregnes til godt 360 kr. Heraf udgør de direkte omkostninger stort set ingenting (1,30 kr.), mens velfærdstabet og produktionstabet begge udgør ca. 180 kr. Kontaktallergi Enhedsomkostningen for kontaktallergi over hele restlevetiden beregnes til ca. 290.000 kr. Heraf udgør de direkte omkostninger godt 40.000 kr., velfærdstabet godt 230.000 og produktionstabet ca. 20.000 kr. Endvidere gives et eksempel på enhedsomkostningernes anvendelse ved en illustrativ beregning af de sundhedsmæssige gevinster ved forbud mod nikkel i udvalgte produkter vedtaget i 1989. Det antages at lovgivningen har medført en reduktion i tilfældene af nikkelallergi på 2.500 årligt (steget lineært fra 0 til 2500 over de første 5 år). Beregningen foretages for en tidshorisont på 20 år. Ved anvendelse af enhedsomkostningen for kontaktallergi resulterer dette i nutidsværdi for de samlede gevinster på godt 9,7 mia. kr. Lungekræft Enhedsomkostningen per tilfælde lungekræft beregnes til ca. 9,7 mil. kr. De direkte omkostninger udgør godt 140.000 kr., mens velfærdstabet er den væsentligste omkostningskomponent af størrelsesordnen ca. 9,3 mil. kr. Produktionstabet udgør godt 250.000 kr. Hudkræft Enhedsomkostningen per tilfælde hudkræft beregnes til omkring 250.000 kr., hvoraf de direkte omkostninger udgør omkring 12.000 kr., velfærdstabet ca. 230.00 kr. og produktionstabet knapt 7.000 kr. De samlede omkostningsestimater
Vurdering af usikkerheden på omkostningsestimaterne Estimeringen af de lave og høje skøn er baseret på en forholdsvis overordnet vurdering foretaget af konsulenten frem for en matematisk estimering af de respektive fraktiler. Fremgangsmåde er som følger: Først identificeres de kritiske parametre ud fra kriterierne vigtighed og grad af usikkerhed. Dernæst gives skøn på lave og høje værdier for de parametre identificeret som værende vigtige og/eller meget usikre. På basis af de opstillede parameterværdier udregnes de lave og høje skøn. Resultatet bliver følgende bånd for omkostningsestimaterne: Astma: 900 kr. - 2.600 kr. 2 English summaryThe purpose of the project is to estimate the unit costs of selected chemical related diseases. The estimates are expected to be used in connection with economic analyses in the area of chemicals. The unit costs shall reflect the costs for the entire society following a case of the given disease. Therefore, the unit costs include the direct costs in terms of costs of treatment as well as the indirect costs in terms of the production loss and the individual welfare loss. Focus in the present project will be on a detailed estimation of the direct costs supplemented with more rough assessment of the indirect welfare loss based on benefit transfer of key values. The selected diseases are:
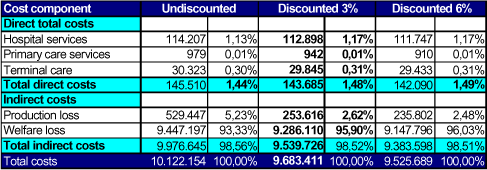
Method The individual welfare loss is estimated by benefit transfer from existing willingness-to-pay studies. The values are corrected for differences in prices and purchasing power in connection with benefit transfer from foreign studies. The production loss is estimated by the average primary income per person in and outside the Danish working force. Asthma The unit cost per asthma attack is estimated to a little less than DKK 2,000, where the direct costs amount app. DKK 420, welfare loss app. DKK 1,200 and the production loss app. DKK 390. Headache The unit cost per episode of headache is estimated to a little more than DKK 360. Of this, the direct costs amount to practically nothing (DKK 1.30), while the welfare loss and the production loss each amount to around DKK 180. Contact allergy The unit cost of contact allergy over the entire remaining life time is estimated to app. DKK 290,000. The direct costs amount a little more than DKK 40,000, the welfare loss around DKK 230,000 and the production loss DKK 20,000. Furthermore, an example of the use of the unit cost estimates is given by an illustrative estimation of the health related benefits of the prohibition against nickel in selected products agreed upon in 1989. It is assumed that the regulation has resulted in a reduction in nickel allergy of 2,500 cases per year (increased linearly from 0 to 2,500 during the first 5 years of the prohibition). The calculation is carried out for a time horizon of 20 years. By utilising the unit cost for contact allergy this results in a present value for the benefits of app. DKK 9.7 billion. Lung cancer The unit cost per case of lung cancer is estimated to app. DKK 9.7 m. The direct costs amount to around DKK 140,000, while the welfare loss is the most important component with a size of more about DKK 9.3 m. The production loss amounts to around DKK 250,000. Skin cancer The unit cost per case of skin cancer is estimated to around DKK 250,000, of which the direct costs amount app. DKK 12,000, the welfare loss app. DKK 230,000 and the production loss a little less than DKK 7,000. Summary of the unit cost estimates
Assessment of the uncertainty of the cost estimates The estimation of the low and high estimates is based on a rather overall assessment performed by the consultant instead of a mathematic estimation of the percentiles. The method is as follows: First, the main critical parameters are identified from the criteria of importance and degree of uncertainty. Next, estimates of low and high values of the parameters identified as very important and/or very uncertain are given. On the basis of these parameter values the low and high estimates are established. The result is following range for the unit cost estimates: Asthma: DKK 900 - 2,600 3 IntroductionEconomic assessment of environmental issues is a common used tool in the political environmental prioritisation process. Economic valuation of environmental and health related issues is one of the core inputs for such assessments. In the area of chemical reduction, most economic assessments only consider the cost side of a reduction initiative (that is, cost effectiveness analysis). The reason for this is that the environmental and health effects are difficult to quantify and especially to translate into a value that can be compared with the costs. Thus, an important step towards an improvement of economic assessment of chemical reduction initiatives will be to provide values for the benefits attained by reducing the exposure to chemicals. The purpose of this study is to provide economic values for a selected number of chemical related health impacts. It is the intention that these values - or unit prices - can be used as input in economic assessment of various potential chemical reduction initiatives. It is important to stress that the main focus of this study is on:
Below, the impact path is illustrated. This project only considers the price of given damages in terms of specific diseases. There is a lot complications attached to the estimation of the number of diseases, as the impact path from emission of chemicals to exposure to damages is characterised by complex interactions between many factors.
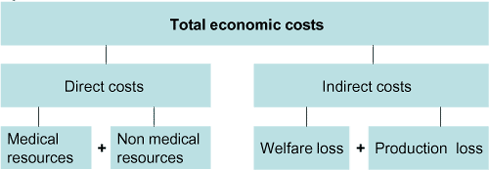
The values are to reflect the incremental price for the society following a certain health impact. This means that both direct and indirect cost related to the disease are included, although focus in the present study has been on the development of direct costs. Although the direct costs often accounts for a small share of the total costs, having a solid estimate of this element will be very useful. It reduces the total uncertainty about the valuation and it provides important information about the share of costs related to various public budgets. Assessment of the welfare element is complicated and significant improvement would require quite comprehensive analysis which has been out of scope for this study. Instead, the welfare cost element has been based on existing data sources and it has been chosen to use the same values as used in a number of valuation studies commissioned by the Danish Ministry of Environment; thereby consistence is secured. The elements included in the estimates are further described in Chapter 2 on valuation methodology. Costs are reported in DKK as it is a Danish study. € 1 is equal to 7.44 DKK (2003). Furthermore, costs for each component are reported with accuracy of one DKK as they are used in subsequent calculations, despite the uncertainty level of the estimates. Finally, in Chapter 10, the uncertainty of the unit costs estimates is assessed. Many sources have been used to compile the study. To the extent that international results have been used, their relevance in a Danish context has been evaluated. These evaluations have been made in cooperation with experts from each field of specialisation. The expert assessments are obtained from the persons listed in Appendix 2. The present report documents the estimation of unit prices for five selected diseases: Asthma, headache, contact allergy, lung cancer and skin cancer. The diseases have been selected by DEPA and COWI in cooperation from the criteria of the relevance in relation to chemicals as well as the data availability. Chapter 2 describes the overall valuation methodology applied in the study. Next, each disease is considered separately in the chapters 3-7, including estimation of each cost component to be included in the unit cost estimate. Chapter 8 summarises the results, assesses the uncertainty of the estimates by providing high and low estimates and conclude on the findings. Along with this, it is illustrated how the estimates may be used in an economic assessment relation by an example of nickel allergy. 4 Valuation MethodologyThe objective of the study is to develop unit costs for the selected diseases that can be used in social cost-benefit analyses.. Therefore, it is the the total costs of the disease, and not only the direct costs, that has to be measured. The unit prices for each disease are to reflect the average incremental costs due to the disease. In the estimate co-morbidity costs (increased likelihood of acquiring other diseases when having one disease) are also included. In general, when assessing the total costs of a disease, the resources used should be valued at their opportunity costs (Brouwer et al. (2001)). This ensures that the cost estimate can be appropriately used in cost-benefit analysis. However, in health care markets, prices do often not reflect opportunity cost. The reason for this is market failures and the fact that payment is often fully or partially done by third party payer. In practice, however, it is difficult to assess the degree to which the available prices do not reflect opportunity costs. Therefore, correction of bias relation in the available prices will not be attempted. The total economic costs of a disease consist of both direct and indirect costs (Figure 4-1). Direct costs are costs of medical and non-medical resources directly related to treatment of the disease. Indirect costs are the costs of the welfare and production loss related to the disease. Figure 4-1 Total economic costs of a disease
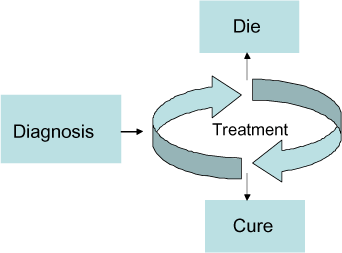
As already mentioned, it is the assessment of the direct cost that is in focus in this study. Based on collection of specific data for the resource use and unit costs for individual elements in the medical and non-medical treatment of specific disease, it is possible to provide robust estimates of the direct costs. Only some elements like hospital costs have been assessed before, while a systematic overview of all direct cost elements for a given disease is the main contribution of this study. The basis for valuation of the economic costs of the selected diseases will be a description of the disease course defined by a number of stages, each characterised by different costs (see Figure 4-2). Figure 4-2: Illustration of a Disease course
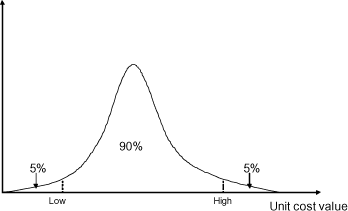
The costs can be estimated either by assessing the costs at each state along with the probability of reaching the state or by estimating the costs of the total course aggregated. What approach to apply will depend on the data availability within each disease and within each cost element. The approach applied in the specific case is described in more detail in the following chapters. The description of the valuation methodology is introduced by a section on the general issues of valuation method concerning in principle all cost elements. Next, each of the cost components of Figure 4-1 is described in details along with suggestion for the best valuation methodology for the present purpose. 4.1 General issues related to valuation methodologyThe overall valuation framework will follow the guidelines of the Danish Ministry of Environment and the Danish Ministry of Finance found in Møller F. et al (2000) and Finansministeriet (1999) respectively. In addition to this, the following issues are highlighted below. 4.1.1 DiscountingDiscounting is used in order to take into account that the costs will occur in different time periods. DEPA generally recommends a discount rate of 3%1, whereas the Danish Ministry of Finance recommends that a 6% discount rate is used in cost-benefit analyses (Finansministeriet 1999). In the present study, a discount rate of 3% will be applied along with a sensitivity analysis using 6% instead of 3%. 4.1.2 UncertaintiesCosts are calculated for the average patient. In order to take uncertainty of the estimated costs and intensity of treatment into account low and high estimates will be provided along with the best estimate. Ideally, the low and high estimates are to reflect the 5 and 95 percent quartiles of the best estimate. These estimates are based on heretic assessments of possible lower and higher costs. The reason for the heretic assessment is that exact calculation of a specific quartile is not possible within the scope of the present project. 4.1.3 Age distribution and implication on the estimatesIt is a currently ongoing discussion whether the size of production loss and individual welfare loss is age dependent (see sections 4.3 and 4.4 for further information of the points of discussion). In the present study, it is assumed that the cost elements are age independent. For chronic diseases such as contact allergy, the calculation is based on an assumption of starting age of the disease and average remaining lifetime. 4.2 Direct costsDirect costs are costs for medical resources and non-medical resource. Medical resources are costs for medical services needed for the treatment; i.e. hospital services, drugs, medical specialists, GPs (General Practitioners), nursing home, home help services, etc. Non medical resources are costs for non medical services needed for the treatment; i.e. transportation, worker retraining, acquisition of special equipment. In the estimate of direct costs, only costs of medical resources are included. 4.2.1 Methods estimation of direct costsLifetime costs for a disease or components of a disease can be estimated from either prevalence based annual costs or incidence based costs (Hudgson (1994))2. Roughly speaking, prevalence based lifetime costs are estimated by dividing total annual costs with the number of persons having the disease. Incidence based lifetime costs are estimated by modelling lifetime progression of the disease The progression of the disease is either modelled using a simple probability tree or a Markov model. A Markov model is a way to model how a disease evolves over time (Briggs and Schulpher (1998)). From the Markov model, the expected lifetime costs can be directly estimated. The advantage to this method is that, that the costs are directly linked to the disease course. The main drawback is the detailed level of information required. For a further introduction to Markov models in a health care context see Briggs and Schulpher (1998) or Sonnenberg and Leventhal (1998). In this report, the costs estimates are to be based on existing data. Therefore, the approach taken depends on the available data and can be different for the different cost components of the same disease. As a general rule, lifetime costs derived from the prevalence approach will often be more accurate than using the incidence approach when having poor estimates of important parameters (Hudgson (1994)). This is taken into account when choosing what method to apply. 4.2.2 Data sourcesDisease states A disease consists of a number of disease states. Sources for classifying a disease into states are based on Danish, international publications and expert input. Treatment within each disease state The sources for treatment solutions within each disease state are based on Danish publications. Where no Danish publications are available, resource use is based on expert input by international acknowledged Danish physicians. Expert input The experts who have provided input are listed in Appendix 2 Resource Persons. Input was given during a meeting held with the expert. Prior to the meeting all relevant material was sent to the expert. The meeting was followed up with email, telephone conversation or subsequent meeting where necessary. All experts were given the opportunity to approve or confirm when they were quoted in the report. Survival data For estimation of the number of persons dying from a disease, the relative survival is used. The relative survival is the observed survival divided with the expected survival for the background population with the same age and sex distribution (Kræftens Bekæmpelse (2003a)). Therefore, the number of persons dying can be interpreted as the excess mortality which can be attributed to the disease. Transition probabilities A transition probability describes the patients move from one disease state to another. The transition probabilities depend, among other things, on the actual treatment given. The transition probabilities are based on Danish data. In the literature, 5 and 10 year survival probabilities will often be available. However, in order to estimate expected lifetime costs, 1 year transition probabilities are needed. Calculation of transition rates from t year probabilities are based on the exponential distribution as this is a commonly used distribution for this purpose. Economic data All cost data reflect 2002 values. When 2002 cost estimates are not available, the most recent cost data are used and inflated to 2002 values. The Danish consumer price index for health care services is used to inflate the costs data. Patients' co-payments are not included in the direct costs as this part is included in the WTP estimate. An utilisation rate describes the yearly expected number of services used. The utilisation rates are based on Danish data. When no data are available, the utilisation rate is based on an expert assessment. Hospital costs are based on the Danish DRG (Diagnosis Related Groups) (2002) system covering all hospital services. Costs of Primary Health Care Services, are based on the agreed rates for 2002 between 'Sygesikringens forhandlingsudvalg', 'Foreningen af specialpraktiserede læger (FAS)' and 'Praktiserende lægers organisation (PLO)'.3 Drug costs at the hospitals are covered through the DRG-system. Data on costs of prescription drugs related to each disease has been estimated either from published data or expert input. 4.3 Individual welfare lossThe individual welfare loss shall express the cost in terms of pain and suffering for the victim following the disease as well as worry and grief caused to close relations. The individual welfare loss can be said to include following elements:
There are two distinguished approaches for estimation of the welfare loss, namely "the human capital approach" and the "Willingness to pay (WTP) approach". Figure 4-1 gives an overview of which of the above-mentioned cost elements are included in the two methods. The methods are further described below. Table 4-1: Elements included in human capital and WTP approach
4.3.1 Human capital approachIn the human capital approach, humans are viewed as capital like other kind of capital for a production process. In this regard, a human life is valued in terms of what it is worth in terms of input for production, which is equal to the lost future contribution to the production of the society. The human capital approach thus estimates the welfare loss by the gross production loss. Besides the net production loss (described in section 4.4 below) this includes the individual's loss in terms of lost income, corresponding to the first bullet above, whereas the remaining four bullets are not included. One way of improving the human capital method is to add a statement of the cost in terms of lost leisure time. Such an approach is described further in Danish Road Directorate (2002). Inclusion of this element will improve the estimates of the human capital method, but will still lack the remaining three bullets (Loss due to pain and suffering, loss due to private medicine and treatment costs, and suffering and sacrifice for close relations). 4.3.2 Willingness-to-pay approachThe WTP approach on the other hand seeks to estimate the welfare loss by revealing their willingness to pay for avoiding (or accepting) the risk of a certain morbidity impact. The methods for this can be divided into stated preferences and revealed preferences method. In stated preference method the WTP is estimated people are directly asked about their WTP, whereas revealed preferences method seeks to reveal the WTP by looking at the behaviour on related markets. There are numerous problems related to the performance of a WTP study, and in order to deal with these problems, it tends to be the very resource demanding to carry out a WTP study. This is mainly the reason why very few adequate WTP studies of morbidity issues have been carried out. Thus, whereas the human capital approach does not include all aspects of the welfare loss, the WTP approach may be critical in terms of its degree of accuracy. 4.3.3 Estimation of WTP by benefit transferDue to the complexity of carrying out a WTP study, the most commonly used approach for estimating the individual welfare loss in this regard is use of benefit transfer. Benefit transfer is defined as the "use of existing information designed for one specific context to address policy questions in another context" (Pearce, 2000). There are numerous additional problems connected with benefit transfer besides the problems connected with performance of the WTP study itself and, thus, benefit transfer should be used with caution. A number of issues affecting the WTP value must be considered and compared between the original study and the actual case. Especially, following issues are of importance:
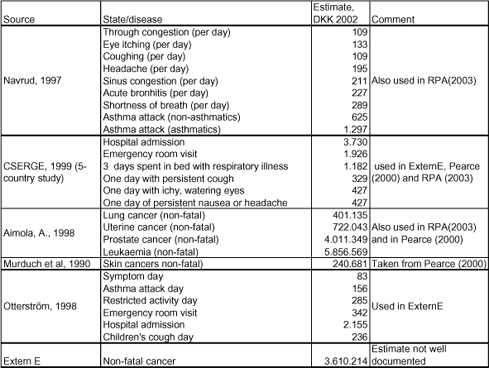
4.3.4 Valuation methodology in the present studyIn the present valuation study, the individual welfare loss will be estimated by benefit transfer from WTP studies to ensure that all elements of the welfare loss in principle are included although it is recognized that these estimates are likely to be very uncertain, which will result in high deviation in low and high estimate relative to the mean value. As mentioned above there are a number of critical issues that must be considered in the design and performance of the WTP survey. This relates to e.g. the formulation of the questions, the method used for collection of answers, the population group asked, their degree of understanding the morbidity effect etc. In the present study, we do not investigate the original surveys for such critical issues. We will use generally accepted studies by assuming that they are designed and performed in the best possible way. In addition to this, we will consider other person's critical review of these studies and highlight these issues if they are considered important in the present context. The critical issues related to benefit transfer will be taken into account in following way: The original values will be adjusted to 2002-prices by the official Danish consumer price index (Statistics Denmark, 2003b). In case of international values, the original WTP estimates will be corrected for differences in per capita income level, where the income level is adjusted for differences in purchasing power by such index values from Eurostat. After this correction, the value is inflated to 2002 prices.4 Furthermore, differences in end points valued and cultural differences should be taken into account. It is not so obvious, however, how to correct quantitatively for these factors. In the present context these issues are addressed by introducing high uncertainty intervals on this cost element in connection with development of low and high unit cost estimate (section 10.2.2) in cases of benefit transfer from studies of very different end points and/or studies from a country with large cultural differences compared to Denmark. 4.3.5 The welfare loss and the disease courseHow estimation of the welfare loss is connected to the defined course tree depends on, how the WTP is discovered. Either, people may be asked about their willingness to pay for each state in the course tree and these values are subsequently combined with the probabilities of the various states. Or people are asked about their total WTP for avoiding a certain diagnosis/illness. The latter is clearly the simplest one, but it does demand that detailed information about the course of the illness is provided for the respondents in a way that ensures that people asked do fully understand the consequences of the disease. The approach used here depends on the data available from other studies, which will be used for benefit transfer. Since data within the different diseases differs in shape, the approach differs somehow among the diseases valued. The concrete approach used within each disease is described in the disease specific chapters. 4.3.6 Existing data - morbidityAs mentioned earlier, rather few studies have actually provided estimates of individual welfare loss of diseases by carrying out WTP surveys. We have searched for exiting studies relevant to this project and have found, that exiting estimates steams from very few actual WTP surveys. Below an overview of the estimates that are most frequently used.
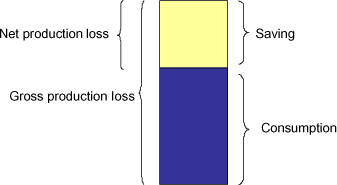
The estimates used here will be found within this list. 4.3.7 Individual welfare loss in connection with mortalityThe value of a statistical life is used with regard to assessing the welfare loss from mortality.5 There are many complications attached the concept of estimating the welfare loss from increased mortality. Only, two problems related to the application of the value of a statistical life should be mentioned here. Firstly, it is an ongoing discussion whether to correct for the average age of the patient by using the value of a life year lost (VOLY) or using the age independent value of a statistical life (VSL). The key issue in the discussion is the empirical evidence on whether there is a link between WTP and remaining lifetime. As the current empirical evidence seems not to indicate a proportional relationship, which is required for supporting the use of VOLY, in most cases the VSL is suggested. However, the age aspect is then partly taken into account by modification of the VSL. The specific choice of value is discussed in the next section. Overall, it has been decided to use the value of a statistical life and not the VOLY approach, based on recommendations of DEPA (2003). Secondly, it may be stated, that the value will be dependent of the cause of death. E.g. one may point on the "dread effect" of cancer compared to other diseases or accidents6. This issue is not further addressed here. 4.3.8 Existing data - mortalityThere are numerous sources of a value of a statistical life. For the present purpose, it has been decided to use an estimate that has been used by DEPA in other similar studies. This value is based on the work and recommendations behind developing a set of EU standard values. Through the large study on external costs of energy production, called ExternE, many unit values were developed. In order to prepare a set of standard benefit values to be used in relation to air pollution, the EU Commission called a panel of valuation experts to address the issue of how to value the welfare loss for changed mortality. The recommendation of the panel was used in the development of the benefit tables, named the BeTa database7. The standard estimate for value of a statistical life recommenced by the EU panel is € 1.4 million (1999-prices). Furthermore, they propose to use an estimate of € 1 million in connection with air pollution to take into account the fact that it is mainly older people that die from air pollution. This means that the estimate of € 1 million includes the age aspect8. A choice had to be made whether to use the standard value or the one including the age aspect. Since the estimate in the present study is to be used in connection with lung cancer, which mainly hits people above a certain age, it may seem appropriate to use the estimate corrected for the age aspect. Furthermore, this estimate has been used as basis in other valuation studies of DEPA, and thus ensures consistency between different works of DEPA it is preferable to use the same value. It has then been decided to use the estimate of a VSL generally recommended by DEPA, which is based on the age corrected value suggested by the EU Commission. In this way we ensure consistency with other DEPA studies. Also, the age aspect is taken into consideration in the cases when is most needed without making specific age corrections9. DEPA recommends a value of DKK 9.64 million, (2002-prices), which arises from the value of the EU Commission of € 1 million, corrected for differences in purchasing power and then inflated to 2002 price level. For further information, see DEPA (2003). 4.4 Production lossThis component refers to the loss of the society from less production due to morbidity or mortality. It should be emphasised that the production loss here is something else than individual welfare loss measured through the human capital approach. Here, production loss refers to the issue of whether there is reduction in the aggregated national product that is not accounted for in the individual welfare assessment. Such a production loss is independent of the approach used to assess the individual welfare loss. See section 4.4.1 below for further description. Illness means that the work ability decreases. This results in a loss to the society corresponding to the value of the additional output that could have been produced in the absence of illness. It is necessary to distinguish between gross and net production loss. Gross production loss refers to the value of the additional output that the individual could have produced if the disease had not incurred. The net production loss deducts the consumption from the gross production loss, which corresponds to the net savings. Whether to include the gross or net production loss in the unit cost estimation depends on what is included in the other cost components (especially in the welfare loss estimate). In the present study, the approach is to include the gross production loss under illness. The reason for this is, that it is generally expected, that people to a high degree are compensated economically during the illnesses considered here, and therefore do not include production loss in their WTP. The production loss is still present however; it is just paid by either the government or private insurance companies. Section 4.4.1 below explains in further details why this seems to be the most appropriate approach in the present context. 4.4.1 Links to other cost componentsThe gross production loss can be divided into two parts: (1) the part accruing to the individual in terms of lost consumption possibilities and (2) the remaining part (called the net production loss) corresponding to loss of net saving to the economy. The loss for the society due to lost working ability corresponds to the gross production loss. Figure 4-3: Illustration of gross and net production loss
The part of the production loss reflecting loss of consumption possibilities will normally be included in the WTP estimate of the individual welfare loss, and thus should in principle not be included in the production loss estimate as well. In case of disease, people are normally compensated financially to a certain degree by the social benefits or by a health insurance. The degree of compensation differs from case to case and also among countries. If the individual is fully compensated during illness, in principle, the WTP estimate does not include part of the gross production loss. In this case, the gross production loss should be added to the WTP estimate in order to provide an estimate of the total indirect costs. If on the other hand the individual is not compensated at all, the lost consumption possibilities is expected to be included in the WTP estimate and following this the total indirect should be estimated as the WTP estimate plus the net production loss. Thus, it depends on whether loss of consumption possibilities is included in the WTP estimate or not. It is rather normal that the employed are fully compensated, meaning that salary is paid during illness, up to a certain number of sick days. After this limit the person is partially compensated by sickness benefit from the state and/or insurance. In a longer time perspective the person may loose his job and receive social security benefit or national supplementary disability pension. Thus, the person affected by sickness will normally be financially compensated to a high extent. Following this, the person will only to a limited extent experience an income decrease and therefore it is likely that the individual welfare loss estimated by WTP for avoiding the disease does not include loss of consumption possibilities. There may be differences among countries regarding the degree of compensation during illness, which is of importance in connection with benefit transfer from WTP studies from other countries. And to the extent that degree of compensation is substantially lower in countries from which benefit transfer is carried out compared to Denmark, this may result in an overestimation of the indirect costs. This aspect, however, has only a limited impact on the estimates of the direct costs in the present study and is therefore not considered further in the present analysis. To sum up, the production loss to be included is the gross production loss, unless it is expected that loss of consumption possibilities are somehow included in the WTP estimate. To avoid double counting this means that public expenditure for sickness benefit etc. is not included. It should be kept in mind, that this approach does not necessarily give an appropriate picture of the distribution of the expenditure burden. In the case of death, it is normally recommended to use the net production loss along with a WTP based statement of the individual welfare loss, since the loss of consumption possibilities will be part of the estimated value of WTP for avoiding a certain death risk. It is also in most cases assumed that the respondents in WTP surveys do not include more general losses to the society. Therefore, the net production loss should be included. It is an issue that not always have been proporly addressed in the various studies on values of a statistical life. However, to give a comprehensive assessment, it should be included.10 4.4.2 Production loss and age dependencyLike for the individual welfare loss it is an ongoing discussion whether the value of the production loss should vary with the age of the individual. The argument for such a variation is that more production is lost when the person is in the highly productive age compared to a person being at a less productive stage of its life (very young or rather old). The implication of using different values according to the age is that the health of a rather productive person will be preferred from an economic point of view over the health of an old (or a very young) person all other things being equal. Same argument could be given then in relation to men and women. Since primary income is lower for women than for men, initiatives supporting men's health should be preferred over initiatives supporting women's health, all other things being equal. This may be problematic since not-market production value such as work in the household is not included in the income values. Ethically, this may be considered as problematic, and it sometimes recommended not using such an approach. A rational argument against production loss values varying with the age is that the individual contribute to the society with his production and tax payments under the assumption that he will benefit from this not only today but also when he gets old. In the present study an average value for the production loss not related to the age of the patient will be applied, meaning that production loss contain same value no matter the age of the individual. It should be added that the production loss will be estimated for each year of the disease or each year of the remaining life time, if a chronic disease, or for each year lost in case of death. In these cases, the accumulated value of the production loss naturally will be higher the younger a person. 4.4.3 Gross production loss estimation in the present studyThe estimation of the gross production loss will be based on the approach used in "Revision af uheldsomkostninger 1998", made by COWI for the Danish Road Directorate. Here, the production loss is estimated from the "primary income". The Primary income is defined as income in terms of salary and surplus from independent business. It is distinguished from the term personal income by not including transfer income, which is not a product of business activity. The primary income is expressed as an average over the total population. Thus, the primary income concept is a measure of the average earnings taking into account the occupation frequency. In the present study it has been decided not to apply different production loss values for different age groups neither for men or women (see discussion in section 4.4.2 above). Consequently, the average production loss has been estimated, based on Statistics Denmark (2003b) The primary income reflects the yearly income. The consequences on working ability from various diseases will in many cases be expressed in terms of lost working days. Thus, the primary income figures should be expressed per working days as well. 2001 included 252 working days. This results in an average production loss of DKK 533 per working day lost. The key figures of the estimation are seen in Table 4-2 below. Table 4-2: Estimation of average production loss per day, 2001 values
4.4.4 The net production loss in the present studyThe net production loss will be used in connection with valuation of a certain death risk. The value should be based on the net saving rate of the society. Since it is likely to vary from year to year, the net saving rate is estimated as an average over three years (1999-2001). Based on figures from the National Account (Statistics Denmark, 2003b), the average net saving rate is 10.4%. This results in an estimate of the net production per lost working day, corresponding to 10.4 of the primary income, that is DKK 55 per day. With an assumption of 252 working days per year in average, the net production loss in case of death will be DKK 13,937 per year. Footnotes1 Including a correction factor for capital investments (see Møller (2000)) 2 Lifetime costs can be estimated from the prevalence based annual costs when it is assumed that the parameters describing the prevalence, incidence and treatment of the disease are constant. 3 The costs data for Medical Specialists are for 2003 as the rate for these services are adjusted every second year only. Therefore the rates for 2003 were assumed to reflect the values for 2002 also. 4 This is the usual way to make this correction, first to make the adjustment from one country (and currency) to the other country using the PPP rates and then do the inflation/deflation adjustment. It implies a small uncertainty - much les than do all other elements of benefit transfer. 5 In relation to the terminology used in EC study ExternE (Externalities on Energy), this corresponds to 'acute mortality'. 6 In a number of analyses by the European Commission, a risk premium of 50% is utilised for fatal cases, see for example: http://europa.eu.int/comm/environment/enveco/air/pah_report.pdf 7 Central parts of data foundation and documentation is found in BeTa - Benefits Table database: http://europa.eu.int/comm/environment/enveco/studies2.htm#Marginal%20external%20costs%20air%20pollution 8 See the BeTa - Benefits Table database documentation. 9 For chronic or deadly diseases assumptions about average age at the occurrence of the disease have been made. This is necessary for being able to estimate the total cost of the disease. 10 In Cost 313 (1994) there is a broad discussion on valuation methodologies concluding (page 69) that WTP estimates should be complemented with net production losses, unless this element specifically has been included by the respondents in their WTP values. 5 Asthma bronchialeThe symptoms of asthma bronchiale are repeating attacks of difficulty in breathing, coughing with phlegm or hissing breathing. The reaction can be reduced by avoiding certain substances and by taking in preventive medicine. By serious attacks the patient must seek help by the doctor or emergency room. 5.1 DefinitionAsthma bronchiale is a pulmonary disease characterized by reversible airway obstruction, airway inflammation, and increased airway responsiveness to a variety of stimuli. Asthma bronchiale is classified as J45 (Asthma bronchiale) in the ICD-10 classification of diseases. Starting age for the disease is assumed to be at the age of 40. 5.2 Chemicals associated with Asthma bronchialeFor asthma it is relevant to distinguish between the disease asthma and an asthmatic episode. It is very rare that chemicals will cause the disease asthma. Mosbech assesses that this is the case in less than 1 % of the incidences (Mosbech (2003)). Instead, chemicals are more likely to be irritants causing an asthmatic attack for people with asthma. 5.3 Disease courseTwo different disease courses are relevant for chemicals related to asthma patients.
As indicated, the former is the most relevant in relation to chemicals. In order to address, however, the need for various applications of the cost estimates, costs will be estimated for the following components:
In general, asthma treatment can be grouped in to the following categories11:
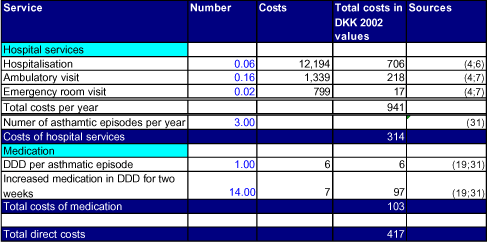
Diagnosis relates to the process of diagnosing the patient, long term management is the daily treatment for managing the disease, and acute care is treatment related to an asthmatic episode. An asthmatic episode is defined as an asthmatic episode which acquires treatment not included in the long term management; i.e. additional medication, emergency room visit, hospitalisation, etc (Mosbech (2003)). The average person with asthma will have 3 asthmatic episodes per year (Mosbech (2003)). In relation to chemicals, it is difficult to assess the number of asthmatic episodes. When the chemicals causing asthmatic episodes are removed, the person will no longer experience asthmatic episodes. Therefore, it is not possible to estimate or asses the average number of chemical induced episodes a person will experience every year. This will depend on the intensity and number of exposures during the year. 5.4 Direct costsCost per asthmatic episodeWhen a patient has an asthmatic episode, the patient will take medication to relief the symptoms and in some cases seek medical assistance. With respect to medication, the patient will typically take 1 DDD (Defined Daily Dose) of Selective beta-2-adrenceptor agonists (ATC-group R03AC) to treat the acute episode (Mosbech (2003)). In addition to this, the patient will for two weeks take double dose (2 DDD per day) of the medication used for daily treatment. Therefore, 1 DDD per day for two weeks can be attributed to the asthmatic attack. In the calculations, the costs of medication are made separately for the two kinds of medicine (Lægemiddelstyrelsen (2001);(2003)). Costs of hospitals services are based on the average use of hospital services for asthmatic patients (moderate to severe patients) within one year (Søndergaard et al. (2000)). Costs of use of GP (General Practitioner) services were not included. The use of these services could not be attributed to the asthmatic episodes per see as they were assessed to reflect routine visits only. Table 5-1 Direct costs per asthmatic episode (DKK in 2002 values)
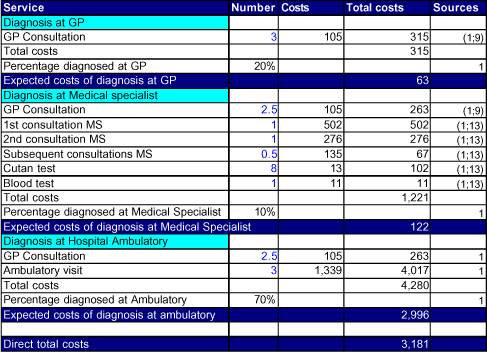
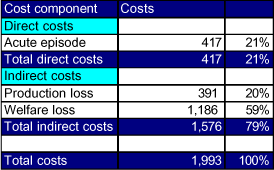
Costs of medication are public expenditures only The total direct costs of an asthmatic episode are estimated to be DKK 417 (Table 5-1). Approximately 75% of these costs reflect use of hospital services. Cost of diagnosisThe GP refer patients to either Medical Specialist or Hospital Ambulatory. The Medical Specialist seldom refers does not refer patients to Hospital Ambulatory for diagnosis (Mosbech (2003)). Table 5-2 Costs of diagnosis for asthma patients (DKK 2002 values)
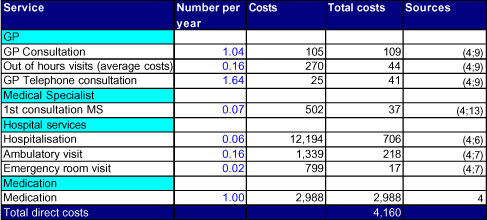
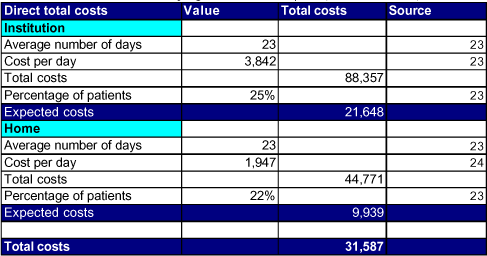
GP General Practitioner 70% of the patients are diagnosed at the Hospital ambulatory. For a patient being diagnosed at the Hospital ambulatory, total costs are DKK 4,280. Since this is the case for 70% of the patients, expected costs are DKK 2,996. When including costs of GP and Medical specialist, direct total costs of establishing the diagnosis are DKK 3,181. Costs of daily treatmentCosts of daily treatment reflect the average use of services within a year. This includes services related to asthmatic episodes, preventive medication and routine visits to GP. Table 5-3 Yearly costs of treatment for asthmatic patient (DKK 2002 values)
Costs of medication are public expenditures only Total direct costs are DKK 4,160 for one year (Table 5-3). As seen from the calculation, the most important component is costs of medication with DKK 2,988 per year. 5.5 Individual welfare lossThe welfare loss value is based on Navrud (1997/2000). In his survey the respondents were asked about their WTP for avoiding an additional day of asthma attack. The objective of Navrud (1997/2000) was to valuate the individual WTP to avoid seven light health symptoms and asthma. The method was a contingent valuation (CV) study, where 1,009 Norwegians were asked about their preferences. First, people were asked to evaluate their overall health state, and whether they could do anything to influence their own health. Then they were asked how many days they experienced having each of these seven "light" symptoms and asthma the last 12 months, how it had restricted their activities, and their private costs of having these symptoms. Next, they were presented by cards describing the symptoms and were asked to rank them. The respondents were divided into two subsamples. One was asked about the WTP to avoid one additional day having the symptoms within the next 12 months, whereas the other subsample was asked about the WTP to avoid 14 days having the symptoms. As expected, the results showed declining marginal value of a symptom day comparing the two subsamples. The average WTP per symptom day from subsample B (14 additional symptom days) was 18-32% of the value of a marginal symptom day found in subsample A. Mean values are in general higher than the corresponding median values due to the high variance in the WTP of the people asked. Whereas the median values probably accord better with most people's introspection, the mean value takes into account the people that have much higher WTP than most people e.g. because they cannot take the medicine needed etc. For the present purpose the mean values are used. For asthma, the answers were divided on people with asthma and people not having asthma. Persons with asthma were willing to pay DKK 1,297 (2002-prices) whereas person without asthma were willing to pay app. the half, DKK 625. For further description of the survey we refer to Navrud (1997/2000). The estimates were discussed with an expert of asthma (Dr. Med. Holger Mosbech), who found the estimates as well as the differences between the answers of the two categories of respondents appropriate. The reason for the relative high WTP of asthmatics compared to non-asthmatics may be that asthmatic people know about the actual inconvenience and especially the fear of death that often appear in connection with a serious asthma attack (even though very few patients die from an attack). Otterström et al. (1998) estimated the WTP of avoiding a day of asthma attack to only DKK 156 per day, which seems rather low according to the expert statement of the present study. Since chemical induced asthma attacks normally occur for asthmatic people only seems most reasonable to use the WTP from asthmatic people in the present context. Corrected for income and purchasing power, the WTP estimate used in the present context is DKK 1,186. 5.6 Production lossIn Søndergaard et al. (2000) it is estimated that the average number of days absent from work due to asthma is 2.2 days per year. Based on expert judgement it is assumed that the number of attacks per year is 3 in average. This results in 0.73 days absent from work per asthma attack. Consequently, the production loss per asthma attack will be DKK 391. This approximately means that each attack results in a day of sickness. The reason of using 0.73 day per attack and not 1 day per attack is due to the fact that some attacks will arise during non-working days. 5.7 Unit cost estimate5.7.1 Costs per asthmatic episodeThe total unit cost of an asthmatic episode is DKK 1,933. The direct costs are DKK 417 and indirect costs are DKK 1,576. Thus, the indirect costs are responsible for 79% to the total unit costs. Table 5-4 Total costs per asthmatic episode (DKK 2002 values)
5.7.2 Lifetime costsIn order to illustrate potential costs over a number of years, lifetime costs for a person who acquire chemical induced asthma are estimated (Table 5-5). The example is made for a at 40 years old person acquiring asthma and assuming 3 asthmatic episodes per year. Table 5-5 Lifetime costs of asthma (DKK 2002 values)
Age of onset is 40 Total lifetime costs of asthma are DKK 201,886 (3% discount rate). Direct and indirect costs are responsible for approximately half of the total costs respectively. Footnotes11 The probability of dying from asthma is very low and is omitted in the following calculations According to EPA in the US, the annual probability of dying from asthma is 0,0004 (EPA (2000)). 6 HeadacheHeadache is a common symptom, often associated with disability, but rarely life threatening. When a new headache occurs for the first time in close temporal relation to chemical exposure, it is coded as (secondary) headache attributed to the chemical (The International Classification of Headache Disorders (ICHD-II) (2003)). Headache may be acute or chronic. When exposure to a substance ceases but headache does not resolve or markedly improve after 3 months, a diagnosis of chronic post-substance exposure headache is considered. However, such headaches have not been documented in relation to chemicals and is therefore only for research purposes (ICHD-II (2003)). Hence, the headache considered in this section is acute headache induced by acute substance use or exposure. 6.1 DefinitionThe headache analysed in this section is defined as headache induced by acute substance use or exposure. This diagnosis is classified as 8.1 in ICHD-II (2003). For the present purpose, each episode is defined as " Two painful and splitting headaches during the day. Each period of headache will last two hours" (Navrud (1997). Operationalisation of this definition is made in Table 6-1 below. Table 6-1 Definition and operationalisation of acute headahce
* Navrud (1997) In is assumed that the patient is taking 2 DDD of analgesics and has 50% reduction in work ability during one episode of headache. 6.2 Chemicals associated with HeadacheThe following categories of chemicals are often mentioned to cause headache12:
Other type of chemicals may also cause headache depending on the intensity and length of time of exposure. 6.3 Disease courseThe patient may experience one or more episodes. It is not likely that the patient will seek medical assistance when having a few acute episodes of headache (Olesen, J. (2003)). In this situation, the patient may take analgesics to relief the headache. However, with multiple episodes of acute headache, it is likely that the patient will seek medical assistance and have a proper diagnosis established. In order to illustrate the costs in the two situations, the following cost estimates are provided:
6.4 Direct health care costsCosts of an acute episodeDirect costs of an acute episode of headache consist of drug costs only. It is assumed that the patient will take 2 DDD of mild analgesics, e.g. (paracetamol) in relation to an acute episode. The costs are estimated to be DKK 1.30 (2*0.65 =1.30). The costs of 10 acute episodes are calculated strait forward as 10*1.30 = DKK 13. Table 6-2 Direct costs per acute episode of headache (DKK 2002 values)
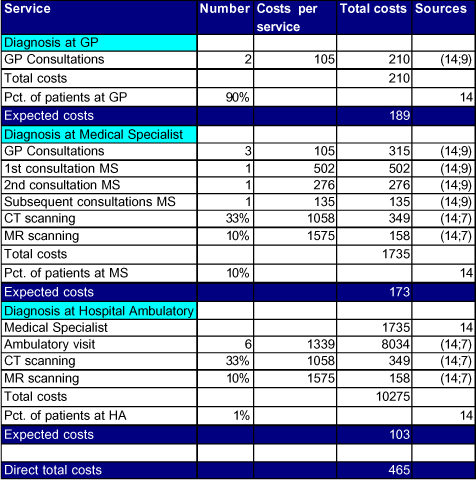
Costs are public costs only as the patient's co-payment is included in the indirect costs Cost of establishing the diagnosisIn Table 6-3 an overview of health care resources in relation to establishing a diagnosis is given. Most of these patients will be treated by the general practitioner (GP), and only very few patients will be further referred to Medical Specialist and Hospital Ambulatory. The distribution of patients among GP, Medical Specialist and Hospital Ambulatory is based on expert assessment by Jes Olesen (Olesen, J. (2003)). 90% of the patients will have 2 consultations at the GP only. The costs of two consultations at the GP are DKK 210. As 90% of the patients are treated at the GP only, the expected costs for the average patients are DKK 189 (0.9 *210 =189). The 10% of the patients being referred to the Medical Specialist has had 3 consultations at the GP before referral. At the Medical Specialist they will have 3 consultations. 33% will have a CT scanning and 10% will have a MR scanning. Total costs for patients diagnosed at the Medical Specialist are DKK 1735. As this is only 10% of the patients, the expected average costs are DKK 173. 1% of the patients will be further treated at the Hospital Ambulatory. Total costs for these patients are DKK 10.275 resulting in expected average costs of DKK 103. Total expected costs of establishing the diagnosis are therefore DKK 465 when expected costs for each category are added together. Table 6-3 Costs of establishing diagnosis for severe headache (DKK 2002 values)
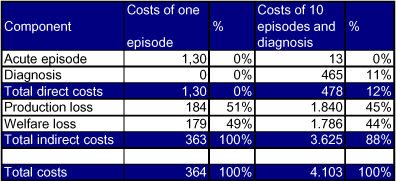
Expected costs Total costs multiplied by the percentage of patients receiving the service 6.5 Individual welfare LossThe Definition of a day with moderate headache used in the present study is taken from the valuation study reported in Navrud (1997/2000), which will be used in the present context to estimate the welfare loss by benefit transfer. The CV survey is described in chapter 5.5 of the present report. The value per day of headache when 14 days are considered is about one third of the value on one day of headache. In the present study the value on one additional day is used, due to the present definition of an episode. The estimated value of avoiding an additional symptom day is DKK 195 (2002-prices). Purchasing power corrected per capita income level in 1997 was 9.4% higher in Norway that Denmark, resulting in a corrected estimate of DKK 179 per day. 6.6 Production lossIt has not been possible to get accurate data on the extent of absence from work due to moderate headache. For the present purpose it is assumed that a moderate headache in average leads to a degree of absence from work of 35%. This corresponds to a 50% reduction in the individuals work ability during an episode of moderate headache taken into account that appr. 70% of the episodes will appear on non-working days. This results in an average production loss of DKK 184 per episode. 6.7 Unit cost estimateThe total unit cost has been estimated for an episode of acute headache supplemented by an example of a scenario of 10 repeating headaches, including diagnosis settlement. The result is seen in Table 6-4 below. Table 6-4 Total unit cost of one and 10 episodes of acute headache (DKK 2002 values)
All episodes and diagnosis are within one year The total unit cost of one episode is estimated to DKK 364. It is apparent that the indirect costs are the most important component is the total costs of headache. For costs of one episode, the direct costs amounts less than 0.4% of the total costs. The production loss is the most important cost element contributing with app. 51% of the total costs followed by the welfare loss amounting 49%. Estimated cost of the defined scenario of 10 episodes including diagnosis is DKK 4,103. The direct costs now amount app. 11% of the costs, whereas the individual welfare loss and the production loss contribute with 44% and 45% respectively. In relation to the welfare loss in the scenario calculation one issue should be noted. As the WTP survey (Navrud, 1997) showed, the average WTP per headache day seems to be dependent on the total duration. Likewise, it is likely that the WTP per episode changes with the total number of episodes experienced within a certain period. The WTP survey pointed in the direction of decreasing WTP along with the increase of days of duration, which may also be the case for the defined scenario. On the other hand, since the cause in defined scenario is assumed to result in a need of diagnosis settlement it may give rise to increase worries and this increase the individual WTP. Following this, the WTP for one episode of headache during one day is used in the scenario estimation as well. Footnotes12 EPA US Enviromental Agency (1995). http://immuneweb.org/articles/fabricsoftener.html 7 Contact AllergyContact allergy is caused by small chemicals that penetrate the skin. By doing this the chemicals can induce allergy. The process of inducing allergy is called sensitisation and is without clinical symptoms. Once a person has become sensitized re-exposure to the allergen can cause allergic eczema. Allergic eczema is characterised by erythema, oedema, and the skin can become dry, shift and fissures develops. 7.1 DefinitionContact allergy is defined as acute or chronic inflammation produced by substances contacting the skin and causing allergic reactions. The contact allergy analysed in this section is classified as L23 (Dermatitis contactus allergica) in the ICD-10 classification of diseases. Starting age for contact allergy is assumed to be at the age of 40. 7.2 Chemicals associated with contact allergyContact allergy from chemicals may arise in connection with private use as well as part of the working environment. Product groups containing chemicals with risk of contact allergy are:
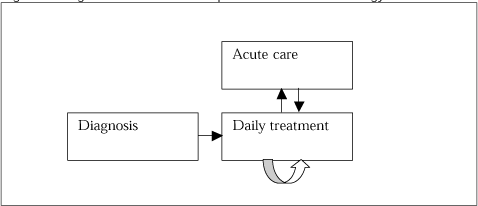
The most frequent cause of contact allergy is the metal - nickel. Second to this, perfumes and preservatives. It is not possible to be cured from contact allergy. However, it is possible to some extent to remove the allergen. By doing this, the patient can be cured from having allergic reacting. However, the patient will have recurrence of the symptoms when exposed to the allergen again. 7.3 Disease courseThe disease course is divided into the following disease states: Diagnosis, Daily treatment and Acute care. The purpose is to have well defined disease states where cost of treatment can be estimated within each disease state. Diagnosis is the state where the patient is having allergic reactions and the diagnosis is in the process of being settled. Daily treatment with contact allergy is the every day coping with contact allergy. This may include daily treatment with topical agents, moistures and avoidance of certain chemicals. This treatment is opposed to Acute care. Acute care is when the patient is having an allergic reaction which requires specific treatment that is not included in the long term management of the disease; i.e. additional treatment due to an acute allergic reaction. Once the patient is allergic toward one substance, it increases the likelihood of becoming allergic towards other substances. Figure 7-1 Diagnosis and treatment of patients with contact allergy
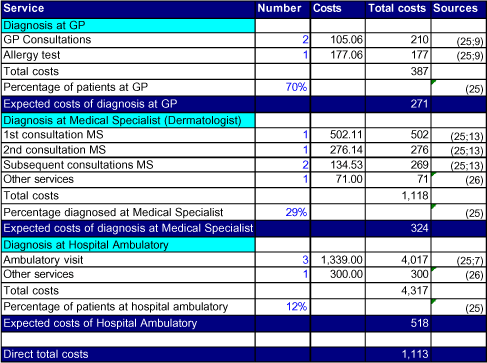
Diagnosis The patient is diagnosed as having contact allergy due to chemicals Once a person has acquired contact allergy, the person will have it for the rest of the life (Duus and Menné (2003)). It is known that one type of contact allergy increases the likelihood of becoming allergic towards other substances (Duus and Menné (2003)). This is taken into account as costs of multi-allergy are included in the average cost estimates. 7.4 Direct health care costsDirect health care costs are estimated for establishing the diagnosis and daily living with contact allergy. Costs of acute care are included in the costs of daily treatment as separate data for acute care and daily living are not available. DiagnosisDiagnosis includes all activities related to diagnosing the patient. This is done at the GP, Medical Specialist or at hospital ambulatory. Direct total costs of establishing the diagnosis are estimated to be DKK 1,113 (Table 7-1). Table 7-1 Direct total cost of establishing diagnosis for a patient with contact allergy (DKK 2002 values)
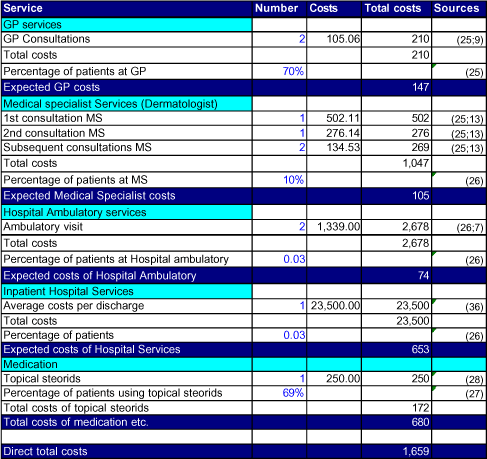
GP General Practitioner Daily treatment for contact allergyDaily treatment for contact allergy includes all activities related to managing the disease when the diagnosis is settled. This is the daily routine treatment of the disease. This include medication, routine visits to GP, Medical specialists, Ambulatory services, Hospital services, etc. Treatment related to acute care is included in this category also. Estimated yearly costs of treatment are DKK 1,659 (Table 7-2). The major contributors to these costs are hospitals services and medication. Table 7-2 Direct total cost of yearly treatment for a patient with contact allergy (DKK 2002 values)
GP: General Practitioner 7.5 Individual welfare lossEstimates of WTP for avoiding contact allergy have not been found. In RPA(2003) an estimate of one additional day with skin disease is provided. This is based on the lowest value of the estimates in Navrud (1997), which is DKK 109, without any clear reason for this. As an alternative, it has been chosen to estimate the WTP from estimations of WTP of a "symptom day", defined as "one day with mildly, red watering, itchy eyes and runny nose". The value is from a very extensive European morbidity valuation study. The study is often referred to as the 5-country study (CSERGE et. al., 1999 referred in Rainer and Bickel, 2001) and has been the basis for a number of values in Extern E and BeTa. The survey CV study valuing 6 morbidity episodes in the Netherlands, Norway, Portugal, Spain and the UK and arrogated to values for a pool of the 5 countries. The morbidity episodes were all related to air pollution, but the survey was carried out in a context free mode, i.e. by seeking WTP for changes in given health effects only. The basic idea is that context free WTP provides a core value that might be transferred to other areas. In the survey, a "symptom day" is about 83 DKK in 2002-prices. Corrected for income and purchasing power differences this corresponds to DKK 100. Even though it is problematic to use this estimate in the present context it is found to be the best possibility available at this stage. The number of symptom days varies greatly from patient to patient. Here, it is assumed that symptoms will be present approximately 20% of the time, resulting in an estimate of DKK 7,315 per year. It is implicitly assumed that the WTP per symptom day is constant independent of the number of symptom days. There is no basis for determine how the value will depend on the number of days. There could for example be threshold limits partly or fully offsetting the effect of the "standard" assumption of declining marginal WTP values. It can be discussed whether the private medical expenditures should be added or not. Since the WTP estimate is taken from another context, the medical expenditures connected with contact allergy will not be present in this estimate. On the other hand, the estimate may include private expenditures for other kinds of medicine. Since medical expenses of a symptom day as defined in the original WTP study are likely to be rather limited, it seems most reasonable to add private medical expenses to the WTP estimate. Based on information from Department of Dermatology in Denmark, it is estimated that each patient in average has additional expenses on lotion corresponding to DKK 200 per month. Furthermore, topical steroids may be used. The average private expenses in this relation is estimated to app. DKK 250 per year In addition to this, some patients may have expenses for special gloves, but this is left out in the present study. In total, this results in private expenses of DKK 2,650 per year In total, the individual welfare loss amounts DKK 9,965 per year. 7.6 Production lossIn Flyvholm and Burr (2001) the absence from work due to contact allergy is estimated to 1.6 day per year in average. According to Department of Dermatology, Gentofte University Hospital in Denmark it is likely to be to low, but in absence of better documented data, it was recommend using this estimate. 1.6 days per year results in a production loss value of DKK 853 per year. 7.7 Unit cost estimateThe total results of the unit cost estimation are seen in Table 7-3 below. At a discount rate of 3% the total lifetime cost is DKK 291,288 per patient. The main cost element is the welfare loss, counting for 79% of the value. Table 7-3 Unit cost estimate for contact allergy, lifetime cost per patient (DKK 2002 values)
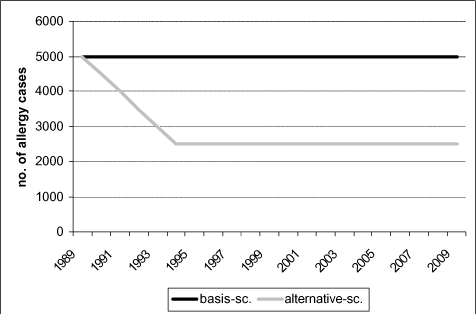
Starting age for contact allergy: 40 years old The unit cost may seem rather high. This is to a large extent due to the fact that the disease is chronic, and following this, costs will arise each year of the remaining lifetime from the day of diagnosis settlement. The welfare loss expresses the individual's willingness to pay to avoid the disease. Another way to look at this is the compensation paid by insurance companies to individuals with work related eczemas. The average compensation per person with work related eczema is DKK 66,976 (2002 value) (Sundhedsstyrelsen 2001). The costs of compensation are rather small compared to the value of the individual welfare loss which is DKK 230,864 (3% discount rate). One explanation for this deviation is that insurance companies do only pay compensation for damages which can be documented. Therefore, the individual WTP in practice is likely to be higher than the compensation paid by the insurance companies. When costs of compensation are added to the direct health care costs, the total lifetime costs per person are 107,648, when using a 3% discount rate. This amount expresses the costs directly paid by the society. In the section below, an example of how the unit cost estimate may be used in economic assessment is given by performing a, mainly illustrative, calculation of health benefit related to the policy initiative on Nickel in 1989. 7.8 Example of unit cost application: Nickel AllergyThis section is intended to give an illustrative example of how the estimated unit cost values may be used in an economic assessment of a chemical policy initiative. In the following, we illustrate how an economic assessment of the health benefits following the policy initiative could have been carried out using the unit cost estimate developed in the present project. Although, the example is carried out first of all with the purpose of illustrating the applicability of using the estimated unit health benefit values, the example is based on what can be seen as the best available empirical basis. In this way, the example also illustrates the difficulties and uncertainties of making policy analyses that includes benefit assessments. The data regarding the number of nickel cases are to be seen as guesstimates. The difficulty of establishing the impact pathway and quantifying the number of diseases is often the main constraint on the quality of benefit assessment. It is also the case here that such knowledge is not present. Thus, the data used here are very uncertain, although the order of magnitude is believed to be realistic. Nickel is the most frequent cause of contact allergy. Scandinavian surveys from the 1980's showed that approximately 20% of all women were allergic to nickel. In order to reduce this negative health effect, a statutory order limiting the permitted release of nickel from metal objects intended for close contact with the skin such as earrings, spectacle frames and buttons came into force in Denmark in 1989 (and followed by a revision in 1991). 7.8.1 Scenario definitionFirst, the policy initiative must be carefully defined along with a definition of the baseline of the assessment, which in most cases refers to the situation if the initiative had not been realised. The policy initiative, reflected in the alternative scenario, is a situation where the statutory order on Nickel is implemented and complied with from 1989 and each year from this date. The base line is defined as the situation without the statutory order. Here, it is assumed that nickel will be used in the same amount as before 1989 during each year from that date. In reality the time horizon of the calculation should be infinite. Due to the discounting of future effects, however, effects arising far in the future have relatively little importance for the total result. Furthermore, effects arising far in the future are subject to relative high uncertainty. For these reasons, therefore, the time horizon of the present case calculation has been set to 20 years. 7.8.2 Mapping of impactsThe assumptions regarding development of number of nickel allergy cases under basis and alternative scenario are based on information from Department of Dermatology, combined with rough assumption made by the consultant for this purpose. On the benefit side the effect of the initiative was expected to be fewer cases of nickel allergy. In baseline, approximately 5,000 new cases of nickel allergy are assumed to be expected yearly. For simplicity is assumed that this number would be constant over the entire time horizon In the alternative scenario it is assumed that the number of cases decreases with 50%, resulting 2,500 avoided cases of nickel allergy yearly. The full effect of the statutory order, however, is not expected to be seen before a number of years, 5 years assumed here, meaning that the full effect is seen from 1994. The development in number of cases of nickel allergy under basis and alternative scenario is seen in Figure 7-2 below13. Figure 7-2: Assumed development in no. of allergy cases under basis and alt. scenario
7.8.3 Valuation of impactsThe health benefits are valued by the unit cost estimated in the present project. The estimated unit value of DKK 291,288 includes lifetime costs for the average patient. The benefits each year using a discount rate of 3% is seen in Table 7-4 below. Table 7-4: NPV of health benefits from reducing use of nickel, million DKK, 2002 prices
Adding the annual benefit from avoided allergy cases over the time horizon of 20 years results in a net total present value (NPV) of DKK 9.7 billion. Along with this assessment, a sensitivity analyses should be carried out. In Table 7-5 the total assessment result is seen for low, best and high unit cost estimate. The assumption behind the estimates for the low and the high unit cost is given in section 10.2.2. Table 7-5: Low and high NPV of health benefits, M. DKK, 2002-prices
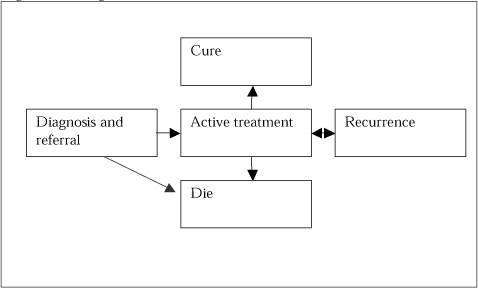
The assessment thus shows that the total benefits following the policy initiative are within the range of m. DKK 2,700 and 22,900. As the number of avoided cases of nickel allergy is also subject to significant uncertainty, the total range of values could be wider than indicated in the table. However, if the range of uncertainty for the number of avoided cases is not much higher than a factor of 2 to 3 and the uncertainty in estimating the number of cases is independent of the uncertainty of the unit cost estimates, then the total range of expected benefits is not much different from the range illustrated in Table 7-5. The example shows the usefulness of having unit costs per disease. Undertaking cost-benefit analysis of new policy proposals require that the whole impact pathways can be described and the final effects in terms of a number of reduced diseases can be quantified. In the example such estimation was possible, although highly uncertain. In order cases, the unit costs can be use to perform a backward calculation. If the cost of a new regulation is known, then the number of cases of the disease that has to be avoided for the benefit to excess costs can be estimated. Footnotes13 This development pattern is based on expert judgement but including rough assumptions made by the consultant for the present purpose. 8 Lung cancerLung cancer is defined as a malignancy within the lungs and may be localized or has spread to multiple sites (Bennet and Plum (1996)). 8.1 DefinitionThe lung cancers analysed in this section are classified as C33-C34 in the ICD-10 classification of diseases. Following this classification, the definition of lung cancer also includes tracheal cancer, a rare type of cancer. 8.2 Chemicals associated with Lung CancerThe far predominant cause of lung cancer is smoking. However, a number of chemicals are known or suspected to cause lung cancer as well (COI Handbook (2002)). EPA has developed a list of chemicals known or suspected to cause lung cancer. Most chemicals were carcinogenic in animal studies. These studies do not provide organ-specific data because it is not generally assumed that cancer induction will necessary occur at the site in humans as in animals (COI Handbook (2002))14. Hence, it is difficult to determine specific chemicals with specific types of cancer. However in Denmark, Arbejdsmiljøfonden has assessed the cancer evidence in related to chemicals (Hansen et al. (1998)). The overall conclusions in relation to lung cancer were that, there was a significant increased risk of lung cancer for epichlorhydrin and chlorinated paraffins. 8.3 Disease courseThe disease course of lung cancer is illustrated in Figure 8-1. Treatment of lung cancer can be divided into the following states: Referral and Diagnosis, Active treatment, Cure, Recurrence and Death.15 Figure 8-1 Lung cancer disease course
Referral and Diagnosis: Referral from general practitioner and activities related to diagnosis of the patient The treatment depends on the type of lung cancer, the patient's ability to receive the different kind of therapy, and on the stage of the disease. In order to estimate the lifetime costs it is necessary to provide data regarding the probabilities of moving from one stage to another. Here, this is done by utilising a Markov model. See section 4.2.1 for a further description. The Markov model for lung cancer is divided in three states:
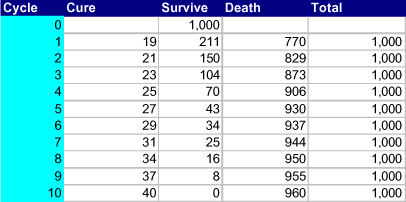
The utilised Markov model is a so called time dependent model where the transition probabilities vary over time. The state Survive is the state where a person has been diagnosed as having lung cancer but is neither dead nor cured. This state includes cost of diagnosis, referral, active treatment and recurrence. In the state Death, the person is dead from lung cancer. This state includes treatment costs the year in which the person dies. In the state Cure the person is cured from lung cancer. The states Death and Cure are absorbing states (i.e. when a person has entered the state, it is not possible to leave). Transition probabilities are derived from relative survival data for Danish people with lung cancer (Storm and Engholm (2002)). The relative survival data can be interpreted as the excess mortality from lung cancer. The available data cover relative survival for 1, 5 and 10 years following the diagnosis. The relative survival for these years is 23, 7 and 4 % respectively. As relative survival data beyond the 10th years were not available, and the impact of extending the model beyond this point is marginal, the simulation was done for 10 years. The 4 % being alive after 10 years are assumed to be cured. The probability of moving from Survive to Death is taken directly from the relative survival data. The probability of moving from Survive to Cure is modelled from the 4% being alive after 10 years. The resulting Markov simulation of the cohort is shown in Table 8-1. After 10 years 4% are Cured (40/1000=0.04) and 96% are in the state Death (960/1000 = 0.96). Table 8-1 Time dependent markov cohort simulation of lung cancer survival
Cycle A cycle has the length of one year The expected costs are obtained by assigning costs to each person in each state, and then summing over all persons over the 10 year simulation period and dividing by the total cohort number. It is assumed that the persons cured and dying are entering these states uniformly over the year, meaning that they enter the states after 6 months in average. To the extent possible this is taken into account in the estimation of the costs. 8.4 Direct health care costsDirect lifetime costs are estimated from a large scale register study by (Gundgaard et al. (2002)). The advantage of register data is that they reflect actual use of resources. Therefore, the lifetime costs of lung cancer will be estimated from these data complemented with cost estimates for other services not included in this study. Cost of hospital and primary careThe costs estimates from Gundgaard et al. (2002) cover hospital and primary care services. The study is based on a 20% sample of the Danish population. Data on use of health care resources were retrieved from the Prevention Register at Statistics Denmark, the Cancer Register and combined through the unique personal identification number. The costs are estimated by following patients with the diagnosis ICD-10 C33-C34 during the years 1996 and 1997. These cost data reflect average costs of a person with lung cancer. Hence, also costs not related to the lung cancer per see are also included. Incremental costs due to lung cancer were estimated by subtracting average costs per person not having lung cancer from these values. The cost data include the following health care resources: In-patient hospital services, and out-patient hospital services (ambulatory visits, emergency room visits). Costs were estimated using the 1997 version of the Danish DRG-system. Costs of primary health care services coved through the health care reimbursement scheme were also included. Costs for 10 years following the diagnosis were estimated from cross sectional data. Combining these costs estimates with Danish relative survival rates in the Markov model expected costs for a person with lung cancer were estimated. Total expected costs hospital and primary care services are DKK 113,840 3% discount rate. There is not much difference whether 3 or 6% discount rates are used as most of the costs falls within the first years. Table 8-2 Total direct costs over 10 years (DKK 2002 values)
Results based on Markov simulation. The costs estimate for hospital services is higher than the estimate recently used by the Environmental Assessment Institute (DKK 66,000 in 2002 value) (Petersen et al. (2003)). The source for this estimate is Rasmussen et al. (2000). In their study only costs which can be directly attributed to smoking are included. The cost estimate in this report is based on Gundgaard et al. (2002) which include all costs for patients with the main diagnoses C43 and C44 irrespective whether the reason is smoking or another. Therefore, the scope of the analysis by Gundgaard et al. (2002) is broader and hence, yields a higher cost estimate per person. In addition to this, the study by Gundgaard et al. (2002) uses a later version of the DRG-system as well as the registration of ambulatory services has improved since the study by Rasmussen et al. (2000). Cost of terminal careCosts of terminal care outside the hospitals were not included in the study by Gundgaard et al. (2002). Costs of terminal care were estimated using data from the report concerning palliative efforts in counties and municipalities in Denmark (Amtsrådsforeningen et al. (2000)). According to this report, 49.7% of the patients die at the hospital. Costs of these patients are included in the costs estimates by Gundgaard et al. (2002). However, 24.5% die at nursing homes or other institutions, 22.2% at home and 3.6% at other places are not included. It is possible to estimate costs for those who die at home or at nursing homes. The 3.6% dying elsewhere are omitted in the calculations. Table 8-3 Direct total costs of dying outside the hospital (DKK 2002 values)
Institution includes nursing homes, hospices and other institutions The total costs of Terminal care are DKK 31,587 for a person dying outside the hospitals. When multiplying this cost estimate with the probability of dying, we can calculate the expected discounted costs of dying at institutions and at home. The total expected direct costs of lung cancer are DKK 143,685 using 3 % discount rate (Table 8-4). Costs of terminal care in Table 8-4 do not correspond exactly to costs of terminal care in Table 8-3. The reason for this is that, the estimations in Table 8-4 are based on the Markov simulation where 4% of the patients survive. Therefore, the cost estimate in Table 8-4 is slightly lower. Table 8-4 Total direct costs of lung cancer (DKK 2002 values)
Results based on Markov simulation. 8.5 Individual welfare LossIn the estimation of the welfare loss we distinguish between people that are cured and people that eventually die from lung cancer. Of main importance is the welfare loss of lung cancer death. This is estimated by the value of a statistic life of DKK 9.64 million., presented in section 4.3.8. In the case of people that are cured from the cancer, there is very limited empircal evidence on WTP estimates for non-fatal cancers. It is obviously lower than the WTP for the fatal cases, but probable also not insignificant, as the patient will not know the deasise cource in advance. In an EU study on air pollution, a value of 50% of the WTP for fatal cancers have been used16. They emphisize the high level of uncertainty attached to this value. The choice of a value for the WTP for the non-fatal lung cancers is quite limited an the total result. A value of 50 % of the WTP for a statisitical life amounts to less than 2% of the total direct and indirect costs. Although, there is limited evidence regarding this aspect, it is still an element that should be included. Thus, the value of 50% is used. The total welfare loss of lung-cancer must be a weighted average of the estimate of non-fatal lung cancer and cancer death respectively. This is estimated to be DKK 9.4 million. (at a discount factor of 3%), taken into account the average duration of the disease for person cured and the time of appearance of the death. It should be mentioned that the estimate of non-fatal lung cancer is subject to a high degree of uncertainty. As seen above, however, it does only to a limited extent affect the weighted average of lung cancer welfare loss estimate. 8.6 Production lossNo information on the absence from work in connection with lung cancer has been found in the literature. For the present purpose it is assumed that a patient that is cured during a certain year will be absent 50% of the day during the period of illness, which is 6 months in average. Following this, he will be absent 25% of the year, during which he is cured. Survivors likewise are assumed to be absent 50% of the time, and the period of illness lasts the whole year. For people dying within a certain year it is assumed that they are 100% absent from work. Since gross production loss should only be included until the day of death, it is taken into account, that people in average live 6 months within the year of death. Besides this, the net production loss due to mortality must be included. A person dying implies a net production loss to the society during the expected life time remaining in case of no lung cancer. For the present purpose it is assumed that the average age of patient achieving the diagnosis of lung cancer (in year 1) is 50 years. According to Statistics Denmark (2003a) the expected remaining life time at this age is 29 years. Thus, each patient that eventually dies will result in a net production loss from the day of death (in average after 6 months within the year of death) until the day he would have turned 79 years. The average production loss per case of lung cancer is estimated to DKK 253,616. 8.7 Unit cost estimateThe total result of the unit cost estimation of lung cancer is seen in Table 8-5 below. Table 8-5: Total unit cost estimate for lung cancer (DKK 2002 values)
At a discount rate of 3% the unit cost is DKK 9,683,411. The individual welfare loss contributes with no less than 95.9% of the cost, being far the most important cost element. This is mainly due to the high mortality risk of lung cancer along with the relatively high value of a statistical life used for valuation. It is further seen that choice of discount factor does not change the result very much, mainly do to the fact that the average remaining lifetime at the time of diagnosis settlement is rather low (during the first year no less than 77% of the patients die) and following this most cost will fall within the first year. Footnotes14 The entire list of chemicals known or suspected to cause lung cancer is available at http://www.epa.gov/oppt/coi/toc.html. See Chapter II.5. 15 Based on Olivier et al. (2001), Behandling af lungkræft (Kræftens Bekæmpelse (2003a)), and Braud et al. (2001). 16 AEA Technology (2001), page 71-72. 9 Skin cancerSkin cancer is defined as a malignant melanocytic tumor arising in the skin. Often skin cancer is divided into two main groups. (1) Non-melanoma and (2) melanoma skin cancer known as 'birthmark cancer'. Whereas no relation between chemicals and non-melanoma skin cancer exists, certain types of chemicals may induce non-melanoma skin cancer. Therefore the focus here will be on non-melanoma skin cancer17. The two main cancer groups within non-melanoma skin cancer are basal cell carcinoma and squamous cell carcinoma. The latter also called spinocelluaire carcinoma. US data shows that Squamous cell carcinoma is responsible for 20% of the non-melanoma skin cancer cases, and basal cell carcinoma is responsible for approximately 75% of the cases (Chen et al. (2001)). The remaining 5% are other types of non-melanoma skin cancers. The incidence of non-melanoma skin cancer in Denmark is increasing (Sundhedsstyrelsen 2003a; 2003b). Chemicals can induce squamous cell carcinoma. The available clinical data do not distinguish between the different types of non melanoma skin cancers (Sundhedsstyrelsen 2003a; 2003b). The reason for this is that registration of cancers is based on the ICD10. It is only registered whether the cancer is melanoma or non-melanoma and where it is located. This can be the reason why the international literature on costs of non-melanoma cancers is not segmented according to variety (e.g. Housman et al. (2003); Chen et al. (2001))). Furthermore, the literature on chemicals related to non-melanoma skin cancer is not segmented according to variety either (e.g. EU Commission (2003); Hansen et al. (1998)). Therefore, the costs estimations are made for the general group 'non-melanoma skin cancer'. 9.1 DefinitionNon-melanoma skin cancer is defined as C44 (Non-melanoma skin cancer) ICD-10 classification of diseases. It is assumed that all patients are treated within one year and that non-melanoma is not fatal. Even though a number of patients are likely to die from the non-melanoma skin cancer, Danish data on survival for non-melanoma skin cancer show a higher relative survival probability than the background population (Storm and Engholm (2002)). Therefore, fatality is not included in the analysis. 9.2 Chemicals associated with Skin CancerThe far most important reason for skin cancer in general is UV radiation of the skin from the sun. In relation to chemicals, there is no clinical evidence showing a direct relation between skin cancer and chemicals. However, animal studies and observational human studies indicate that exposure to certain chemicals, such as coal tar pitch, mineral oil, and creosote increases the relative risk of skin cancer (Merck (1998); Andersen et al. (1994)). 9.3 Direct health care costsEstimation of direct health care costs are based partly on the incidence based approach and partly on the prevalence based approach. Costs for hospital services are based on the prevalence approach where as costs for primary care services are based on the incidence approach. According to Drzewiecki (2003), 30% of the patients are treated in the primary care sector only. 70% of the patients are visited in the primary care sector and referred to treatment in the secondary sector (hospital sector). Costs for patients treated in the hospital sectorCosts of hospital services are estimated from the average number of discharges for inpatient and outpatient hospital services (Table 9-1). Table 9-1 Total treatment costs for patients with non-melanoma skin cancer treated in the hospital sector (DKK 2002 values)
Sources The first number refers to the source for the number of services or percentage. The second number refers to the source for the cost per service. See appendix 1 with list of sources for the calculations. Before a patient is referred to a hospital, the patient will on average have one consultation at the GP and one at the MS. Total costs of hospital services are approximately DKK 85 millions. The costs per person are found by dividing total hospital costs with the incidence for non-melanoma skin cancer. Hence, of the persons admitted to the hospitals, the costs per person are approximately DKK 15,000. Total expected costs are found by multiplying total costs with the percentage of patients referred to hospitals. Hence, total expected costs for persons treated at hospitals are 10,991 per person. Costs of treating a person in the primary care sector are estimated using expert input as no data regarding use of these services are available (Table 9-2). Table 9-2 Total direct costs for patients with non-melanoma skin cancer treated in the primary care sector (DKK 2002 values)
Sources The first number refers to source for the number of services. The second number refers to source for the costs per service. See appendix 1 with list of sources for the calculations. 15% of the patients treated in the primary care sector are treated at the GP whereas 85% are treated at the MS (Drzewiecki (2003)). In both cases, the patient will have 6 follow-up visits over the following 3 years. Using a discount rate of 3%, the costs of 6 follow-up visits are DKK 594 and 2,841 for GP and MS respectively. Furthermore, 1/6 of the patients will have recurrence of the non-melanoma skin cancer (Drzewiecki (2003)). Recurrence is assumed on average to take place in the second year following the diagnosis. Using a discount rate of 3%, costs of recurrence are estimated to be DKK 606 ((1/6 * 2,841)/1.032). Total costs for patients treated in the primary care sector are DKK 3,795. Hence, expected costs are DKK 1,179 when taking into account that this is only 30% of the patients. Total direct costs are estimated by adding costs of primary and hospital services together (Table 9-3). Table 9-3 Total direct costs per person with non-melanoma skin cancer (DKK 2002 values)
Total expected costs per person are estimated to be approximately DKK 12,000. 9.4 Individual welfare lossCompared to other types of cancer many cases of non-fatal skin cancer are relatively easily cured without to much pain and suffering for the patient. Furthermore the average duration of the disease course is relatively short (less than one year). One of the elements to be included in the individual welfare loss of skin cancer is the risk of permanent scars. According to Drzewiecki (2003) app. 70% of all inpatient treatments results in permanent scars. It is estimated that 70-75% of the cases appear in the face/neck and following this, scars will be difficult to cover. Only very few studies on the WTP to avoid skin cancer are available. This include following as best options for benefit transfer:
9.5 Production lossNo statistics on the degree of absence due to skin cancer is available. Based on data on the number of various treatments combined with expert judgement (Drzewiecki (2003)), the number of days of sickness following Skin cancer has been estimated as seen in Table 9-4 below. Table 9-4: number of days lost per skin cancer patient
The number on lost days of production is a result of following data and assumptions: Each inpatient hospital service of 4.5 days in average, and the incidence of hospitalization in connection with skin cancer is 23.7%. In addition to this it is assumed that each hospitalization is followed by a period of illness of 14 days in average ((Drzewiecki (2003)). It is further assumed that all days of illness may fall on working days as well as non-working days, except for one day of hositalization, namely the day of operation, which will always fall on a working day. Each patient receives outpatient hospital services 3.9 times in average. In average, one of these times is assumed to include operation. Each outpatient operation is assumed to result in additional 4 days of illness at home ((Drzewiecki (2003)). Each time of outpatient hospital service is assumed to result in a day absence from work. The 4 additional days may fall on working as well as non-working days. Each patient has 9 visits at the GP in average. It is here assumed to result in 3 days of absence from work. With a production loss value of DKK 533 per day the average production loss value is DKK 6,625 per skin cancer patient. 9.6 Unit cost estimateThe total unit cost estimate is seen in Table 9-5 below. The total unit cost of skin cancer is DKK249,424. Again, the welfare loss is seen to be the far most important cost element contributing with 92% of the total costs. However, as described above, the estimation of the individual welfare loss is very uncertain, which makes the total unit cost estimate very uncertain as well. Table 9-5: Unit cost estimate, non-melanoma skin cancer, DKK, 2002-prices
Primary care sector are costs for those patients only treated in the primary sector Footnotes17 Indirectly, chemicals reducing the ozone layer may cause both types of skin cancer through increased UV radiation of the skin. 10 Unit costs - summary of resultsThis chapter summarises and discusses the estimates that have been developed through chapter 3-7. Furthermore, the aim is to set up low and high unit cost estimates for each disease based on the discovered uncertainties. 10.1 Summary of resultsTable 10-1below summarises the results from the estimations in chapter 3 to 7. The relative distribution of the costs is seen in Table 10-1: Summary of unit cost estimates, DKK, 2002-prices
In general it is seen that the indirect costs count for the major part of all cost estimates, ranging from 79% to 99.7% of the total unit costs. Especially, the individual welfare loss becomes of major importance counting for 40% to 96% of the cost estimate Figure 10-1: Relative distribution of the cost elements (3% discount rate)
10.2 Uncertainties - Low and high unit cost estimatesLow and high unit cost estimates may be useful in connection with economic assessments, and is provided here, by a heuretic approach. This basically means, that uncertainties are analysed by a combination of information of uncertainties of various parameters based on various sources combined with the consultant's judgement. Ideally, high and low estimates should be developed through complex mathematical simulations by combining uncertainties of all uncertain parameters. This, however, demands extensive data and is rather complex, and will not be possible within the present project. The low and high unit cost estimates are to reflect the 5% and the 95% percentiles respectively. Thus, the low estimate illustrates the level at which the "true" unit cost value with 5% probability will be equal to or lower than. Likewise, the high cost estimate illustrates the level at which the "true" value with 5% probability will be equal to or higher than. This principle is illustrated in Figure 10-2 below. Figure 10-2: Illustration of the principle behind low and high estimates
The present approach is divided in two steps. First, the critical elements of the unit cost estimates are identified from two criteria: Their relative importance and their degree of uncertainty. Secondly, high and low values of the identified critical elements are set and the effect on the unit cost estimates is analysed. 10.2.1 Identification of critical elementsThe assessment of relative importance and degree of uncertainty is done for each of the three main elements: direct costs, welfare loss and production loss. Each element is assigned a weight (on a ordinal scale) from 0 (unimportant/no uncertainty) to 3 (very important/large uncertainty). The assessment results are relative to each other among cost elements and diseases. Below, the assessment of importance and uncertainty is presented for each disease by a table supplemented by bullets explaining the assessment. Headache:
Table 10-2: headache
Contact allergy
Table 10-3: Contact allergy
Asthma
Table 10-4: Asthma
Lung cancer
Table 10-5: Lung cancer
Skin cancer
Table 10-6: Skin cancer
10.2.2 Assessment of low and high valuesThe low and high values are developed by setting up high and low values of each of the most important and uncertain parameters, relatively speaking and re-estimate the unit cost under combinations of these parameter values. Headache High and low cost estimates are derived from following assumptions:
Table 10-7: High and low unit cost estimates, headache (2002-prices)
Contact allergy High and low cost estimates are derived from following assumptions:
Table 10-8: High and low unit cost estimates, contact allergy (2002-prices)
Asthma High and low cost estimates are derived from following assumptions:
Table 10-9: High and low unit cost estimates, Asthma (2002-prices)
Lung cancer High and low cost estimates are derived from following assumptions:
Table 10-10: High and low unit cost estimates, lung cancer (2002-prices)
Skin cancer High and low cost estimates are derived from following assumptions:
Table 10-11: High and low unit cost estimates, skin cancer (2002-prices)
10.3 Concluding remarksThe present study has provided unit cost estimates for selected chemical-related diseases. Even though the estimates include all elements of the economic costs seen from the society's point of view, estimation of the direct costs has been in focus. Since indirect costs, however, are of major importance relatively, there may be a need for further development of these estimates in a future study. The major critical element, thus, seems to be the individual welfare loss values, here provided by benefit transfer. Since these values are of major importance for the total unit cost estimates it would be preferable to improve these values. Although it may be possible to improve the benefit transfer by broader literature search combined with real world testing of some degree, the rather large step of conducting new and improved WTP surveys seems to be substantial for improvement of the individual welfare loss estimates. 11 ReferencesAEA Technology (2001). Economic Evaluation of AirQuality Targets for PAHs, Final report for European Commission DG Environment. http://europa.eu.int/comm/environment/enveco/air/pah_report.pdf Andersen, I.(Editor) (1994). Arbejdsmedicin, bind 1. 1994; København: Arbejdsmiljøinstituttet. Andersen, Mikael Skou, DMU og Niels Strange, KVL og Forskningscenter Skov og Landskab: Miljøøkonomiske beregningspriser, - forprojekt, 2003 (endnu ikke offentliggjort) Andersen et al. (1998). Måling af omkostninger ved ressourceforbruget til behandling og pleje af demente ældre i forhold til ikke-demente. CHS Working Paper 1998:6. Beddingfield, F. C. (2002). Melanoma. A decision analysis to estimate the effectiveness and costs-effectiveness of screening and an analysis of the relevant epidemiology of the disease. PHD dissertation. RAND Graduate School. Braud, A-C. et al. (2003). Direct treatment costs for patients with lung cancer from first recurrence to death in France. Pharmacoeconomics; 21(9):671-79. Brouwer, W. et al. (2001). Costing in economic evaluations. In: Drummond, M & McGuire, A. Economic Evaluation in Health Care. Merging Theory with Practive. Oxford University Press. Chan-Yeung, M. Occupational Asthma. Environmental Health Perspectives, Vol. 103, Supplement 6, pages 249-252, 40 references, 1995 Chen, J. G. et al. (2001). Cost of Nonmelanoma skin cancer treatment in the United States. Dermatol Surg; 27:12:December. COST 313 (1995), EC - Tansport research: Cost 313 - Socio-ecnonomic cost of road accidents (1994). COWI: Værdisætning af trafikkens eksterne omkostninger, rapportudkast til Trafikministeriet, 1999 DEPA: Notat om værdisætning af sundhedseffekter, internt notat, 2003 Dombernowsky, P. et al. (1997). Medicinsk behandling af kræftsygdomme. Arbejdsgruppe nedsat af Dansk Selskab for Intern Medicin. Ugeskrift for Læger, nr. 3. Drzewiecki, K. (2003). Assessment. Personal communication. 26-11-03. EPA - Cost-of-illness handbook. US Environmental Protection Agency (2002). URL: http://www.epa.gov/oppt/coi/. Accessed on the 18th of August 2003. Evans C. and Crawford B. (2000). Expert judgement in pharmacoeconomic studies. Guidance and future use. Pharmacoeconomics. 2000 Jun;17(6):545-53. EU Kommissionen: Assessment of the Impact of the New Chemicals Policy on Occupational Health, RPA, 2003-06-05 Finansministeriet (1999). Vejledning i udarbejdelse af samfundsøkonomiske konsekvensvurderinger. Friedrich, Rainer and Bickel, Peter: Environmental External Costs of Transport, 2001. Gundgaard et al. (2002). Vurdering af de sundhedsøkonomiske konsekvenser ved et øget indtag af frugt og grøntsager. Teknisk Rapport. CAST - Center for Anvendt Sundhedstjenesteforskning og Teknologivurdring Hansen, J. et al. (1998). Risiko for cancer ved arbejde med visse stoffer som er kræftfremkaldende hos dyr. Forskningsrapport. Arbejdsmiljøfondet. Housman, T. S. et al. (2003). Skin cancer is among the most costly of all cancers to treat for the Medicare population. J Am Acad Dermatol, Vol 48, Number 3; 425- 429. Hudgson, T. A. (1994). Costs of illness in cost-effectiveness analysis. A review of the methodology. Pharmacoeconomics 6 (6):536-52. Hudgson, T. A. (1988). Annual costs of illness versus lifetime costs of illness and implications of structural change. Drug information journal, vol. 22, pp.323-41. The International Classification of Headache Disorders. 2nd Edition (2003). Short title: ICHD-II. Headache Classification Subcommittee of the International Headache Society (HIS). Johansen, D. J. and Ménné, T. (2003). Personal communication. 10-10-03. Kidholm, Kristian og Jes Søgaard, Odense Universitet, Centre for Health and Social Policy: Undersøgelse af behandlingsomkostninger ved personskade ved trafikulykker, Arbejdsnotat 1996:1, 1996 Kidholm, Kristian (1995), Odense Universitet, Centre for Health and Social Policy: Estimation af betalingsvilje for forebyggelse af personskader ved trafikulykker, Afhandling fra Odense Universitet, 1995 Krupnick, Alan, Anna Albertini, Maureen Cropper and Nathalie Simon, RFF: Mortality Risk Valuation for Environmental Policy, Discussion paper, 1999 Kræftens bekæmpelse (2003a). Definition af incidens og overlevelsestal. Definition of incidence and survival data (in Danish). http://www.cancer.dk/alt+om+kraeft/fakta+om+kraeft/definition+af+incidens+og+overlevelsestal1.asp. Accessed on the 8/12/03. Kræftens bekæmpelse (2003b). Behandling af lungkræft. http://www.cancer.dk/alt+om+kraeft/kraeftsygdomme/lunge/behandling+af+lungekraeft1.asp. Accessed on the 10 September 2003. Kuntz, K., M. & Weinstein, M. C. (2001). Modelling in economic evaluation. In: Drummond, M & McGuire, A. Economic Evaluation in Health Care. Merging Theory with Practive. Oxford University Press. Lægemiddelstyrelsen (2003). Costs of drugs. Costs per DDD calculated from 'Årsstatisik. Fordelt på alder og køn i den primære sundhedssektor (1998-2002)'. http://www.laegemiddelstyrelsen.dk/statistik/aarsstatistik.asp. Accessed 9-10-03. Lægemiddelstyrelsen (2001). Forbruget af astmamedicin blandt voksne i Danmark 1998-2000. http://www.laegemiddelstyrelsen.dk/statistik/forbrugsanalyser/astmanotat.asp. Accessed 13-10-03 Mosbech H. (2003). Assessment. Personal Communication. Overlæge, dr. med. Rigshospitalets Allergiklinik. 21-10-03. Møller F. et el (2000): Samfundsøkonomisk vurdering af miljøprojekter. Danmarks Miljøundersøgelser, Miljøstyrelsen og Skov- og Naturstyrelsen. Navrud, S, Agricultural University of Norway: Valuing Health Impacts from air pollution in Europe, New Empirical Evidence on Morbidity, Working paper, 1997) OECD: Technical Guidance Document on the use of Socio-Economic Analysis in Chemical Risk Management Decision Making No. 14, 2002 OECD: Framework for Integrating Socio-Economic Analysis in Chemical Risk Management Decision Making No. 13, 2000 OECD: Guidance for Conducting Retrospective Studies on Socio-Economic Analysis No. 11, 1999 OECD: Proceedings of the OECD Workshop on the Integration of Socio-Economic Analysis in Chemical Risk Management Decision Making, London January 7-9 1998 No. 9, 1999 Olesen, J. (2003). Personal communication. Professor of Neurology. Department of Neurology. Glostrup Hospital. University of Copenhagen. Denmark. 1-10-03. Olivier, E. et al. (2001). Treatment pathways, resource use and costs in the management of small cell lung cancer. Thorax. Oct;56(10):785-90. Otterström T., Gynther L., and Vesa P., The willingness to pay for better air quality, Ekono Energy Ldt., 1998. Pearce: Valuing Risks to Life and Health, Towards Consistent Transfer Estimates in the European Union and Accession States, paper prepared for the EU Commission (DG XI), 2000 Petersen, M. L. and Larsen, T. (2003). Reduktion af radon. En samfundsøkonomisk analyse. Institut for Miljøvurdering. August 2003 Rasmussen, S. R. and Søgaard, J. (2000). Tobaksrygningens samfundsøkonomiske omkostninger. Ugeskrift for læger;162:3329-33 Sonnenberg, F. A. and Leventhal, E. A. (1998). Modelling disease progression with Markov models. Health Economics of Dementia. Edited by Anders Wimo, et al. John Wiley & Sons Ltd. Sundhedsstyrelsen: Forebyggelse af kontakteksemer, 1998 Sundhedsstyrelsen (2001). Forebyggelse af kontakteksemer. Forebyggelse og Sundhedsfremme. 2001/17. http://www.sst.dk/publ/Publ2001/suke2.pdf. Accessed 1/10/03. Statistics Denmark (2003a). Expected remaining lifetime. StatBank Denmark. http://www.statistikbanken.dk/statbank5a/SelectVarVal/Define.asp?MainTable=HISB8&PLanguage=0&PXSId=0. Accessed 18-10-03 Statistics Denmark (2003b). Statistisk Årbog 2003 Storm, H. H. and Engholm, G. (2002). Relativ overlevelse for danske kræftpatienter diagnosticeret 1981-1997 og fulgt til 2001. En status. Ugeskrift for læger, 27. maj 2002, nr. 22. Vejdirektoratet: Trafikøkonomiske enhedspriser for uheld - Alternative metoder til opgørelse af velfærdstabet, Arbejdsnotat udarbejdet af COWI, 2002 Virmani, A. K. et al. (1999). Molecular Abnormalities in lung cancer and their relationship to histological subtypes in: Hirsch, F. R. (Editor). Lung Cancer. Recent developments in diagnosis and treatment. Sundhedsstyrelsen (2003a). Cancerregisteret 1999. Nye tal fra Sundhedsstyrelsen. Årgang 7. Nr. 2 2003. Sundhedsstyrelsen (2003b). Kræftstatistik baseret på landspatientregisteret 1998-2002. Nye tal fra Sundhedsstyrelsen. Årgang 7. Nr. 9 2003. TreeAge (2001). DataPro 4.0 Health Care User's Manual. TreeAge Softeware. Vogel U, Dybdahl M. Kroppens forsvar mod DNA-skader påvirker kræftrisikoen. Miljø og sundhed,2000;3;12-13 Appendix 1. List of sources for the direct cost calculations1. Organisation af allergidiagnostikken (1999). En økonomisk konsekvensberegning. Delrapport 2. DSI (Institut for Sundhedsvæsen) for Statens Institut for Medicinsk Teknologivurdering). Assumptions from 'Modelamtet' are used. 2. Mossing R. and Damgaard Nielsen, G. (2003). De samfundsøkonomiske omkostninger ved astma i Danmark i 2002. Ugeskr Laeger. Jun 23;165(26):2646-9. 3. Sørensen L, Wneg S., Weng SL, et al. (1997). The cost of astma in Denmark. Br J Med Econ; 11:103-111 4. Søndergaard B, Thorleifsson S, Herborg H et al. (2000). Kvalitetssikring af astmapatienters lægemiddelbehandling. Ugeskr Læger. 162:480-6 5. Cost-of-illness handbook. Data from CDC (Centers for disease control) 1998. 6. DRG takster 2002. Stationære patienter. Sundhedsstyrelsen. http://drg.sst.dk/info/takster_2002/takst_2002.htm. Accessed 18 August 2003. 7. Takster for ambulante patienter. 2002. Sundhedsstyrelsen. http://drg.sst.dk/info/takster_2002/DAGS%20takster%20(word).pdf. Accessed 18 August 2003. 8. Rettelsesblade til DRG takser 2002. http://drg.sst.dk/info/takster_2002/Takstsystem%202002%20Vejledning%20-%20retteblade.pdf. Accessed on 18 August 2003. 9. Honorary for GP services. Honorartabel vedr. Landsoverenskomsten per 1. oktober 2002. (Almen praktiserende læger) 10. Based on study from Gentofte Amtssygehus (1993). Sundhedsstyrelsen: http://www.sst.dk/upload/astma.pdf. Accessed 26 August 03 11. Personal communication. PLO (Praktiserendes Lægers Organisation). 7-10-03 12. Consumer price index health care services. Statistics Denmark. StatBank Denmark. http://www.statistikbanken.dk/PRIS7. Accessed on the 18 August 2003. 13. Honorary for Medical Specialist services. Løn og Takster. Takstkort. Allergologi, Dermato-venerologi. 1. April 2003 (hele landet). 14. Olesen, J. (2003). Assessment. Personal communication. 1-10-03. 15. Behandling af patienter på klinik (almen fysioterapi) pr. 1. oktober 2002 - gruppe 1. Speciale 51. Danske Fysioterapeuter 16. Lægemiddelstyrelsen (2003). Costs per DDD calculated from 'Årsstatisik. Fordelt på alder og køn i den primære sundhedssektor (1998-2002)'. http://www.laegemiddelstyrelsen.dk/statistik/aarsstatistik.asp. Accessed 9-10-03. 17. Lægemiddelstyrelsen (2001). Forbruget af astmamedicin blandt voksne i Danmark 1998-2000. http://www.laegemiddelstyrelsen.dk/statistik/forbrugsanalyser/astmanotat.asp. Accessed 13-10-03 18. Expected remaining lifetime. Statistics Denmark. StatBank Denmark. http://www.statistikbanken.dk/statbank5a/SelectVarVal/Define.asp?MainTable=HISB8&PLanguage=0&PXSId=0. Accessed 18-10-03 19. Average reimbursement rate for 2002 based on data requested from Danish Medicines Agency. 20. Statistics Denmark. Costs were retrived by Jens Gundgaard at CAST (Center for Anvendt Sundhedstjenesteforskning og Medicinsk Teknologivurdering) in relation to the project: Vurdering af de sundhedsøkonomiske konsekvenser ved et øget indtag af frugt og grønt. CAST 2002. 21. Gundgaard et al. (2002). Vurdering af de sundhedsøkonomiske konsekvenser ved et øget indtag af frugt og grøntsager. Teknisk Rapport. CAST - Center for Anvendt Sundhedstjenesteforskning og Teknologivurdring. 22. Storm, H. H. and Engholm, G. (2002). Relativ overlevelse for danske kræftpatienter diagnosticeret 1981-1997 og fulgt til 2001. En status. Ugeskrift for læger, 27. maj 2002, nr. 22. First year relative survival (23%:1996-1997) is calculated from an un-weighted average of men (22%) and women (24%). Five year relative survival (7%: 1991-1995) is equal for men and women. Ten year relative survival (4%: 1986-1990) is equal for men and women. The latest available suvirval rate are used. For the intermediate years (2,3,4;6,7,8,9) the survival rates are estimated using an exponential function. 23. Amtsrådsforeningen, Sundhedsministeriet og Kommunernes Landsforening (2001). Hjælp til at leve til man dør. Rapport fra arbejdsgruppe om palliativ indsats i amter og kommuner. http://www.kl.dk/data/636896/palliativ_indsats.pdf. Accessed 25-09-03 24. Sundhedsministerens besvarelse af spørgsmål nr 4, B 21 - bilag 1, som Sundhedsudvalget har stillet den 14. november 1997. Løbenr. 4787. Average of high and low cost scenario for dying at home. http://www.folketinget.dk/Samling/19971/udvbilag/00337792.htm. Accessed 25-09-03. 25. Keiding, L. (1997). Astma, allergi og anden overfølsomhed i Danmark - og udviklingen 1987 - 1994. Dansk Institut for Klinisk Epidemiologi. 26. Duus, J. and Ménné, T. (2003). Average estimate based on data from Department of Dermatology. Gentofte Hospital. University of Copenhagen. 10-10-03. 27. Meding, B. and Swanbeck, G. (1990). Consequences of having hand eczema. Contact Dermatitis; 23:6-14. 28. Duus, J. and Ménné, T. (2003). Assessment. Personal communication. 10-10-03. 29. Den mulige gevinst af forebyggelse af sygefravær og udstødning fra arbejdsmarkedet. (2002). Arbejdsmiljøinstituttet. 30. Rasmussen, K. et al. (1995). Sygefravær og livskvalitet hos personer med forskellige sygdomme og brug af forskellige former for medicin. Dansk Institut for Klinisk epidemiologi. 31. Mosbech, H. (2003). Assessment. Personal communication. 21-10-03. 32. Sundhedsstyrelsen (2003). Kræftstatistik baseret på landspatientregisteret 1998-2002. Nye tal fra Sundhedsstyrelsen. Årgang 7. Nr. 9. 33. Bergmann, K. (2003). National Board of Health. 34. Drzewiecki, K. (2003). Assessment. Personal communication. 26-11-03. To be confirmed. 35. Sundhedsstyrelsen (2003). Cancerretisteret 1999. Nye tal fra Sundhedsstyrelsen. Årgang 7. Nr. 2. 36. Salfeldt, J. (2003). Average costs of discharge for patients with contact allergy (ICD-10 code 'L23'). Cost estimate based on discharges at Gentofte Hospital. 37. Bergmann, K. (2003). Total DRG costs and number of discharges for ICD-10 'C44'. National Board of Health. Email. 28-10-03. KAB@sst.dk. Appendix 2. Resource personsAsthmaHolger Mosbech. Consultant doctor. Allergy Clinic. Rigshospitalet. University of Copenhagen Contact allergyTorkil Ménné, Professor and Dr. Jeanne Duus. Department of Dermatology. Gentofte Hospital. University of Copenhagen HeadacheJes Olesen. Professor of Neurology. Department of Neurology. Glostrup Hospital. University of Copenhagen. Lung cancerThe estimation of direct costs for lung cancer was based on register data. Therefore a clinical expert was not contacted. Skin cancerKrzysztof Drzewiecki. Consultant doctor. Skin cancer clinic. Rigshospitalet. University of Copenhagen. Appendix 3. Glossary
|
|||||||||||||||||||||||||||||||||||||||||||||||||||||||||||||||||||||||||||||||||||||||||||||||||||||||||||||||||||||||||||||||||||||||||||||||||||||||||||||||||||||||||||||||||||||||||||||||||||||||||||||||||||||||||||||||||||||||||||||||||||||||||||||||||||||||||||||||||||||||||||||||||||
