|
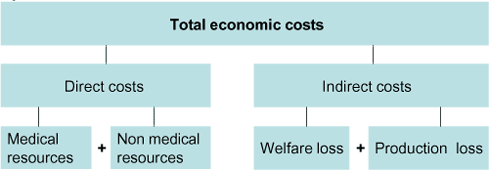
Valuation of Chemical related Health Impacts 4 Valuation MethodologyThe objective of the study is to develop unit costs for the selected diseases that can be used in social cost-benefit analyses.. Therefore, it is the the total costs of the disease, and not only the direct costs, that has to be measured. The unit prices for each disease are to reflect the average incremental costs due to the disease. In the estimate co-morbidity costs (increased likelihood of acquiring other diseases when having one disease) are also included. In general, when assessing the total costs of a disease, the resources used should be valued at their opportunity costs (Brouwer et al. (2001)). This ensures that the cost estimate can be appropriately used in cost-benefit analysis. However, in health care markets, prices do often not reflect opportunity cost. The reason for this is market failures and the fact that payment is often fully or partially done by third party payer. In practice, however, it is difficult to assess the degree to which the available prices do not reflect opportunity costs. Therefore, correction of bias relation in the available prices will not be attempted. The total economic costs of a disease consist of both direct and indirect costs (Figure 4-1). Direct costs are costs of medical and non-medical resources directly related to treatment of the disease. Indirect costs are the costs of the welfare and production loss related to the disease. Figure 4-1 Total economic costs of a disease
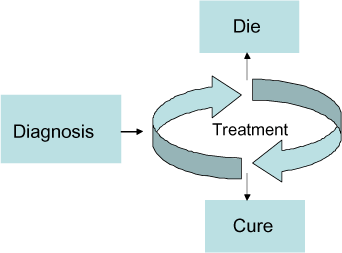
As already mentioned, it is the assessment of the direct cost that is in focus in this study. Based on collection of specific data for the resource use and unit costs for individual elements in the medical and non-medical treatment of specific disease, it is possible to provide robust estimates of the direct costs. Only some elements like hospital costs have been assessed before, while a systematic overview of all direct cost elements for a given disease is the main contribution of this study. The basis for valuation of the economic costs of the selected diseases will be a description of the disease course defined by a number of stages, each characterised by different costs (see Figure 4-2). Figure 4-2: Illustration of a Disease course
The costs can be estimated either by assessing the costs at each state along with the probability of reaching the state or by estimating the costs of the total course aggregated. What approach to apply will depend on the data availability within each disease and within each cost element. The approach applied in the specific case is described in more detail in the following chapters. The description of the valuation methodology is introduced by a section on the general issues of valuation method concerning in principle all cost elements. Next, each of the cost components of Figure 4-1 is described in details along with suggestion for the best valuation methodology for the present purpose. 4.1 General issues related to valuation methodologyThe overall valuation framework will follow the guidelines of the Danish Ministry of Environment and the Danish Ministry of Finance found in Møller F. et al (2000) and Finansministeriet (1999) respectively. In addition to this, the following issues are highlighted below. 4.1.1 DiscountingDiscounting is used in order to take into account that the costs will occur in different time periods. DEPA generally recommends a discount rate of 3%1, whereas the Danish Ministry of Finance recommends that a 6% discount rate is used in cost-benefit analyses (Finansministeriet 1999). In the present study, a discount rate of 3% will be applied along with a sensitivity analysis using 6% instead of 3%. 4.1.2 UncertaintiesCosts are calculated for the average patient. In order to take uncertainty of the estimated costs and intensity of treatment into account low and high estimates will be provided along with the best estimate. Ideally, the low and high estimates are to reflect the 5 and 95 percent quartiles of the best estimate. These estimates are based on heretic assessments of possible lower and higher costs. The reason for the heretic assessment is that exact calculation of a specific quartile is not possible within the scope of the present project. 4.1.3 Age distribution and implication on the estimatesIt is a currently ongoing discussion whether the size of production loss and individual welfare loss is age dependent (see sections 4.3 and 4.4 for further information of the points of discussion). In the present study, it is assumed that the cost elements are age independent. For chronic diseases such as contact allergy, the calculation is based on an assumption of starting age of the disease and average remaining lifetime. 4.2 Direct costsDirect costs are costs for medical resources and non-medical resource. Medical resources are costs for medical services needed for the treatment; i.e. hospital services, drugs, medical specialists, GPs (General Practitioners), nursing home, home help services, etc. Non medical resources are costs for non medical services needed for the treatment; i.e. transportation, worker retraining, acquisition of special equipment. In the estimate of direct costs, only costs of medical resources are included. 4.2.1 Methods estimation of direct costsLifetime costs for a disease or components of a disease can be estimated from either prevalence based annual costs or incidence based costs (Hudgson (1994))2. Roughly speaking, prevalence based lifetime costs are estimated by dividing total annual costs with the number of persons having the disease. Incidence based lifetime costs are estimated by modelling lifetime progression of the disease The progression of the disease is either modelled using a simple probability tree or a Markov model. A Markov model is a way to model how a disease evolves over time (Briggs and Schulpher (1998)). From the Markov model, the expected lifetime costs can be directly estimated. The advantage to this method is that, that the costs are directly linked to the disease course. The main drawback is the detailed level of information required. For a further introduction to Markov models in a health care context see Briggs and Schulpher (1998) or Sonnenberg and Leventhal (1998). In this report, the costs estimates are to be based on existing data. Therefore, the approach taken depends on the available data and can be different for the different cost components of the same disease. As a general rule, lifetime costs derived from the prevalence approach will often be more accurate than using the incidence approach when having poor estimates of important parameters (Hudgson (1994)). This is taken into account when choosing what method to apply. 4.2.2 Data sourcesDisease states A disease consists of a number of disease states. Sources for classifying a disease into states are based on Danish, international publications and expert input. Treatment within each disease state The sources for treatment solutions within each disease state are based on Danish publications. Where no Danish publications are available, resource use is based on expert input by international acknowledged Danish physicians. Expert input The experts who have provided input are listed in Appendix 2 Resource Persons. Input was given during a meeting held with the expert. Prior to the meeting all relevant material was sent to the expert. The meeting was followed up with email, telephone conversation or subsequent meeting where necessary. All experts were given the opportunity to approve or confirm when they were quoted in the report. Survival data For estimation of the number of persons dying from a disease, the relative survival is used. The relative survival is the observed survival divided with the expected survival for the background population with the same age and sex distribution (Kræftens Bekæmpelse (2003a)). Therefore, the number of persons dying can be interpreted as the excess mortality which can be attributed to the disease. Transition probabilities A transition probability describes the patients move from one disease state to another. The transition probabilities depend, among other things, on the actual treatment given. The transition probabilities are based on Danish data. In the literature, 5 and 10 year survival probabilities will often be available. However, in order to estimate expected lifetime costs, 1 year transition probabilities are needed. Calculation of transition rates from t year probabilities are based on the exponential distribution as this is a commonly used distribution for this purpose. Economic data All cost data reflect 2002 values. When 2002 cost estimates are not available, the most recent cost data are used and inflated to 2002 values. The Danish consumer price index for health care services is used to inflate the costs data. Patients' co-payments are not included in the direct costs as this part is included in the WTP estimate. An utilisation rate describes the yearly expected number of services used. The utilisation rates are based on Danish data. When no data are available, the utilisation rate is based on an expert assessment. Hospital costs are based on the Danish DRG (Diagnosis Related Groups) (2002) system covering all hospital services. Costs of Primary Health Care Services, are based on the agreed rates for 2002 between 'Sygesikringens forhandlingsudvalg', 'Foreningen af specialpraktiserede læger (FAS)' and 'Praktiserende lægers organisation (PLO)'.3 Drug costs at the hospitals are covered through the DRG-system. Data on costs of prescription drugs related to each disease has been estimated either from published data or expert input. 4.3 Individual welfare lossThe individual welfare loss shall express the cost in terms of pain and suffering for the victim following the disease as well as worry and grief caused to close relations. The individual welfare loss can be said to include following elements:
There are two distinguished approaches for estimation of the welfare loss, namely "the human capital approach" and the "Willingness to pay (WTP) approach". Figure 4-1 gives an overview of which of the above-mentioned cost elements are included in the two methods. The methods are further described below. Table 4-1: Elements included in human capital and WTP approach
4.3.1 Human capital approachIn the human capital approach, humans are viewed as capital like other kind of capital for a production process. In this regard, a human life is valued in terms of what it is worth in terms of input for production, which is equal to the lost future contribution to the production of the society. The human capital approach thus estimates the welfare loss by the gross production loss. Besides the net production loss (described in section 4.4 below) this includes the individual's loss in terms of lost income, corresponding to the first bullet above, whereas the remaining four bullets are not included. One way of improving the human capital method is to add a statement of the cost in terms of lost leisure time. Such an approach is described further in Danish Road Directorate (2002). Inclusion of this element will improve the estimates of the human capital method, but will still lack the remaining three bullets (Loss due to pain and suffering, loss due to private medicine and treatment costs, and suffering and sacrifice for close relations). 4.3.2 Willingness-to-pay approachThe WTP approach on the other hand seeks to estimate the welfare loss by revealing their willingness to pay for avoiding (or accepting) the risk of a certain morbidity impact. The methods for this can be divided into stated preferences and revealed preferences method. In stated preference method the WTP is estimated people are directly asked about their WTP, whereas revealed preferences method seeks to reveal the WTP by looking at the behaviour on related markets. There are numerous problems related to the performance of a WTP study, and in order to deal with these problems, it tends to be the very resource demanding to carry out a WTP study. This is mainly the reason why very few adequate WTP studies of morbidity issues have been carried out. Thus, whereas the human capital approach does not include all aspects of the welfare loss, the WTP approach may be critical in terms of its degree of accuracy. 4.3.3 Estimation of WTP by benefit transferDue to the complexity of carrying out a WTP study, the most commonly used approach for estimating the individual welfare loss in this regard is use of benefit transfer. Benefit transfer is defined as the "use of existing information designed for one specific context to address policy questions in another context" (Pearce, 2000). There are numerous additional problems connected with benefit transfer besides the problems connected with performance of the WTP study itself and, thus, benefit transfer should be used with caution. A number of issues affecting the WTP value must be considered and compared between the original study and the actual case. Especially, following issues are of importance:
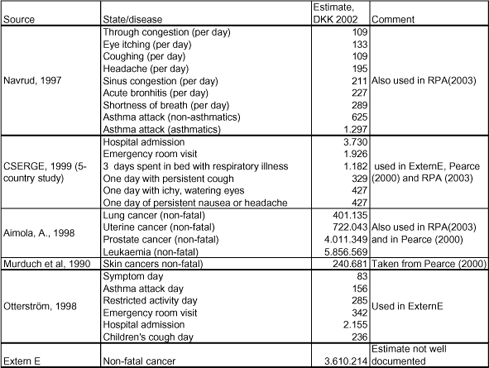
4.3.4 Valuation methodology in the present studyIn the present valuation study, the individual welfare loss will be estimated by benefit transfer from WTP studies to ensure that all elements of the welfare loss in principle are included although it is recognized that these estimates are likely to be very uncertain, which will result in high deviation in low and high estimate relative to the mean value. As mentioned above there are a number of critical issues that must be considered in the design and performance of the WTP survey. This relates to e.g. the formulation of the questions, the method used for collection of answers, the population group asked, their degree of understanding the morbidity effect etc. In the present study, we do not investigate the original surveys for such critical issues. We will use generally accepted studies by assuming that they are designed and performed in the best possible way. In addition to this, we will consider other person's critical review of these studies and highlight these issues if they are considered important in the present context. The critical issues related to benefit transfer will be taken into account in following way: The original values will be adjusted to 2002-prices by the official Danish consumer price index (Statistics Denmark, 2003b). In case of international values, the original WTP estimates will be corrected for differences in per capita income level, where the income level is adjusted for differences in purchasing power by such index values from Eurostat. After this correction, the value is inflated to 2002 prices.4 Furthermore, differences in end points valued and cultural differences should be taken into account. It is not so obvious, however, how to correct quantitatively for these factors. In the present context these issues are addressed by introducing high uncertainty intervals on this cost element in connection with development of low and high unit cost estimate (section 10.2.2) in cases of benefit transfer from studies of very different end points and/or studies from a country with large cultural differences compared to Denmark. 4.3.5 The welfare loss and the disease courseHow estimation of the welfare loss is connected to the defined course tree depends on, how the WTP is discovered. Either, people may be asked about their willingness to pay for each state in the course tree and these values are subsequently combined with the probabilities of the various states. Or people are asked about their total WTP for avoiding a certain diagnosis/illness. The latter is clearly the simplest one, but it does demand that detailed information about the course of the illness is provided for the respondents in a way that ensures that people asked do fully understand the consequences of the disease. The approach used here depends on the data available from other studies, which will be used for benefit transfer. Since data within the different diseases differs in shape, the approach differs somehow among the diseases valued. The concrete approach used within each disease is described in the disease specific chapters. 4.3.6 Existing data - morbidityAs mentioned earlier, rather few studies have actually provided estimates of individual welfare loss of diseases by carrying out WTP surveys. We have searched for exiting studies relevant to this project and have found, that exiting estimates steams from very few actual WTP surveys. Below an overview of the estimates that are most frequently used.
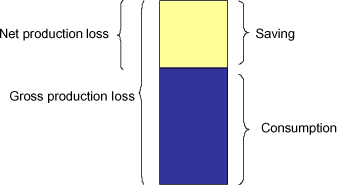
The estimates used here will be found within this list. 4.3.7 Individual welfare loss in connection with mortalityThe value of a statistical life is used with regard to assessing the welfare loss from mortality.5 There are many complications attached the concept of estimating the welfare loss from increased mortality. Only, two problems related to the application of the value of a statistical life should be mentioned here. Firstly, it is an ongoing discussion whether to correct for the average age of the patient by using the value of a life year lost (VOLY) or using the age independent value of a statistical life (VSL). The key issue in the discussion is the empirical evidence on whether there is a link between WTP and remaining lifetime. As the current empirical evidence seems not to indicate a proportional relationship, which is required for supporting the use of VOLY, in most cases the VSL is suggested. However, the age aspect is then partly taken into account by modification of the VSL. The specific choice of value is discussed in the next section. Overall, it has been decided to use the value of a statistical life and not the VOLY approach, based on recommendations of DEPA (2003). Secondly, it may be stated, that the value will be dependent of the cause of death. E.g. one may point on the "dread effect" of cancer compared to other diseases or accidents6. This issue is not further addressed here. 4.3.8 Existing data - mortalityThere are numerous sources of a value of a statistical life. For the present purpose, it has been decided to use an estimate that has been used by DEPA in other similar studies. This value is based on the work and recommendations behind developing a set of EU standard values. Through the large study on external costs of energy production, called ExternE, many unit values were developed. In order to prepare a set of standard benefit values to be used in relation to air pollution, the EU Commission called a panel of valuation experts to address the issue of how to value the welfare loss for changed mortality. The recommendation of the panel was used in the development of the benefit tables, named the BeTa database7. The standard estimate for value of a statistical life recommenced by the EU panel is € 1.4 million (1999-prices). Furthermore, they propose to use an estimate of € 1 million in connection with air pollution to take into account the fact that it is mainly older people that die from air pollution. This means that the estimate of € 1 million includes the age aspect8. A choice had to be made whether to use the standard value or the one including the age aspect. Since the estimate in the present study is to be used in connection with lung cancer, which mainly hits people above a certain age, it may seem appropriate to use the estimate corrected for the age aspect. Furthermore, this estimate has been used as basis in other valuation studies of DEPA, and thus ensures consistency between different works of DEPA it is preferable to use the same value. It has then been decided to use the estimate of a VSL generally recommended by DEPA, which is based on the age corrected value suggested by the EU Commission. In this way we ensure consistency with other DEPA studies. Also, the age aspect is taken into consideration in the cases when is most needed without making specific age corrections9. DEPA recommends a value of DKK 9.64 million, (2002-prices), which arises from the value of the EU Commission of € 1 million, corrected for differences in purchasing power and then inflated to 2002 price level. For further information, see DEPA (2003). 4.4 Production lossThis component refers to the loss of the society from less production due to morbidity or mortality. It should be emphasised that the production loss here is something else than individual welfare loss measured through the human capital approach. Here, production loss refers to the issue of whether there is reduction in the aggregated national product that is not accounted for in the individual welfare assessment. Such a production loss is independent of the approach used to assess the individual welfare loss. See section 4.4.1 below for further description. Illness means that the work ability decreases. This results in a loss to the society corresponding to the value of the additional output that could have been produced in the absence of illness. It is necessary to distinguish between gross and net production loss. Gross production loss refers to the value of the additional output that the individual could have produced if the disease had not incurred. The net production loss deducts the consumption from the gross production loss, which corresponds to the net savings. Whether to include the gross or net production loss in the unit cost estimation depends on what is included in the other cost components (especially in the welfare loss estimate). In the present study, the approach is to include the gross production loss under illness. The reason for this is, that it is generally expected, that people to a high degree are compensated economically during the illnesses considered here, and therefore do not include production loss in their WTP. The production loss is still present however; it is just paid by either the government or private insurance companies. Section 4.4.1 below explains in further details why this seems to be the most appropriate approach in the present context. 4.4.1 Links to other cost componentsThe gross production loss can be divided into two parts: (1) the part accruing to the individual in terms of lost consumption possibilities and (2) the remaining part (called the net production loss) corresponding to loss of net saving to the economy. The loss for the society due to lost working ability corresponds to the gross production loss. Figure 4-3: Illustration of gross and net production loss
The part of the production loss reflecting loss of consumption possibilities will normally be included in the WTP estimate of the individual welfare loss, and thus should in principle not be included in the production loss estimate as well. In case of disease, people are normally compensated financially to a certain degree by the social benefits or by a health insurance. The degree of compensation differs from case to case and also among countries. If the individual is fully compensated during illness, in principle, the WTP estimate does not include part of the gross production loss. In this case, the gross production loss should be added to the WTP estimate in order to provide an estimate of the total indirect costs. If on the other hand the individual is not compensated at all, the lost consumption possibilities is expected to be included in the WTP estimate and following this the total indirect should be estimated as the WTP estimate plus the net production loss. Thus, it depends on whether loss of consumption possibilities is included in the WTP estimate or not. It is rather normal that the employed are fully compensated, meaning that salary is paid during illness, up to a certain number of sick days. After this limit the person is partially compensated by sickness benefit from the state and/or insurance. In a longer time perspective the person may loose his job and receive social security benefit or national supplementary disability pension. Thus, the person affected by sickness will normally be financially compensated to a high extent. Following this, the person will only to a limited extent experience an income decrease and therefore it is likely that the individual welfare loss estimated by WTP for avoiding the disease does not include loss of consumption possibilities. There may be differences among countries regarding the degree of compensation during illness, which is of importance in connection with benefit transfer from WTP studies from other countries. And to the extent that degree of compensation is substantially lower in countries from which benefit transfer is carried out compared to Denmark, this may result in an overestimation of the indirect costs. This aspect, however, has only a limited impact on the estimates of the direct costs in the present study and is therefore not considered further in the present analysis. To sum up, the production loss to be included is the gross production loss, unless it is expected that loss of consumption possibilities are somehow included in the WTP estimate. To avoid double counting this means that public expenditure for sickness benefit etc. is not included. It should be kept in mind, that this approach does not necessarily give an appropriate picture of the distribution of the expenditure burden. In the case of death, it is normally recommended to use the net production loss along with a WTP based statement of the individual welfare loss, since the loss of consumption possibilities will be part of the estimated value of WTP for avoiding a certain death risk. It is also in most cases assumed that the respondents in WTP surveys do not include more general losses to the society. Therefore, the net production loss should be included. It is an issue that not always have been proporly addressed in the various studies on values of a statistical life. However, to give a comprehensive assessment, it should be included.10 4.4.2 Production loss and age dependencyLike for the individual welfare loss it is an ongoing discussion whether the value of the production loss should vary with the age of the individual. The argument for such a variation is that more production is lost when the person is in the highly productive age compared to a person being at a less productive stage of its life (very young or rather old). The implication of using different values according to the age is that the health of a rather productive person will be preferred from an economic point of view over the health of an old (or a very young) person all other things being equal. Same argument could be given then in relation to men and women. Since primary income is lower for women than for men, initiatives supporting men's health should be preferred over initiatives supporting women's health, all other things being equal. This may be problematic since not-market production value such as work in the household is not included in the income values. Ethically, this may be considered as problematic, and it sometimes recommended not using such an approach. A rational argument against production loss values varying with the age is that the individual contribute to the society with his production and tax payments under the assumption that he will benefit from this not only today but also when he gets old. In the present study an average value for the production loss not related to the age of the patient will be applied, meaning that production loss contain same value no matter the age of the individual. It should be added that the production loss will be estimated for each year of the disease or each year of the remaining life time, if a chronic disease, or for each year lost in case of death. In these cases, the accumulated value of the production loss naturally will be higher the younger a person. 4.4.3 Gross production loss estimation in the present studyThe estimation of the gross production loss will be based on the approach used in "Revision af uheldsomkostninger 1998", made by COWI for the Danish Road Directorate. Here, the production loss is estimated from the "primary income". The Primary income is defined as income in terms of salary and surplus from independent business. It is distinguished from the term personal income by not including transfer income, which is not a product of business activity. The primary income is expressed as an average over the total population. Thus, the primary income concept is a measure of the average earnings taking into account the occupation frequency. In the present study it has been decided not to apply different production loss values for different age groups neither for men or women (see discussion in section 4.4.2 above). Consequently, the average production loss has been estimated, based on Statistics Denmark (2003b) The primary income reflects the yearly income. The consequences on working ability from various diseases will in many cases be expressed in terms of lost working days. Thus, the primary income figures should be expressed per working days as well. 2001 included 252 working days. This results in an average production loss of DKK 533 per working day lost. The key figures of the estimation are seen in Table 4-2 below. Table 4-2: Estimation of average production loss per day, 2001 values
4.4.4 The net production loss in the present studyThe net production loss will be used in connection with valuation of a certain death risk. The value should be based on the net saving rate of the society. Since it is likely to vary from year to year, the net saving rate is estimated as an average over three years (1999-2001). Based on figures from the National Account (Statistics Denmark, 2003b), the average net saving rate is 10.4%. This results in an estimate of the net production per lost working day, corresponding to 10.4 of the primary income, that is DKK 55 per day. With an assumption of 252 working days per year in average, the net production loss in case of death will be DKK 13,937 per year. Footnotes1 Including a correction factor for capital investments (see Møller (2000)) 2 Lifetime costs can be estimated from the prevalence based annual costs when it is assumed that the parameters describing the prevalence, incidence and treatment of the disease are constant. 3 The costs data for Medical Specialists are for 2003 as the rate for these services are adjusted every second year only. Therefore the rates for 2003 were assumed to reflect the values for 2002 also. 4 This is the usual way to make this correction, first to make the adjustment from one country (and currency) to the other country using the PPP rates and then do the inflation/deflation adjustment. It implies a small uncertainty - much les than do all other elements of benefit transfer. 5 In relation to the terminology used in EC study ExternE (Externalities on Energy), this corresponds to 'acute mortality'. 6 In a number of analyses by the European Commission, a risk premium of 50% is utilised for fatal cases, see for example: http://europa.eu.int/comm/environment/enveco/air/pah_report.pdf 7 Central parts of data foundation and documentation is found in BeTa - Benefits Table database: http://europa.eu.int/comm/environment/enveco/studies2.htm#Marginal%20external%20costs%20air%20pollution 8 See the BeTa - Benefits Table database documentation. 9 For chronic or deadly diseases assumptions about average age at the occurrence of the disease have been made. This is necessary for being able to estimate the total cost of the disease. 10 In Cost 313 (1994) there is a broad discussion on valuation methodologies concluding (page 69) that WTP estimates should be complemented with net production losses, unless this element specifically has been included by the respondents in their WTP values.
|