|
Nature & Environment 2003 – Theme: Water in DenmarkContentsWater in Denmark – introduction Clean groundwater – an endangered privilege Oxygen depletion and nutrients Oil pollution – a threat to the marine environment Foreword
Connie Hedegaard Clean water is an important natural resource, and the quality of water is essential to people as well as nature. Clean water ranks highly on the Danish Government's environmental policy agenda. Of the total expenditure on environmental initiatives in Denmark, the actions relating to water account for approx. 25 per cent, or an annual approx. euro 1.3 billion. Great efforts are being made to protect the aquatic environment against the spread of chemicals harmful to health and the environment. None of the wastewater from Danish wastewater treatment plants is discharged without prior treatment. However, efforts to reduce runoff of nitrogen and phosphorus are still required in order to curb the problems of oxygen depletion in coastal marine waters. Developments are, however, moving in the right direction. With the Action Plans for the Aquatic Environment I and II, agriculture's discharges of nitrogen and phosphorus have been reduced by 50 per cent. With the Action Plan for the Aquatic Environment III, we are continuing and expanding these efforts with requirements for further reductions in nitrogen discharges, and we are also taking the first steps towards reducing agricultural discharges of phosphorus, for example by establishing spray-free buffer zones along lakes and watercourses. Research and development of new technology is another new focus area afforded high priority by the Action Plan III. In partnership with the agricultural sector, the Government has allocated approx. euro 20 million to research, for instance into the reduction of odour nuisances from livestock farming. Moreover, a separate research programme has been established, aiming at enhancing organic farming practices. As regards both the scope of efforts and the depth and the commitment to overall objectives, the Action Plan III takes us an important step further towards the protection of our common asset. Danish measures are targeted, and – in line with the EU Water Framework Directive – focus on areas where nature and the environment are in need. I am convinced that the Action Plan will improve protection of the aquatic environment in every one of the ten years over which the Plan is to run. Water in DenmarkPeople use water every day – for drinking, for cooking and for washing. The quality of the water is essential to health. In Denmark, almost all drinking water comes directly from groundwater aquifers. Water is also an important element of nature, and a habitat for many animals and plants. People use water bodies for recreational activities, and property prices very clearly reflect people's willingness to pay extra to live in a house that overlooks the water. However, clean water is not an inexhaustible resource. Therefore, it must be protected, both by limiting water consumption, and by protecting water against pollution. All aquatic areas are linked together in a hydrological cycle. Through precipitation, leaching, flow, and evaporation, water moves continuously between the groundwater, the soil, the lakes and watercourses, the sea, glaciers and ice caps, and the atmosphere. Water in rivers around the world is exchanged about 22 times every year. Human activity in one part of the cycle affects the cycle as a whole. For instance pollution of the groundwater caused by agricultural use of fertilisers and pesticides affects lakes, watercourses and marine waters as well. Human impact on aquatic areas was massive throughout the last century. Aquatic areas were drained, many small waterholes disappeared, and streams were straightened. Moreover, surface and groundwater resources were polluted by sewage from private households and industry, as well as nutrient loss and pesticides. This has had a negative impact on animal and plant species, and it has reduced the groundwater resources available. However, in recent years there has been a reverse in this development. Better wastewater treatment and reduced consumption of phosphorus and nitrogen by agriculture have contributed to improving the quality of water. And Danes are now much better at saving water. Today, Danish households use only about three quarters of the water they used ten years ago. This positive trend is being followed up in the new Action Plan for the Aquatic Environment III, with its broad approach to improving the aquatic environment and nature and the relationship of farmers to their neighbours. Action Plans for the Aquatic Environment I and II focused in particular on regulation of nitrogen discharges from agriculture. In future, the EU Water Framework Directive – which took effect in 2000 and was transposed into Danish law in 2003 – will play an important part in the protection of the aquatic environment. The Water Framework Directive aims at safeguarding watercourses, lakes, transitional waters (estuaries, fjords etc.), coastal waters, and groundwater. Another initiative contributing to the positive development is the NATURA 2000 network of bird protection areas and habitats. The action plan for biodiversity and nature protection in Denmark 2004-2009 also includes measures to preserve and improve the aquatic environment. This booklet focuses on the initiatives launched by the Danish Ministry of the Environment to protect water. The booklet also describes the state of Danish water bodies and some of the most serious threats to the quality of water by reviewing 21 selected indicators that show developments over a number of years. All the Danish Ministry of the Environment's 70 indicators illustrating the state of nature and environment are available on the Danish EPA website: www.mst.dk
Clean groundwater – an endangered privilegeIn Denmark drinking water can be abstracted directly from the groundwater. It is clean, and tastes good. But there is no guarantee that this will always be the case. At some locations, the groundwater has been polluted. The quality of water in the groundwater aquifers is monitored closely, and continuous efforts are being made to protect the aquatic environment in order that clean drinking water can also be provided in the future. The latest initiative was the adoption of the Action Plan for the Aquatic Environment III. In Denmark almost all drinking water is abstracted from groundwater resources. In the 1990s Denmark used almost 1 billion m3 of drinking water each year, corresponding to the water volume of the ten largest lakes in Denmark. In 2002 consumption of drinking water amounted to approx. 650 million m3. About one-third is consumed by private households, one-third by agriculture and horticulture, and one-third by industry and institutions. In the last decade the consumption of water has fallen by 40 per cent. In densely populated urban areas, for instance the cities of Copenhagen, Århus, and Odense, the water abstracted exceeds the volumes recharged to the groundwater aquifers. Therefore the watercourses are drying out in the summer, and the groundwater table is decreasing. From groundwater to drinking water Raw groundwater can be used directly for drinking water purposes at only very few locations. Before drinking water is supplied to consumers, it is aerated and filtered in order to remove most of the naturally occurring iron, manganese, and methane. Most often, aeration and filtration is sufficient treatment. Danes live on top of the water they drink. Waterworks are located throughout Denmark. This decentralised structure presents a lot of advantages: it contributes to good groundwater and drinking water quality in large parts of the country, and it allows consumers to keep an eye on the quality and to identify possible solutions to pollution threats. Most of the 3,000 large waterworks operate with borings that reach the groundwater 20-200 metres below the surface. In addition, approx. 70,000 private wells or borings, each supplying less than 10 households, abstract water from layers of sand, gravel, and limestone close to the surface. Denmark wants clean groundwater – not treated groundwater Denmark wants to produce drinking water from unpolluted groundwater. This was the attitude of previous governments – and it still applies. However, waterworks find it increasingly difficult to abstract high-quality raw water from the subsoil. The major contributors to groundwater pollution are nitrate, pesticides, and organic solvents. Nitrate and pesticides come from cultivated fields, gardens, green and built-up urban areas, golf courses, and roadsides. Organic solvents come from old waste dumps, dry cleaning establishments, and industrial sites. Over the last 15 years, more than 700 waterworks have closed down because the quality of the raw water had become unacceptable. Danish water policy is based on prevention and implementing measures at source. Of course cleaning is just one of a broad range of options available when identifying solutions to a specific pollution problem. But it should not be the first choice of the waterworks when faced with polluted borings. In cases where it is neither technically nor economically feasible to replace the polluted groundwater by clean groundwater, treatment can be a solution to the specific pollution problem.
Over the last decade, water consumption has fallen by 40 per cent, in part because of green taxes. The figure shows total water abstraction and consumption broken down by common waterworks, commercial irrigation, and industry Source: Geological Survey of Denmark and Greenland The indicator shows the volumes of groundwater abstracted in Denmark since 1989, broken down by three main types: common waterworks (i.e. waterworks supplying at least 10 properties), commercial irrigation, and industry. Over the last decade, the total consumption of groundwater has fallen by almost 40 per cent. In 2002 the total volume of groundwater abstracted was 653 million m3, or somewhat less than in 2001. The pale green section of the column indicates that, of the total volumes abstracted, 410 million m3 was used for drinking water purposes, thus continuing the almost constant fall in private consumption since 1989. 98 per cent of drinking water is abstracted from groundwater aquifers, and the remaining 2 per cent from surface water. The fall is partly due to green taxes on the price of water – an efficient water-saving incentive. With the implementation of the EU Water Framework Directive, a number of new environmental targets for groundwater must be introduced in Danish law. When setting the targets, the entire hydrological cycle, i.e. the impact of groundwater on other parts of the hydrological cycle, is considered. For instance the magnitude of the impact on surface water in watercourses and lakes should not prevent compliance with the environmental targets set for groundwater.
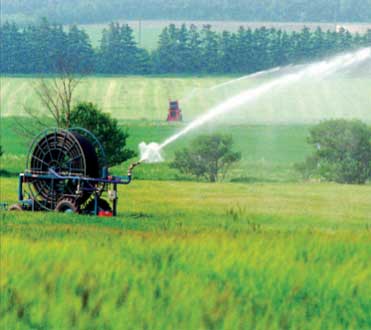
The figure illustrates the exploitable groundwater resources and how they are used. In densely populated areas and in areas of light soil requiring extensive irrigation, the water is used more quickly than the aquifer recharge rate. Source: Geological Survey of Denmark and Greenland A new survey of the groundwater available for drinking water purposes estimates 1.0 billion m3 water is available per year. In earlier calculations this figure was 1.8 billion m3 per year. However, this does not indicate that the volumes available for drinking water, for instance, are smaller than before. What it does indicate is that it is now possible to include the entire freshwater cycle in the calculations. Thus, the survey assumes a maximum allowable magnitude of impacts on watercourses in relation to the existing objectives. This assumption forms the basis of the calculation of the maximum groundwater abstraction. Around large cities, the volumes of water abstracted today exceed the exploitable groundwater resources. In Northern Sealand and around Copenhagen, the groundwater resources are being over-exploited by almost 80 million m3/year; on Funen by almost 10 million m3/year and; in Eastern Jutland by approx. 30 million m3/year. At some locations in the Copenhagen area, more than three times the exploitable resources are being pumped up. These figures result from the fact that the calculation is based on environmental targets that do not fully reflect the simple fact of nature that, when large volumes of water are abstracted, the water volumes available to safeguard recreational and natural interests are reduced. Moreover, some of the upper groundwater aquifers are so contaminated that they cannot be used for a number of years. Pollution of the upper groundwater levels increases the need to base water supply on deeper groundwater. Therefore, in the densely populated areas around Copenhagen, Odense, and Århus, and on light soils in Central and Western Jutland where field irrigation is required, the volumes of water abstracted exceed the water recharged to the aquifers. Water abstraction, and abstraction for irrigation in agriculture in particular, depends largely on the climate, and therefore the volumes pumped up vary greatly from one year to the next. In 2002 abstraction for irrigation was modest, and in the areas in Southern Jutland and in Ribe and Ringkjøbing counties, where the need for field irrigation is considerable, the degree of exploitation was well below 100 per cent. In dry seasons, when the need for field irrigation is large, for instance in 2003, the degree of exploitation increases considerably, to about three times as much. Groundwater and pollutionGroundwater in Denmark is surveyed and monitored in groundwater monitoring programmes, including upper and lower groundwater levels and control by waterworks of abstraction wells. Most of the groundwater monitored predates 1990. Organic micro-pollutants Nitrate As a result of the Action Plan for the Aquatic Environment I, adopted 1987, the content of nitrate in upperlevel and younger groundwater sampled in sandy catchment areas has decreased, while in clayey catchment areas, the nitrate content has not declined. About 75 per cent of the abstraction wells contain less than 1 mg nitrate/l, and in only 1.1 per cent the content of nitrate exceeds the 50 mg/l limit value. This is because abstraction wells suffering from excess nitrate will often be replaced by deeper borings, thus avoiding the polluted groundwater. In the groundwater monitoring programme, about 16 per cent of the well screens show nitrate above the MAC (maximum admissible concentration) applying to drinking water. The nitrate problem is greatest in the "nitrate belt" (Northern Jutland, Viborg and Århus) dominated by sandy soil. Also upper-level groundwater in other sandy soils shows nitrate concentrations largely exceeding the MAC. Inorganic trace elements Inorganic trace elements occur naturally in groundwater. Where the acidity (pH) of groundwater is low, aluminium may occur in high concentrations. In aquifers without oxygen, arsenic may be abundant in high concentrations. The occurrence of inorganic trace elements may also be due to contamination, or lowering of the groundwater level etc. High concentrations of nickel present a local and increasing problem. In large waterworks with water treatment and efficient sand filters, inorganic trace elements will be partly removed, and concentrations exceeding limit values in the groundwater abstracted will, thus, not always lower the quality of the drinking water. For individual wells and small common waterworks without water treatment, however, the trace elements may constitute a problem to the quality of the water. Organic micro-pollutants, for instance chlorinated solvents and other typical industrial pollutants, have been found in almost two-thirds of the well screens in the groundwater monitoring areas. In abstraction wells, organic micro-pollutants were found in more than one out of five wells. However, the concentration is below the MAC for drinking water in most of the groundwater abstraction wells, as well as in most well screens in the groundwater monitoring areas. Pesticides The number of well screens with pesticides and their metabolites in the groundwater monitoring areas was approximately 27 per cent in both 2001 and 2002. The number of well screens with concentrations above the MAC (0.1 μg/l) was about 9 per cent. Over the period 1990-2002 pesticides have been found in almost half of the well screens, indicating that much of the groundwater is vulnerable to this pollution threat. In the period 1997-2002, pesticides were found in about 30 per cent of the abstraction wells. During the same period, the number of wells with concentrations exceeding the MAC declined from approx. 10 to around 7 per cent. In 2002 pesticides or their metabolites were detected in more than 50 per cent of the shallow (0 to 20 metres below ground surface) groundwater abstraction wells sampled. As in groundwater-monitoring areas, their occurrence decreases with increasing depth. This indicates that today the upper groundwater layers are severely affected by pesticides. A 2002 survey shows that about 36 per cent of the water abstracted contained pesticides. Waterworks analyse the raw water from wells affected by pesticides more often, and therefore this figure may be somewhat exaggerated. Only about 4 per cent of the groundwater abstracted contained pesticides and their metabolites exceeding the MAC, and this may indicate that the waterworks have closed a large number of wells with concentrations above the MAC. Source: Geological Survey of Denmark and Greenland
The overall quantities of pesticides sold in Denmark fell significantly in the period 1981-2002. The green columns show that sales decreased by one-third. The annual quantities of pesticides sold to agriculture – the blue columns – more than halved. Source: The Danish EPA The indicator shows the trend in sales of pesticides in the period 1981-2002. The green columns represent the total quantity of all types of pesticides (plant protection products and biocides, including wood preservatives) sold in the period. The blue columns are agriculture's share of the pesticides sold. From 1984, when sales peaked, to 2002, annual sales of pesticides to agriculture fell from 6863 tonnes to 2868 tonnes, a 58 per cent decrease. In this period application frequencies fell from 3.2 to 2.04, or by 33 per cent. Application frequencies indicate how many times per year the pesticides sold can be applied to agricultural land, when used in standard doses. Application frequencies thus reflect the application intensity by agriculture, and are indicators of the impact on the environment. Calculations show that the consumption of pesticides fell more than the application frequency. The reason is that the pesticides used today are effective in much smaller doses, thus reducing consumption, but not necessarily the impact on the environment. Part of the explanation for the general decrease in sales of pesticides is the voluntary agreement between the local, regional, and state authorities, to introduce pesticide-free weed control in public areas. Since 1995 consumption at local level has fallen by 74 per cent, at regional level by 79 per cent, and at state level by 42 per cent. The Government's Pesticide Plan 2004-2009 sets the goal of reducing application frequencies to 1.7. The Plan also focuses on horticulture and fruit growing, and cultivation guidelines and catalogues of methods to reduce the use of pesticides are being prepared. The objectives of the Plan also include the use of pesticides in private gardens.
Afforestation protects the groundwaterThe Government has decided that the forest area in Denmark should be increased to reach a forest cover of 20-25 per cent in the course of a tree generation (80- 100 years). Generally, the quality of the groundwater generated below forests is good. As compared to agricultural land, forests are characterised by a permanent plant cover, limited use of fertilisers, and no or very limited use of pesticides. In forests, runoff of nitrogen is less than 5 kg/ha/year. In 2001, the average runoff of nitrogen from agriculture was 76 kg/ha. This shows that groundwater protection is a very important element in afforestation policies. More forest To reach the goal of a 20-25 per cent forest cover in Denmark within the next 80-100 years, approx. 4,500 ha of new forest must be planted every year. Today, forests are being planted on only half of this area. In the 1990s new forest was planted at an average of 1,700 ha/year. In 2000 this figure was 3,000. The rather poor achievement is a result of the high costs of both private and public afforestation, and therefore it is necessary to consider how these costs can be reduced, and whether, beside state funds, EU funds and private unsupported afforestation efforts, other independent or supplementary financial sources can be mobilised. The afforestation objectives are based on long-term efforts, and there is time to further consider aspects of both costs and funding. Close to urban areas Most of the forests are being planted at private initiative, but the Danish Forest and Nature Agency has initiated a number of afforestation projects, especially around large towns, and sometimes in cooperation with local authorities and waterworks. State afforestation programmes aim at areas close to urban areas and, preferably, at locations where groundwater interests should be safeguarded. Source: Danish Forest and Nature Agency and Forest and Landscape Denmark
Pesticides or their metabolites are found in one out of three abstraction wells analysed. The indicator shows findings of pesticides in abstraction wells. The indicator shows the development of findings of pesticides and their metabolites in abstraction wells. The EU limit value for pesticides and their metabolites in drinking water is 0.1 mg/l. This limit value has been maintained on the basis that pesticides or their metabolites must not occur in drinking water. The limit value is not based on evaluations of impacts on health. In recent years the number of wells polluted by pesticides has remained almost constant. Pesticides are found in about one-third of the abstraction wells, and in almost one out of ten wells the levels exceed the MAC value for drinking water. The number of polluted wells has not increased because of increasing pollution, but rather because analyses now include more pesticides and metabolites than previously. When analysis programmes are revised the magnitude of impacts will probably therefore increase. The aim is that water abstraction will continue to be based on clean groundwater that does not need special treatment. The pesticides and metabolites occurring most often in abstraction wells are substances that are already banned in Denmark and have not been marketed for the last 8-10 years. The approved pesticides used today are monitored in the "Early Warning" system, under which risks of leaching of approved pesticides into the groundwater are assessed.
Abstraction of drinking water from small abstraction plantsIn 2004 the Geological Survey of Denmark and Greenland (GEUS) completed a survey of pesticide pollution of small waterworks, i.e. plants supplying less than 10 properties. The small plants are either borings, wells, or borings in wells. Approx. 71,000 properties in Denmark are supplied with water from small water supply plants – supplying about 3 per cent of the overall quantities abstracted for drinking water purposes. In the study, four counties and GEUS analysed the water in more than 600 small water supply plants for the content of approx. 30 pesticides and their metabolites. The plants were also analysed for bacteria and nitrate. Results of the study The study shows that many of the waterworks are polluted with pesticides. One or several pesticides and their metabolites were found in 58 per cent of the plants surveyed. In 36 per cent the 0.1 mg/l MAC value for drinking water was exceeded. The metabolite BAM and the pesticide group triazines were found most frequently. Most of the substances found are already banned in Denmark. In addition, the groundwater is protected by restrictions on the use of some of the other pesticides found in the survey. The 0.1 mg/l pesticide limit value is based on a general precautionary principle, and also on the objective that pesticides must not occur in groundwater. The value is not based on health considerations. Another result of the survey is that other pollutants than pesticides are also contaminating many small water supply plants. The nitrate limit value is exceeded in 25 per cent of the waterworks, and one or several indicator parametres for bacteria are exceeded in 50 per cent. As opposed to pesticides, the limit values for nitrate and bacteria are based on health considerations.
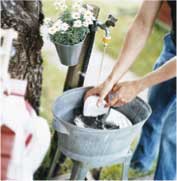
Causes of pollution The Danish EPA has assessed that the small waterworks are often in very poor condition and that leaks in borings and wells may contribute to the extent of pollution. The Agency also finds the problems are aggravated by other sources of pollution, for instance spraying and cleaning in farmyards or leaking sewage pipes located close to the waterworks. Managing the problems The Danish EPA has contacted Local Government Denmark with the aim of extending local inspection activities to include pesticides. The possibility of setting a maximum price for connection to waterworks is also being discussed. The Danish EPA will continue the investigation work launched in 2003, examining the possibilities for managing the problems of private wells and borings. Work will also include assessment of the technical solutions available to improve the quality of water, for instance treatment of water from private borings. Source: Geological Survey of Denmark and Greenland and the Danish EPA Oxygen depletion and nutrientsImplementation of the Action Plans for the Aquatic Environment I and II has improved the state of fjords and marine waters. Most significant is the marked decrease of the nutrient load from point sources resulting from improved wastewater treatment. However, the additions of phosphorus and nitrogen from the open country are still too large. The Action Plan for the Aquatic Environment III was therefore adopted in March 2004. Most Danish fjords and coastal areas do not exhibit the environmental quality decided by the regional authorities. Fulfilment of environmental objectives is mainly prevented by oxygen depletion, and extensive occurrences of algae, and plankton algae. Generally, this picture has remained unchanged in recent years. Additions of nutrients
In 2002 about 88,500 tonnes of nitrogen and 2,300 tonnes of phosphorus ended up in the sea from the open country via watercourses and lakes. Most of the nitrogen and phosphorus originates from agriculture, as nutrients are released from the application of fertilisers and manure, and from evaporation of ammonia from stables. In the period 1985-2002, runoff of nitrate and phosphorus from agriculture into the aquatic environment was reduced by almost 50 per cent. However, a corresponding decrease in impacts on the aquatic environment cannot be traced, since the changes in additions vary greatly from year to year. Runoff of nutrients from the soil depends on agricultural practices, the amount of fertilisers/manure applied to fields, and the soil characteristics. Nutrients also come from so-called point sources, such as fish farms, water treatment plants, industry, and scattered buildings. In 2002 additions of nitrogen to fjords and the open sea from point sources was only one third of the 1991 level, and for phosphorus, the fall was even greater. The occurrence of oxygen depletion indicates the size of the nutrient additions, i.e. of phosphorus and nitrogen – but weather conditions are also important. In the two dry years 1996 and 1997, the nutrient load in open marine waters was reduced, and oxygen conditions were generally good. In 1998, with high precipitation and resulting large nutrient additions, the open waters suffered from major oxygen depletion. Future efforts The Action Plan for the Aquatic Environment III provides for a broad range of efforts to curb nutrient additions from watercourses into fjords and marine waters, including a tax on phosphorus, voluntary relocation of set-aside land along watercourses and lakes, winter-green fields, and financial support for research aiming at strengthening pollutionreducing technologies and organic farming practices. The restoration of the river Skjern Å is one example of large-scale and targeted efforts to improve the state of the environment in Ringkjøbing Fjord. Besides improving the quality of the water in the river and the fjord, the restoration has also created a valuable nature reserve, the size of the Danish island Anholt.
The nitrogen surplus in agricultural land almost halved in the period 1985-2002, and, thus, releases of nitrogen to the atmosphere, the soil and the water fell, primarily as a result of reduced additions of nitrogen to fields by agriculture in the form of fertilisers, manure, and sludge. Source: Danish Institute of Agricultural Sciences The indicator shows the changes in the nitrogen balance in fields throughout Denmark 1985-2002. Nitrogen additions come from, for instance, fertilisers, manure, and sewage sludge. Nitrogen is removed, for instance, by crops. The difference between addition and removal is the nitrogen surplus. Nitrogen loss takes place through ammonia evaporation, denitrification – i.e. soil bacteria transforming nitrate to airborne nitrogen, runoff, or by accumulation of nitrogen in the soil. The total additions of nitrogen to fields fell from about 750,000 tonnes in 1985 to 528,000 tonnes in 2002. Annual quantities removed have remained almost constant at about 300,000 tonnes, depending on the composition of crops and the conditions of growth in the period. The nitrogen surplus has, thus, fallen from about 420,000 tonnes to 235,000 tonnes in the period – or by approx. 44 per cent. The 1987 Action Plan for the Aquatic Environment I, the 1991 Action Plan for Sustainable Agriculture, and the 1998 Action Plan for the Aquatic Environment II were all targeted towards better utilisation of the nitrogen additions. These efforts have enabled us to reduce the consumption of fertilisers, and, thus, total additions to fields considerably, without significantly affecting the yield.
In the period 1985-2002 the phosphorus surplus in agricultural fields almost halved. This means a smaller risk of phosphorus accumulation of the soil and loss to the surrounding environment, primarily because agriculture's additions of phosphorus in the form of fertilisers, manure and sludge has been reduced Source: Danish Institute of Agricultural Sciences The indicator shows the development of the phosphorus balance in fields in the period 1985- 2002. Phosphorus additions come from fertilisers, manure and sewage sludge. Phosphorus is removed during harvesting of crops. The difference between additions and removal is the phosphorus surplus. Total additions of phosphorus to fields fell from about 108,000 tonnes in 1985 to 76,000 tonnes in 2002. In this period, annual removed quantities varied between about 47,000 and 61,000 tonnes, depending on the composition of crops and the conditions of growth. Thus, the phosphorus surplus fell from approx. 54,000 to 28,000 tonnes in the period, or by about 48 per cent. Excess additions mean that phosphorus accumulates in the soil, and there is a risk of soil saturation with phosphorus. The loss of the surplus phosphorus – through surface run-off and erosion, and through leaching and drainage water – to the aquatic environment is limited. Action Plans for the Aquatic Environment I and II did not set out measures to reduce the consumption of phosphorus, apart from the restrictions on the number of animal units per area of individual farm holdings. Even if the consumption of phosphorus in fertilisers and, thus, the overall additions to the fields, has fallen considerably, excess phosphorus is still being added, especially when manure is used to fertilise the area. The Action Plan III aims at halving the phosphorus surplus by the year 2015, among others by crop-free buffer strips along watercourses and lakes.
The indicator shows that the consumption of nitrogen and phosphorus in fertilisers increased sharply from the early 1960s to the early 1980s. From the first half of the 1980s to 2003 the consumption of nitrogen was halved, and consumption of phosphorus was reduced by approx. 70 per cent. Source: The Danish Plant Directorate The indicator shows the changes in the consumption of nitrogen and phosphorus from 1920-2003 (in `000 tonnes, and as five-year averages; for 2001-2003 annual figures are given). The consumption of nitrogen and phosphorus skyrocketed from the early 1960s to the beginning of the 1980s. From the first half of the 1980s to 2003, nitrogen consumption was halved, and phosphorus consumption was reduced by approx. 70 per cent. The 1987 Action Plan for the Aquatic Environment I, the 1991 Action Plan for Sustainable Agriculture, and the 1998 Action Plan for the Aquatic Environment II all provided for measures to reduce the consumption of nitrogen in fertilisers by setting requirements for better exploitation of nitrogen in manure, and by setting nitrogen standards for crops. The mid-term evaluation of the Action Plan II in 2000 shows that the consumption of fertilisers did not fall to the level envisaged, and the fertilisation rules were therefore tightened, for instance by tightening the permissible quotas for bread wheat, provisions for grassland, catch crops etc. The new Action Plan III sets out a broad range of measures to reduce consumption of both nitrogen and phosphorus. Action Plans I and II aimed only at reducing nitrogen, but the measures taken also had a derived effect on the consumption of phosphorus.
The indicators show the additions of nitrogen and phosphorus to the sea from watercourses and point sources (for instance fish farming, treatment plants and industry) from 1991-2002. Nitrogen and phosphorus additions from watercourses in the open country are larger than the quantities added from treatment plants and other point sources, which have fallen significantly. Source: National Environmental Research Institute The indicators show the additions of nitrogen (first figure) and of phosphorus (second figure) to the sea in the period 1991-2002, illustrating additions via direct point sources (for instance fish farming, treatment plants and industry, and scattered buildings) and from watercourses. The overall freshwater runoff to Danish marine waters is also indicated. In 2002 approx. 88,500 tonnes of nitrogen and 2,300 tonnes of phosphorus ended in the sea from the open country, via watercourses and lakes. Most of the nitrogen and phosphorus came from agriculture's discharges of nutrients in connection with fertilisation, and from evaporation of ammonia from stables and manure spreading. Also other sectors contribute to the pressure on the Danish aquatic environment. Wastewater from households and industry contains phosphorus and nitrogen, and atmospheric nitrogen from power plants and traffic is deposited on the ground and in water bodies. Since the Action Plan for the Aquatic Environment I was launched in 1987, overall discharges of phosphorus have been significantly reduced, whereas the reduction (adjusted for precipitation) of nitrogen has been less marked. Because of the high precipitation in recent years, and, thus, more extensive nitrogen runoff, the positive trend has not continued. The additions of phosphorus from the open country in recent years exceeded the quantities supplied by treatment plants and other point sources.
Marine water normally contains 10 mg oxygen per litre. Oxygen depletion is when the concentration of oxygen falls under 4 mg per litre. The blue line on the graph shows annual minimum concentration of oxygen in the south-western Kattegat for the period 1974- 2002. Source: National Environmental Research Institute The indicator shows the annual lowest concentration of oxygen in the bottom water of southwestern Kattegat from 1974 to 2002. When marine water is saturated with oxygen it contains 9-11 mg per litre, depending on temperature and salt concentration. The oxygen concentration of the bottom water is high during the winter, but falls during the spring and summer to a minimum level in the autumn. Oxygen depletion is when the oxygen concentration falls below 4 mg oxygen per litre, and extreme oxygen depletion is when oxygen concentrations fall to less than 2 mg oxygen per litre. Oxygen concentrations fall because oxygen use is greater than oxygen additions. These are first and foremost controlled by wind conditions, which cannot be changed. Large additions of the nutrients nitrogen and phosphorus to the sea cause algae to bloom. The use of oxygen depends on how much algae sinks to the seafloor and uses oxygen when decomposing. Therefore the risk of oxygen depletion can be limited by reducing additions of nutrients to the sea. However, this requires reductions in nutrient discharges by more countries than just Denmark. Cooperation with neighbouring countries also ensures that they reduce their nutrient additions.
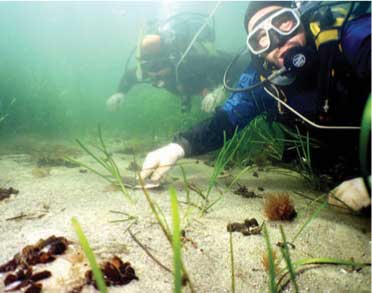
Large marine algae need light and their abundance in deep water increases the clearer the water is. The bars show the percentage of marine algae cover at a depth of 18.5 metres at Kim's Top stone reef in the Kattegat. The large cover percentage in 1996 and 1997 was due to dry weather that halved runoff of nitrogen from land, as shown by the green line. Source: National Environmental Research Institute The indicator shows the relationship between cover percentage of marine algae and runoff of nitrogen from Danish watercourses and point sources to the Kattegat. The bars show the total cover of algae at a depth of 18.5 metres on the stone reef Kim's Top in central Kattegat during August. The large cover percentage in 1996-97 and 2000-01 was due to dry weather that limited runoff of nitrogen from land significantly. The additions of nitrogen from Danish watercourses and point sources is shown by the green line. Large marine algae need light and their abundance in deep water increases the clearer the water is. The increased additions of nutrients affects all parts of the marine ecosystem. When the production of plankton is high, because of large additions of nutrients, the water becomes less clear and less light reaches the seafloor. This limits growth of eelgrass meadows and seaweed, as well as the depth at which they can grow. In years with lots of rain, when nutrient runoff is large, the total algae cover on stones is reduced, whilst it increases in dry years when the water is clearer. The extent of marine algae on deeplying stone reefs is therefore a fine barometer for the state of nature in the sea. If nutrient additions from land are reduced permanently, the plants will be able to grow in deeper water. A further improvement of the environment in the inner Danish waters requires reduced runoff from Danish sources in general. Furthermore, it requires cooperation with neighbouring countries in order to reduce nutrient additions to the sea. In Denmark, the Action Plans for the Aquatic Environment, most recently Action Plan III (adopted in spring 2004), are the primary sources of the targets and the framework for further reductions in nutrient runoff.
In specially designated areas, farmers can enter agreements where, in return for practising environmentally friendly agricultural production, they receive compensation for reduced productivity. The agreements apply for 5 or 20 years. The figure shows the development in number of agreements in the period 1993-2002, as well as the number of hectares covered by the agreements in total. Source: The Danish Ministry of Food, Agriculture and Fisheries This indicator shows the accumulated number of hectares covered by 5 and 20-year agreements in the agro-environmental schemes for the period 1993- 2002. The light green line shows the number of hectares covered by the agreements in total. The concrete environmental effect of the agreements depends on the size of the area covered by the agro-environmental schemes for agricultural production. The duration of the agreements also has an influence on the environmental effect. Subsidies for agro-environmental schemes were introduced as part of EU agriculture policy at the end of the 1980s. Since 2000, the agro-environmental schemes have been part of the subsidy scheme of the EU Rural Development Programme. The agro-environmental schemes have primarily been developed in order to protect the aquatic environment, but they are also intended to help grass and nature areas. In 2003, regard for the environment has been increased further and a large number of measures have been taken to simplify the scheme. Farmers can choose to:
Since 1997 the number of agreements seems to have stabilised at around 75,000 hectares. This is one of the reasons for introducing simplifications, so that the scheme becomes more attractive. The scheme is expected to help fulfil the objectives in the Action Plan for the Aquatic Environment III, as well as improve the quality of nature in the areas covered by the scheme.
Action Plan for the Aquatic Environment IIIIn March 2004 the Danish Government agreed with the Danish People's Party and the Christian Democrats on the Action Plan for the Aquatic Environment III. The agreement on the Action Plan for the Aquatic Environment III contains wide initiatives for improving the aquatic environment and nature, as well as farmers' relationships with their neighbours. The agreement has a long-term perspective and contains measures to be implemented over the next ten years.
Source: Danish Forest and Nature Agency Watercourses and lakesConditions for lakes and watercourses have been difficult for many years. Draining has significantly reduced them in number, and additions of wastewater have led to poor water quality. However, these developments have now been reversed. More lakes are being re-established and efforts to reduce additions of nutrients have born fruit so that transparency is now increasing.
The Danish landscape is criss-crossed by 35,000 kilometres of natural watercourses and 25,000 kilometres of artificial ditches and channels. Development, and especially agricultural development, has meant that watercourses have been changed significantly. In order to dry out fields, extensive drainage has been carried out, and many watercourses have been changed, straightened, or dug into pipes. Draining is promoted through cutting green crops and in some places dredging sand from watercourses. These actions have led to much poorer habitats for animals and plant life in 90 per cent of the natural watercourses. The condition of watercourses has been made even worse by discharges of wastewater and xenobiotic substances. More lakes Lakes are important for recreation and for nature. There are approximately 120,000 lakes larger than 100 m2 in Denmark, most of these ponds and marshes, with only about 2,500 larger than 1 hectare. For many years, the number of lakes has been falling as a result of agricultural and urban development. However, this trend has now been reversed as the Protection of Nature Act now also covers smaller lakes. Furthermore, a number of lakes that previously had been drained have now been re-established.
Water quality now improving For many years the water quality in lakes has been very poor. This is due to large additions of the nutrients phosphorus and nitrogen, not least from urban wastewater. Large investments in reducing additions of nutrients have, however, born fruit and the water quality in watercourses and lakes is improving. Transparency illustrates the amount of plant plankton (algae or phytoplankton) and thus nutrients in water; and transparency is increasing, indicating a decrease in the amount of plant plankton.
Many small lakes and watercourses have disappeared from the landscape as a result of draining. The bar chart shows the trend in the area around Arreskovsø on Funen. Source: County of Funen Over the past 100 years, the extent of open watercourses on Funen has fallen dramatically because digging ditches and watercourses into pipes, and straightening watercourses, has made them shorter. For example, on the basis of old maps it has been calculated that the length of the watercourses in the catchment area for Hundstrup Å, a river in southern Funen, fell from about 174 kilometres in 1890 to about 97 kilometres in 1992. Draining of wetlands, etc. for cultivation has also had a great impact on the number and size of lakes and fjords on Funen. In the catchment area for Arreskovsø, a lake, the number of smaller lakes and waterholes has fallen from 276 to 65 over the past 100 years. This development has dramatically reduced the habitats for animals and plants. Looking at Denmark as a whole, today about 80 per cent of the total land area is affected by drainage, and only 4 per cent is covered by marshes, bogs, and water meadows. The natural interplay between watercourses and meadows, with periodical flooding of watercourses to fertilise meadows, only occurs in very few places in Denmark. The 1992 Protection of Nature Act has put a stop to direct drainage of small lakes and marshes, and now it is only possible to water fields with water extracted from the groundwater.
Since 1982, environmental concerns have been incorporated in the maintenance of public watercourses. In 1985, both bottom and bank vegetation was removed from half of the public watercourses. In 1996, only 7 per cent of watercourses were maintained in this way, whereas vegetation in more than half of the watercourses was maintained more carefully, or through cutting back vegetation. Gentler maintenance of watercourses provides more space for plant and animal life. Source: National Environmental Research Institute In 1982, the Watercourse Act was amended in order to include environmental interests. This meant the preparation of new provisions for management and maintenance of watercourses looked after by the public sector. Cutting back vegetation, for example, was not to be as extensive as previously, where all plant growth was removed at least once a year. The provisions have been laid down in regulations. Improvements are now primarily taking place in small watercourses, as environmental maintenance for the larger watercourses (county watercourses) had typically already made its mark before 1990. Changes to more gentle maintenance in municipal watercourses (smaller watercourses) mostly occurred somewhat later. In watercourses on Funen, 17 per cent of watercourses are maintained by the county, 28 per cent by municipalities, and the remainder (private watercourses) by landowners. In general, county watercourses are the largest watercourses. In 2000, only two of the 32 municipalities on Funen had not adopted new and more environmentally friendly watercourse regulations. The new maintenance approach for county watercourses has led to changes in both plant growth and animal life. There are now at least four times more trout, partly because there is better cover in which they can hide.
The figure shows the biological quality of watercourses in Denmark for the period 1999- 2002. The dark-blue and dark-green illustrate clean and physically varied watercourses (fauna classes 5, 6, and 7). From 1999-2002 there was a clear improvement with an increasing number of clean and physically varied watercourses. Source: National Environmental Research Institute Since 1999, the same network of stations in more than 1000 locations has been used to measure the Danish watercourse fauna index (DVFI). From 1999-2002 there was a clear improvement with an increasing number of clean and physically varied watercourses – fauna classes 5, 6, and 7. The proportion of watercourses unaffected, or only slightly affected, increased from just less than 35 per cent to more than 44 per cent in the period. The improvement in the biological quality of watercourses in the period 1999-2002 has meant that the number of targets in the national plan being met has increased from 39 per cent to 50 per cent. The improvements have been gradual and they have happened over the whole period. Improvements have also been throughout Denmark. In Jutland and on Funen the number of targets met increased from 43 per cent to 55 per cent, while on Sealand, Lolland and Falster the figure has improved from 27 per cent to 34 per cent. Improvements in the biological quality of watercourses are probably due to a combination of better water quality and improved physical conditions in watercourses. Animal life only reacts gradually to the better living conditions in watercourses, and in many cases it may take a long time before animals return to previously polluted stretches of watercourses. The explanations for much of the improvement in the fauna class in recent years should undoubtedly take account of the environmental initiatives carried out by municipalities and counties over many years. These efforts will be maintained in the future as the Government's Pesticide Plan for 2004-2009 designates 25,000 hectares of spray-free buffer zones along watercourses.
The phosphorus content in Danish lakes was almost halved in the 1990s. In recent years, this has made the water in lakes clearer and increased transparency. The environmental state of 70 per cent of Danish lakes remains, however, poor. Source: National Environmental Research Institute This indicator shows the trend in concentrations of phosphorus and transparency in 27 Danish freshwater lakes for the period 1989-2002. The concentration of phosphorus is stated as the annual mean value of total phosphorus in mg/l and transparency is stated as the summer average in metres. Phosphorus is the nutrient that most affects Danish lakes. Total discharges of phosphorus from 1989 to 2002 fell by two- thirds, and in the same period the concentration of phosphorus in Danish lakes was almost halved. When a lake is over-fertilised with phosphorus, production of plankton increases and the water loses clarity. The drop in the content of phosphorus in lakes has meant that they have become clear again. The average transparency for the summer period from 1989 to 2002 has increased from 1.41m to 1.61m and the biological state has been improved. The number of predatory fish such a pike and perch has increased, as has the capacity of zooplankton to graze down the amount of phytoplankton. Transparency has generally increased over the period, and the annual trend is towards the most unclear lakes becoming clearer. Furthermore, underwater plants (benthic plants) are becoming more numerous in the most polluted lakes. The reason this increase has not been more significant is primarily that large amounts of phosphorus have settled at the bottom of lakes, and these deposits are now only gradually being released. Targets for a specific lake are considered met when, amongst other things, a preset minimum requirement for transparency has been achieved. The number of environmental targets for lakes being met has increased from about 30 per cent to 50 per cent in the period. The reason for the low success rate is that additions and accumulation of nutrients are still too high. In this connection, the Government has set up a working group to look more closely at the possibilities to establish buffer zones around natural habitats vulnerable to ammonia, such as watercourses, lakes, and marshes.
The National Environmental Research Institute has examined water runoff from watercourses and precipitation (rainfall) in Denmark over the past 85 years. An increase in annual precipitation has led to an increase in the average runoff from all the watercourses examined. This close relationship demonstrates that climate changes will have consequences for the future ecological condition of Danish watercourses. Increases in the annual runoff and annual precipitation have been calculated over a period of 75 years at the 18 watercourse stations (converted to mm) and the five climate stations. Statistically significant changes (P < 5%) are shown with an asterisk after the figure. Source: National Environmental Research Institute The climate has a great influence on the ecological conditions in and around watercourses. The expected climate changes in Denmark are towards a warmer, wetter, and windier climate with more storms and more periods of high precipitation. In western Europe, winter precipitation has shown particular increases over the past 100- 200 years. The first effects measured were changes in the amount and rhythm of water (runoff), and these had already been demonstrated in the last century. Runoff from watercourses is part of the cycle of precipitation, evaporation, and water catchment. Runoff is unstable, following the same pattern as precipitation. The study by the National Environmental Research Institute of the trends in runoff and precipitation in Denmark over the past 85 years shows that precipitation in Denmark has been higher from October to March and lower in the other six months. This means wetter winters and drier summers. So, precipitation has increased in the part of the year where evaporation is least, and therefore there is a large surplus of rainfall, which mostly becomes surface runoff. This increases the probability of flooding in the winter months. However, despite the fact that there has generally been less rainfall in the summer months, there has not been less water in watercourses in these months. This is probably because of the buffer effect in the form of the increased formation of groundwater developing over the winter months and emptying into watercourses over the summer. If these changes in precipitation and runoff continue, there will be enormous consequences for drainage conditions in river valleys, leaching and loss of substances, and the ecological conditions in watercourses, lakes, and fjords. The changes will also impact Denmark's achievement of good ecological quality as required by the EU Water Framework Directive.
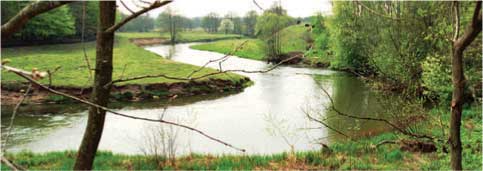
River restoration of Skjern ÅRingkøbing Fjord increased as the self-cleaning process in Skjern Å came to an end, the river receiving nutrients from the surrounding fields and carrying them into the fjord. For many hundreds of years, the Skjern Å valley and meadows have been an important foundation for the people living along the river. The fertile meadows of the river valley provided grass for livestock in the summer, and good hay for the winter. Whenever the river flooded, nutrients carried by the river were deposited on the meadows. In this way the river water was cleaned before running out into Ringkøbing Fjord, and the meadows were fertilised and provided good grazing. Sometimes, however, the river was unpredictable, and it flooded even in the summer, taking farmers' grass and hay. For this reason, people tried to control the river for hundreds of years. Dykes were built to prevent flooding in the summer, and irrigation and drainage ditches were dug. However, it was not until the 1960s that the river finally came under control in a grand project. Skjern Å itself was led into a newly dug, straight course, which channelled the water quickly out into the fjord. The unpredictable river had been tamed. An impressive piece of engineering which successfully fulfilled its purpose and soon created production dividends in the Skjern Å valley. Cornfields replaced grazing meadows. The river is restored Thirty years later, in 1998, the Danish Parliament decided that about half of the meadows that were drained in the 1960s and transformed into arable land should be re-established, and that Skjern Å should again wind its way through the landscape. Soon after the largest and most expensive restoration project in northern Europe was set in motion. The EU supported the project financially, as the restoration would create a valuable natural area of international significance. Agriculture would be offered replacement land, as the state would buy land behind the project area for exchange. Many voluntary agreements were made. Several landowners chose to keep their land in the river valley, however, while the state paid compensation for lost cultivation opportunities. The project was completed in 2003. A total of 43km of winding river had been dug and 1.3 million cubic metres of soil had been moved, enough to fill a convoy of trucks stretching from Skjern in Denmark to the southern Alps. Now, once again the sun shines over meadows. Birds have taken well to the new natural area. The broad meadows are being grazed by livestock, and offer a welcome to many meadow birds. The new natural area extends for 2200 hectares and pesticides and artificial fertilizers are banned in the area. This is not only of benefit to the water quality in the river and the fjord, but it is also good for the natural plant life in the area. Downside to the project However, as time went by, it became clear that there was a downside to the project. Plants, animals, and birds that had previously lived in the freshwater meadows disappeared. The drop in the water level meant that iron compounds came into contact with the oxygen in the air, forming ochre pollution, which in turn impacted life in the watercourse. Pollution in Source: Danish Forest and Nature Agency Oil pollution – a threat to the marine environmentIncreasing awareness of oil pollution in Danish waters has led to greater efforts by Denmark to prevent oil pollution at sea. A number of new initiatives have been put in place to ensure that Denmark is ready to respond effectively to oil spills, with the same capabilities as our neighbouring countries. Oil pollution at sea can threaten our marine environment. Ecologically important areas can be damaged, fish stocks and bird life can be affected, and our beach areas can become polluted. To combat oil pollution at sea effectively requires preventive initiatives at both the national and international levels, as well as a response to the actual oil discharges taking place on the open sea and in coastal waters.
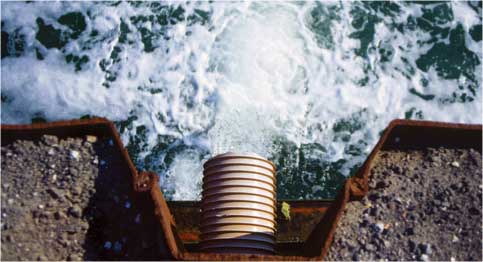
International initiatives International cooperation is the most important weapon in the fight against oil pollution. Denmark has actively participated in international forums to improve initiatives to prevent oil pollution. One example of a very significant international environmental achievement is the prohibition of the discharge of oil from ships in the North Sea, which entered into force in August 1999. The United Nations' International Maritime Organisation (IMO) granted the North Sea status as a "Special Area" with respect to pollution from ships, with oil pollution being an important element. This prohibition means that ships are only permitted to discharge material containing an oil concentration of no more than 15 mg/l, so that it is not visible. By 2006, oil discharges from oil rigs must be reduced by 15 per cent in relation to discharges in 2000, and the oil concentration in production water discharges must be reduced from 40 mg/l to 30 mg/l by the end of 2006. Another international environmental achievement was the introduction in July 1996 of an exclusive economic zone around Denmark. This means that Denmark can enforce international environmental protection regulations in relation to foreign ships up to 200 nautical miles from the coast. Denmark has also worked to ensure the adoption of regional regulations compelling ships to surrender oil waste in all harbours in the Baltic region. These regulations entered into force in the middle of 2000. Monitoring It is not possible to put a precise figure on the volume of oil illegally discharged in Danish territorial waters each year. The number of reported observations cannot be directly used as an indicator that there is a serious oil discharge problem in Denmark. In general, over half the observations involve either light oil/diesel, which evaporates, or false alarms caused by mud/algae/sea currents. However, the reduction in the number of reported observations suggests that some of the initiatives adopted to combat oil pollution have had a preventive effect. A number of illegal oil discharges continue to occur in the North Sea, despite the ban, leading to pollution of the west coast of Jutland.
This figure shows the volume of oil discharged from rigs in the North Sea between 1991 and 2002, divided into spills and production water. Source: The Danish EPA The indicator shows accidental oil spills and oil discharges in production water from Danish oil rigs in the North Sea for each year between 1991 and 2002. Production water contains traces of oil and chemicals. Denmark extracts oil and natural gas from approx. 40 rigs in the North Sea. Discharges of oil with production water have been increasing in recent years. This is due to the fact that the volume of production water, and hence the oil discharges, increases with the age of the oil fields. Under the OSPAR Marine Convention, covering the north eastern Atlantic Ocean, including the North Sea, the Skagerrak and the Kattegat, Denmark and the other oil-producing countries in the North Sea are committed to reducing oil discharges in production water by 15 per cent compared to 2000, by 2006. Apart from one large accident in 2000, spillage from Danish oil rigs in the North Sea is relatively constant. Spillage is primarily caused by minor incidents involving discharges of less than a tonne. Oil spillage is unintentional, and extensive effort is continually being made to reduce the risk of accidents. The accident in 2000 was caused by problems with the loading buoy in the South Arne Field.
The number of observed oil discharges in the North Sea rose during the 1990s. This increase was due to increased monitoring efforts. Between 1999 and 2002, the number of observed oil discharges fell Source: Admiral Danish Fleet This indicator shows how the number of observed oil discharges in Danish territorial waters has changed since 1980. The number of observed oil discharges has fallen in recent years, with the exception of 2002, when it rose. This trend is due in part to increased monitoring efforts, but also to the fact that the ban on discharging oil from ships has been extended to include the Skagerrak and the North Sea, so that all Danish marine areas are now covered. The increase for 2002 is due to an increase in the number of observations from foreign authorities, as part of the continuing expansion of cooperative marine environment monitoring initiatives with Sweden and Germany. The goal is to see further reductions in oil spills and discharges from ships in Danish territorial waters. Denmark is working at international level to secure common requirements for ships transporting oil.
Particularly sensitive sea areas (PSSA)If one or more countries wish to increase protection of their marine environments, they can apply to have a clearly defined area declared as a PSSA (Particularly Sensitive Sea Area). Approval of such areas is handled by the United Nations' International Maritime Organisation (IMO). The IMO has issued a resolution (A927(22)) containing a number of guidelines for the designation of PSSAs. According to the guidelines, an area must fulfil one or more of the following criteria in order to be designated a PSSA:
A PSSA designation makes it possible for a country to enact laws and regulations for the prevention, limitation and monitoring of pollution from ships. Such extra laws and regulations can, for example, govern the disposal of oil or other harmful substances, requirements that ships carry special equipment (e.g. on oil tankers), navigation guidelines (specification of navigation routes), or the installation of electronic traffic monitoring systems. Such areas are marked on nautical charts, so that ships entering them are made aware that they are navigating in a special area. Source: The Danish EPA
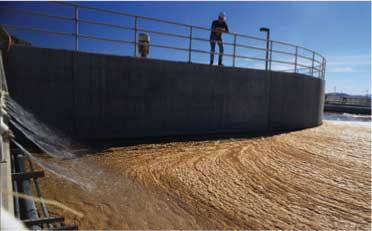
The Baltic SeaIn connection with the extensive oil pollution that occurred off the Danish island of Moen in 2001, agreement was reached that the Baltic countries should investigate what further measures could be introduced in the Baltic Sea to prevent similar accidents. One of the initiatives was to submit an application to the IMO, for the Baltic Sea (or parts thereof) to be declared a PSSA. Russia was opposed to such an application, but the other Baltic countries submitted a proposal to the IMO. The IMO Environment Protection Committee approved the application in principle in April 2004. The PSSA area in the Baltic Sea covers the Kattegat, Øresund (the Sound), and the Belts, and up to the Gulf of Bothnia in the north, but not the Russian areas off St. Petersburg and Klaipeda. Approval in principle by the Environment Protection Committee means that the IMO has recognised the areas as being particularly sensitive to impacts from maritime traffic and other activities in the area, and that there is a need for greater protection than in other areas. Denmark, in cooperation with the other Baltic countries (excluding Russia), will therefore present specific proposals for improvements to navigational security in the Baltic Sea as soon as possible, with the aim of having the area finally approved by the IMO in summer 2005. The measures that may be introduced in the Baltic Sea include: increased reporting obligations, greater monitoring of ships, improvements to existing route systems, pilotage in high risk areas, escorts for certain types of ships, and the designation of areas where ships are not permitted to sail. The Wadden SeaIn 2002, Denmark, the Netherlands, and Germany succeeded in having the Wadden Sea approved as a PSSA. The countries agreed at that time, that there was no need for further initiatives, but the need to promote maritime security will be further discussed regularly, up until the next trilateral government conference in 2005. Source: The Danish EPA Water use and recyclingWe have become better at recycling water. Wastewater treatment has become more advanced and effective. No wastewater is discharged untreated. We have also become better at saving water. Household water consumption has fallen by one quarter. Wastewater derives from households, industry, commercial enterprises, and institutions. Wastewater is treated in treatment plants, to break down pollutants to the point where they can no longer harm the environment. Treated wastewater is discharged into watercourses, lakes, and the sea, or it leaches into the ground. Improved wastewater treatment During the last 25 years, Denmark has extensively invested in an effective wastewater system based on sewers and wastewater treatment at treatment plants. Today, the majority of Danish properties are connected to sewage systems, and most household and industrial wastewater is directed through the municipal and private treatment plants before being discharged into the sea or watercourses. In 2001, the 29 largest and most advanced wastewater treatment plants treated almost half the wastewater in Denmark. Wastewater treatment has been drastically extended and improved so that today, treatment plants remove the majority of all aerobic organic matter, as well as phosphorus and nitrogen. Just under 60 per cent of wastewater received at municipal treatment plants comes from households and service industries, while the remainder comes from industrial enterprises. More than half the sludge from wastewater treatment plants is recycled. It is mostly used as fertiliser on fields.
Water consumption is falling During the last 10 years, household water consumption has fallen by one quarter. This has taken place in step with an increase in the price of water of 150 per cent. The correlation between increasing water prices and falling water consumption might be due in part to green taxes on water charges – an effective incentive to save water. Greater environmental awareness among the population might also be an important reason for the reduction in water consumption.
In 1989, each Dane used an average of approx. 170 litres of water a day. Consumption has now fallen to approx. 125 litres a day. At the same time, the average price of water has risen from less than DKK 14 to DKK 35 (euro 2.0-4.6) per cubic metre. The graph shows changes in water consumption and price. Source: Water supply statistics, Danish Water and Waste Water Association This indicator shows changes in household water consumption (litres per person per day) in relation to changes in the average water price paid by consumers (DKK per m3). Water consumption statistics exist for 1985 onwards. Water price statistics exist for 1993 onwards. The trend for 1993 to 2002 shows household water consumption has fallen by approx. one quarter. During the same period, water prices have risen by over 150 per cent, i.e. in 2002 one cubic metre of water cost two and half times as much as it did in 1993. Water prices are made up of a water discharge tax (41 per cent), VAT (20 per cent), green taxes (14 per cent), a variable water charge (12 per cent), a fixed charge (9 per cent), a fixed charge for wastewater (2 per cent), and a national charge for wastewater (2 per cent). The clear correlation between increasing water prices and the fall in household water consumption supports and confirms the effect of green taxes as an incentive to save water. Water prices may increase over the next few years as waterworks face continually increasing expenses, including compensation payments for restrictions on land use to protect groundwater.
In recent years, 87 per cent of wastewater has been treated mechanically, chemically, and biologically. Source: The Danish EPA This indicator shows how wastewater is treated at treatment plants in Denmark, divided into various types of wastewater treatment. The simplest type of treatment is mechanical treatment, in which primarily only organic matter is removed. Today, this type of treatment only takes place at small treatment plants. Larger treatment plants generally use the most advanced type of treatment, where wastewater is treated mechanically, biologically, and chemically. The figures from 1972 until today show that wastewater treatment has become progressively more advanced. In 1972, wastewater discharges were divided equally between untreated, mechanically treated, and mechanically/biologically treated wastewater. Today, no wastewater is discharged untreated, and 87 per cent of wastewater is treated at the most advanced treatment plants. This is largely due to the 1987 Action Plan for the Aquatic Environment. Before this plan was adopted, only approx. 10 per cent of the total volume of wastewater was treated at the more advanced plants. At international level, introduction of the Urban Wastewater Treatment Directive has not had great significance for Denmark, as most of the directive's requirements had been introduced in the first Action Plan for the Aquatic Environment. However, implementation of the directive has led to a greater number of tests at the large treatment plants, and in the future, the directive will make it necessary to increase the degree of treatment for organic matter at the smaller treatment plants.
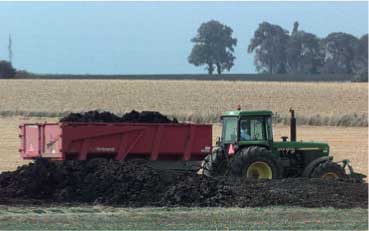
More than half the sludge from wastewater treatment plants is recycled. The majority of it is applied to agricultural land, some of it is incinerated and recycled as ash (e.g. in cement), and the remainder is stored. Source: The Danish EPA This indicator shows where sludge from wastewater treatment plants has ended since 1987, divided into three categories: Recycling, incineration, and long-term storage. In general recycling of sludge is achieved in a manner that it can be directly used as fertiliser on agricultural land, and it is transported directly from municipal treatment plants and applied to fields. Long-term storage covers both mineralisation of sewage sludge, and sludge that is landfilled. In the case of mineralisation, sludge is processed over a long period (10 years), so that it can subsequently be used on agricultural land, if it fulfils the quality requirements. Stricter sludge quality requirements have led to general uncertainty about recycling, resulting in the decline in recycling in recent years. If sludge quality is too poor, it is landfilled. Incineration has increased significantly since 1998. This increase is due to the fact that since 1998, a number of enterprises have taken delivery of sludge (the ash) for recycling in sandblasting agents and cement. In addition, the increase results from stricter limit values for organic environmental toxins and heavy metals for sludge applied to agricultural land. In 2002, 59 per cent of sludge was recycled – primarily as fertiliser on fields. In recent years, sludge quality has continually been improved. This is partly the result of voluntary phase-out initiatives from industry, for example, for nonylphenol. The goal laid down in Waste 21 of recycling 50 per cent of sewage sludge in 2004 has thus already been reached, despite the decline in recycling in recent years.
Industry pollutes no more than householdsIndustry is generally no worse than households in terms of the contamination of sewage sludge. Although there can be a strong, localised correlation between individual industries and contamination by heavy metals and/or xenobiotic substances. This is the conclusion from an investigation into the discharge of pollutants by industry. Under the investigation, sludge from 160 wastewater treatment plants was analysed, and the initiatives that have been introduced to reduce the discharge of pollutants, and hence their volumes in sewage sludge, were evaluated. The major part of pollutant quantities found in wastewater accumulate in the sludge as the wastewater is treated. Sludge quality has vital significance for how it can be disposed of or recycled. If the content of heavy metals and xenobiotic substances is sufficiently low, it can be used as fertiliser on fields or in forests. However, if sludge quality is too poor, the only disposal options are incineration or landfilling. In the analysis, the quality of sludge from the component of wastewater that derives from industry is compared with that from households in the catchment area for each treatment plant. The comparison makes it possible to see whether there is a difference in the content of heavy metals or xenobiotic substances in the sludge, depending on the relative proportions of wastewater the treatment plant receives from industry and households. The results show a weak trend whereby the concentration of copper and mercury falls as the proportion of wastewater from industry rises. At the same time, households are the biggest relative source of mercury in sludge. This is because enterprises are so well-regulated today by environmental approvals from counties and municipalities, that the remaining contamination derives from individual areas not yet subject to regulation, or from households. A few years ago, the large, heavy industries were responsible for a relatively large proportion of the contamination with xenobiotic substances in wastewater. Source: The Danish EPA
More informationMinistry of the Environment: Danish Environmental Protection Agency: National Environmental Research Institute: Geological Survey of Denmark and Greenland: Danish Forest and Nature Agency: Forest and Landscape Denmark: Danish Institute of Agricultural Sciences: Danish Plant Directorate: Danish Ministry of Food, Agriculture and Fisheries: County of Funen: Admiral Danish Fleet: Danish Water and Wastewater Association:
|