|
| Front page | | Contents | | Previous | | Next |
Nature & Environment 2003 – Theme: Water in Denmark
Oxygen depletion and nutrients
Implementation of the Action Plans for the Aquatic Environment I and II has improved the state of fjords and marine waters. Most significant is the marked decrease of the
nutrient load from point sources resulting from improved wastewater treatment. However, the additions of phosphorus and nitrogen from the open country are still too
large. The Action Plan for the Aquatic Environment III was therefore adopted in March 2004.
Most Danish fjords and coastal areas do not exhibit the environmental quality decided by the regional authorities. Fulfilment of environmental objectives is mainly prevented by oxygen
depletion, and extensive occurrences of algae, and plankton algae. Generally, this picture has remained unchanged in recent years.
Additions of nutrients
In 2002 about 88,500 tonnes of nitrogen and 2,300 tonnes of phosphorus ended up in the sea from the open country via watercourses and lakes. Most of the nitrogen and phosphorus
originates from agriculture, as nutrients are released from the application of fertilisers and manure, and from evaporation of ammonia from stables. In the period 1985-2002, runoff of
nitrate and phosphorus from agriculture into the aquatic environment was reduced by almost 50 per cent. However, a corresponding decrease in impacts on the aquatic environment
cannot be traced, since the changes in additions vary greatly from year to year. Runoff of nutrients from the soil depends on agricultural practices, the amount of fertilisers/manure applied
to fields, and the soil characteristics.
Nutrients also come from so-called point sources, such as fish farms, water treatment plants, industry, and scattered buildings. In 2002 additions of nitrogen to fjords and the open sea
from point sources was only one third of the 1991 level, and for phosphorus, the fall was even greater.
The occurrence of oxygen depletion indicates the size of the nutrient additions, i.e. of phosphorus and nitrogen – but weather conditions are also important. In the two dry years 1996
and 1997, the nutrient load in open marine waters was reduced, and oxygen conditions were generally good. In 1998, with high precipitation and resulting large nutrient additions, the
open waters suffered from major oxygen depletion.
Future efforts
The Action Plan for the Aquatic Environment III provides for a broad range of efforts to curb nutrient additions from watercourses into fjords and marine waters, including a tax on
phosphorus, voluntary relocation of set-aside land along watercourses and lakes, winter-green fields, and financial support for research aiming at strengthening pollutionreducing
technologies and organic farming practices. The restoration of the river Skjern Å is one example of large-scale and targeted efforts to improve the state of the environment in Ringkjøbing
Fjord. Besides improving the quality of the water in the river and the fjord, the restoration has also created a valuable nature reserve, the size of the Danish island Anholt.
The nitrogen surplus in agricultural land almost halved in the period 1985-2002, and, thus, releases of nitrogen to the atmosphere, the soil and the water fell,
primarily as a result of reduced additions of nitrogen to fields by agriculture in the form of fertilisers, manure, and sludge.
Source: Danish Institute of
Agricultural Sciences
The indicator shows the changes in the nitrogen balance in fields throughout Denmark 1985-2002. Nitrogen additions come from, for instance, fertilisers, manure, and sewage sludge.
Nitrogen is removed, for instance, by crops. The difference between addition and removal is the nitrogen surplus. Nitrogen loss takes place through ammonia evaporation, denitrification
– i.e. soil bacteria transforming nitrate to airborne nitrogen, runoff, or by accumulation of nitrogen in the soil.
The total additions of nitrogen to fields fell from about 750,000 tonnes in 1985 to 528,000 tonnes in 2002. Annual quantities removed have remained almost constant at about 300,000
tonnes, depending on the composition of crops and the conditions of growth in the period. The nitrogen surplus has, thus, fallen from about 420,000 tonnes to 235,000 tonnes in the
period – or by approx. 44 per cent.
The 1987 Action Plan for the Aquatic Environment I, the 1991 Action Plan for Sustainable Agriculture, and the 1998 Action Plan for the Aquatic Environment II were all targeted
towards better utilisation of the nitrogen additions. These efforts have enabled us to reduce the consumption of fertilisers, and, thus, total additions to fields considerably, without
significantly affecting the yield.
In the period 1985-2002 the phosphorus surplus in agricultural fields almost halved.
This means a smaller risk of phosphorus accumulation of the soil and loss to the surrounding environment, primarily because agriculture's additions of phosphorus in
the form of fertilisers, manure and sludge has been reduced
Source: Danish Institute of
Agricultural Sciences
The indicator shows the development of the phosphorus balance in fields in the period 1985- 2002. Phosphorus additions come from fertilisers, manure and sewage sludge. Phosphorus
is removed during harvesting of crops. The difference between additions and removal is the phosphorus surplus.
Total additions of phosphorus to fields fell from about 108,000 tonnes in 1985 to 76,000 tonnes in 2002. In this period, annual removed quantities varied between about 47,000 and
61,000 tonnes, depending on the composition of crops and the conditions of growth. Thus, the phosphorus surplus fell from approx. 54,000 to 28,000 tonnes in the period, or by about
48 per cent. Excess additions mean that phosphorus accumulates in the soil, and there is a risk of soil saturation with phosphorus. The loss of the surplus phosphorus – through surface
run-off and erosion, and through leaching and drainage water – to the aquatic environment is limited.
Action Plans for the Aquatic Environment I and II did not set out measures to reduce the consumption of phosphorus, apart from the restrictions on the number of animal units per area
of individual farm holdings. Even if the consumption of phosphorus in fertilisers and, thus, the overall additions to the fields, has fallen considerably, excess phosphorus is still being
added, especially when manure is used to fertilise the area. The Action Plan III aims at halving the phosphorus surplus by the year 2015, among others by crop-free buffer strips along
watercourses and lakes.
The indicator shows that the consumption of nitrogen and phosphorus in fertilisers increased sharply from the early 1960s to the early 1980s. From the first half of the
1980s to 2003 the consumption of nitrogen was halved, and consumption of phosphorus was reduced by approx. 70 per cent.
Source: The Danish Plant
Directorate
The indicator shows the changes in the consumption of nitrogen and phosphorus from 1920-2003 (in `000 tonnes, and as five-year averages; for 2001-2003 annual figures are given).
The consumption of nitrogen and phosphorus skyrocketed from the early 1960s to the beginning of the 1980s.
From the first half of the 1980s to 2003, nitrogen consumption was halved, and phosphorus consumption was reduced by approx. 70 per cent.
The 1987 Action Plan for the Aquatic Environment I, the 1991 Action Plan for Sustainable Agriculture, and the 1998 Action Plan for the Aquatic Environment II all provided for
measures to reduce the consumption of nitrogen in fertilisers by setting requirements for better exploitation of nitrogen in manure, and by setting nitrogen standards for crops. The
mid-term evaluation of the Action Plan II in 2000 shows that the consumption of fertilisers did not fall to the level envisaged, and the fertilisation rules were therefore tightened, for
instance by tightening the permissible quotas for bread wheat, provisions for grassland, catch crops etc. The new Action Plan III sets out a broad range of measures to reduce
consumption of both nitrogen and phosphorus. Action Plans I and II aimed only at reducing nitrogen, but the measures taken also had a derived effect on the consumption of
phosphorus.
The indicators show the additions of nitrogen and phosphorus to the sea from watercourses and point sources (for instance fish farming, treatment plants and
industry) from 1991-2002. Nitrogen and phosphorus additions from watercourses in the open country are larger than the quantities added from treatment plants and
other point sources, which have fallen significantly.
Source: National Environmental
Research Institute
The indicators show the additions of nitrogen (first figure) and of phosphorus (second figure) to the sea in the period 1991-2002, illustrating additions via direct point sources (for
instance fish farming, treatment plants and industry, and scattered buildings) and from watercourses. The overall freshwater runoff to Danish marine waters is also indicated.
In 2002 approx. 88,500 tonnes of nitrogen and 2,300 tonnes of phosphorus ended in the sea from the open country, via watercourses and lakes. Most of the nitrogen and phosphorus
came from agriculture's discharges of nutrients in connection with fertilisation, and from evaporation of ammonia from stables and manure spreading. Also other sectors contribute to the
pressure on the Danish aquatic environment. Wastewater from households and industry contains phosphorus and nitrogen, and atmospheric nitrogen from power plants and traffic is
deposited on the ground and in water bodies.
Since the Action Plan for the Aquatic Environment I was launched in 1987, overall discharges of phosphorus have been significantly reduced, whereas the reduction (adjusted for
precipitation) of nitrogen has been less marked. Because of the high precipitation in recent years, and, thus, more extensive nitrogen runoff, the positive trend has not continued. The
additions of phosphorus from the open country in recent years exceeded the quantities supplied by treatment plants and other point sources.
Marine water normally contains 10 mg oxygen per litre.
Oxygen depletion is when the concentration of oxygen falls under 4 mg per litre. The blue line on the graph shows annual minimum concentration of oxygen in the
south-western
Kattegat for the period 1974- 2002.
Source: National Environmental
Research Institute
The indicator shows the annual lowest concentration of oxygen in the bottom water of southwestern Kattegat from 1974 to 2002. When marine water is saturated with oxygen it
contains 9-11 mg per litre, depending on temperature and salt concentration. The oxygen concentration of the bottom water is high during the winter, but falls during the spring and
summer to a minimum level in the autumn. Oxygen depletion is when the oxygen concentration falls below 4 mg oxygen per litre, and extreme oxygen depletion is when oxygen
concentrations fall to less than 2 mg oxygen per litre.
Oxygen concentrations fall because oxygen use is greater than oxygen additions. These are first and foremost controlled by wind conditions, which cannot be changed. Large additions
of the nutrients nitrogen and phosphorus to the sea cause algae to bloom. The use of oxygen depends on how much algae sinks to the seafloor and uses oxygen when decomposing.
Therefore the risk of oxygen depletion can be limited by reducing additions of nutrients to the sea. However, this requires reductions in nutrient discharges by more countries than just
Denmark. Cooperation with neighbouring countries also ensures that they reduce their nutrient additions.
Large marine algae need light and their abundance in deep water increases the clearer the water is. The bars show the percentage of marine algae cover at a depth of
18.5 metres at Kim's Top stone reef in the Kattegat.
The large cover percentage in 1996 and 1997 was due to dry weather that halved runoff of nitrogen from land, as shown by the green line.
Source: National Environmental
Research Institute
The indicator shows the relationship between cover percentage of marine algae and runoff of nitrogen from Danish watercourses and point sources to the Kattegat. The bars show the
total cover of algae at a depth of 18.5 metres on the stone reef Kim's Top in central Kattegat during August. The large cover percentage in 1996-97 and 2000-01 was due to dry
weather that limited runoff of nitrogen from land significantly. The additions of nitrogen from Danish watercourses and point sources is shown by the green line.
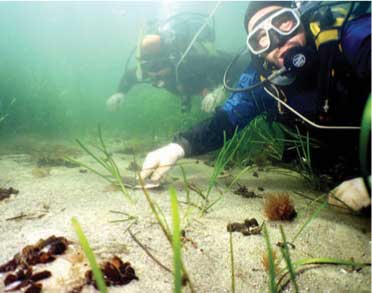
Large marine algae need light and their abundance in deep water increases the clearer the water is. The increased additions of nutrients affects all parts of the marine ecosystem. When
the production of plankton is high, because of large additions of nutrients, the water becomes less clear and less light reaches the seafloor. This limits growth of eelgrass meadows and
seaweed, as well as the depth at which they can grow. In years with lots of rain, when nutrient runoff is large, the total algae cover on stones is reduced, whilst it increases in dry years
when the water is clearer. The extent of marine algae on deeplying stone reefs is therefore a fine barometer for the state of nature in the sea. If nutrient additions from land are reduced
permanently, the plants will be able to grow in deeper water.
A further improvement of the environment in the inner Danish waters requires reduced runoff from Danish sources in general. Furthermore, it requires cooperation with neighbouring
countries in order to reduce nutrient additions to the sea. In Denmark, the Action Plans for the Aquatic Environment, most recently Action Plan III (adopted in spring 2004), are the
primary sources of the targets and the framework for further reductions in nutrient runoff.
In specially designated areas, farmers can enter agreements where, in return for practising environmentally friendly agricultural production, they receive
compensation for reduced productivity. The agreements apply for 5 or 20 years. The figure shows the development in number of agreements in the period 1993-2002, as
well as the number of hectares covered by the agreements in total.
Source: The Danish Ministry of
Food, Agriculture and Fisheries
This indicator shows the accumulated number of hectares covered by 5 and 20-year agreements in the agro-environmental schemes for the period 1993- 2002. The light green line
shows the number of hectares covered by the agreements in total. The concrete environmental effect of the agreements depends on the size of the area covered by the
agro-environmental schemes for agricultural production. The duration of the agreements also has an influence on the environmental effect.
Subsidies for agro-environmental schemes were introduced as part of EU agriculture policy at the end of the 1980s. Since 2000, the agro-environmental schemes have been part of the
subsidy scheme of the EU Rural Development Programme. The agro-environmental schemes have primarily been developed in order to protect the aquatic environment, but they are
also intended to help grass and nature areas. In 2003, regard for the environment has been increased further and a large number of measures have been taken to simplify the scheme.
Farmers can choose to:
- Reduce nitrogen additions
- Establish cover crops
- Manage grass and nature areas in an environmentally friendly way
- Establish extensive buffer zones
- Establish wetlands
Since 1997 the number of agreements seems to have stabilised at around 75,000 hectares. This is one of the reasons for introducing simplifications, so that the scheme becomes more
attractive. The scheme is expected to help fulfil the objectives in the Action Plan for the Aquatic Environment III, as well as improve the quality of nature in the areas covered by the
scheme.
Action Plan for the Aquatic Environment III
In March 2004 the Danish Government agreed with the Danish People's Party and the Christian Democrats on the Action Plan for the Aquatic Environment III.
The agreement on the Action Plan for the Aquatic Environment III contains wide initiatives for improving the aquatic environment and nature, as well as farmers' relationships with their
neighbours. The agreement has a long-term perspective and contains measures to be implemented over the next ten years.
- The Action Plan for the Aquatic Environment III runs to 2015 with evaluations in 2008 and 2011. When carrying out these evaluations, progress with regard to the general reduction
objectives will be assessed, and the need for further initiatives will be analysed.
- Reduction of excess phosphorus – objective of 50 per cent reduction. This will halve the 32,700 tonnes phosphorus in 2001/2002. The reduction will be achieved through a tax of
euro 0.5 per kg of mineral phosphorus in feed and through research on feed in the research programme.
- Reduction in discharges of phosphorus. This will be achieved through the establishment of close to 30,000 hectares of 10-metre crop-free buffer zones along watercourses and lakes
before 2009 and a further 20,000 hectares before 2015. The buffer zones will be established by voluntary relocation of set-aside land along lakes and watercourses.
- Nitrogen runoff from agriculture is to be reduced by a minimum of 13 per cent by 2015 compared to 2003 through setting aside land, improved feed utilisation, and the implementation
of the new EU agricultural reform. Furthermore, rules will be tightened on cover crops and on the utilisation of nitrogen content in livestock manure.
- Protection of particularly vulnerable nature against ammonia discharges from livestock farms, by designation of 300-metre protection zones around the particularly vulnerable nature
areas such as raised bogs, heaths, and dry grassland. Within this protection zone no expansion of livestock farms can take place if the expansion would lead to increased ammonia
discharges.
- The Government and agriculture together will allocate a total of euro 25.5 million to a research programme to improve knowledge on how odour nuisances from livestock production
spread, how they can be limited, and how technology can be developed to reduce discharges of ammonia and phosphorus.
- Euro 1.7 million will be allocated annually to a research programme to enhance organic agricultural production.
- Manure Action Plan. Distance requirements have been tightened for approval of livestock production close to neighbours, urban areas, or holiday-home areas etc, on the basis of the
recommendations made in the report from the "Nabogeneudvalg" (committee on nuisances experienced by neighbours).
- Further elements, including the setting of requirements for establishment of winter-green fields.
Source: Danish Forest and Nature Agency
| Front page | | Contents | | Previous | | Next | | Top |
Version 1.0 October 2004, © Danish Environmental Protection Agency
|