|
Pesticides Research no. 85, 2004 Effects of Pesticides on Bombina bombina in Natural Pond EcosystemsContents
PrefaceThis report is a part of the research programme "Effects of Pesticides on Ponds". The projects were funded by the Danish Environmental Protection Agency' s Research programme on Environmental effects of pesticides. The aim of the project was: To develop a model-based tool for evaluation of risk related to pesticide exposure in surface water. The tool must be directly applicable by the Danish Environmental Protection Agency (DEPA) in their approval procedure. As part of this goal, the project had to:
The project consisted of four subprojects with individual objectives. The sub-projects are listed in Table 1. Table 1. Sub-projects of " Effects of Pesticides on Ponds". Tabel i. Oversigt over delprojekter i "Effekter af pesticider i vandhuller".
The reports produced by the projects are:
The project was overseen by a steering committee. The members have made valuable contributions to the project. The committee consisted of: Jens Mossin Danish Environmental Protection Agency For this particular report the following persons are thanked. Lars Briggs and Anne Margrethe Andersen planned the investigation and conducted the field work and laboratory analysis. Anne Margrethe Andersen has thereby contributed significantly to the success of this investigation by taking a vital part of both the planning and the practical work. Anne Margrethe Andersen also participated in the analysis of the data and contributed with valuable discussions on the data. John Frisenvænge has carried out the statistical calculations with great skill. Erich Wederkinch, County of West Zealand and Ditte Guldager Christiansen kindly allowed the use of survival data on Bombina bombina. Helge and Agnes Andersen kindly allowed the investigators to use their house on Avernakø during periods of field work. We will always remember their hospitality. On the east coast of Fyn Svend Micleit and Ulrich Hansen of Taarup Strand Camping, Klintholm I/S and Harald Madsen of Stenagergaard kindly allowed entrance to ponds on their property, and are thanked for a good and constructive co-operation. The following farmers kindly allowed the investigators access to ponds on their property and gave thorough reports of use of fertilizers and pesticides: on the east coast of Fyn: Jørgen Sømark, manager of Juelsberg Estate; on Avernakø: Allan Carlsen, Axel Klingenberg, Ole Klingenberg, Helge Kristensen, Erna Vindeløv. The landowners are thanked for a valuable and positive co-operation in the process of collecting data. Jens Mossin, Per Rosenkilde, Peter Wiberg-Larsen, Leif Bisschop-Larsen, Henning Clausen and Claus Hansen gave valuable comments on the manuscript and constructive discussions. Per Rosenkilde has also helped by proofreading the report. Mariusz Rybacki of the Polish Academy of Science, Research Centre for Agriculture and Forest Environment in Poznan has made drawings of the ponds and surroundings on computer and is thanked very much for this work. Tyge Christensen, University of Copenhagen, Botanical Institute, department of Mycology and Phycology is thanked for assisting in the identification of algae to the level of genus and species. Poul Møller Pedersen, University of Copenhagen, Botanical Institute, department of Mycology and Phycology is thanked for orthographic corrections of names of species and genera of algae, bacteria and protozoa. Members of the Nordic Herpetological Society have helped greatly by catching and photographing Bombina bombina (identification for calculation of survival). The Danish Environmental Protection Agency is acknowledged for funding the project. SummaryAim The aim of this investigation was to investigate effects of pesticides on growth and survival of Bombina bombina eggs and tadpoles and survival of adult B. bombina in the field. Over a period of three years (1993-95) a field investigation was established from May to August in 8 ponds on Avernakø (Fyn County) and 3 ponds on the east coast of Fyn. The ponds were selected among existing ponds in conventional agricultural areas, except for two of the ponds on the east coast of Fyn. The investigators had no influence on spraying of pesticides on fields surrounding the ponds. Two types of experiments were conducted to investigate the effects of pesticides on survival of eggs and small tadpoles (<0.2 g) and growth and survival of large tadpoles (>0.2 g). Eggs of Bombina bombina were placed in bags (35 l) placed inside cages (1.25*1.25*0.6 m) in each pond and hatching success and survival of tadpoles were monitored. B. bombina tadpoles were reared in an aquarium till a weight of 0.2 g. The tadpoles were then transferred to the cages where growth (weight) and survival were monitored till metamorphosis. Eggs and tadpoles were monitored on a weekly basis. Predators of tadpoles were noted and removed from the cages weekly. Water level in cages and max./min. water temperature were registered at every visit. Samples of epiphytic coverings of algae, bacteria, rotifers and protozoa in the ponds were taken weekly from plastic sheets for determination of amount and diversity of potential food sources to the tadpoles (only in 1994 and 1995). Samples for analysis of pesticides were taken from the 0.5 cm top surface water of the ponds weekly. The farmers gave a thorough report of use of pesticides and fertiliser (compound, dose, date) at the end of each season. Results on survival of adult Bombina bombina on Agersø, Avernakø, Hjortø, Knudshoved Odde and Nekselø were collected and analysed for evaluation of effects of cultivation on adult survival. Herbicides were found in 10 out of the 11 ponds, including one finding in each of the two ponds situated in non cultivated areas. Insecticides and fungicides were found in 6 of the ponds and only in the agricultural areas. Only three insecticides and two fungicides were detected in the ponds whereas 14 herbicides were found. Peak concentrations of herbicides ranged up to 11.440 g/l whereas insecticides and fungicides reached 460 ng/l and 7.475 g/l respectively. Herbicides were found to be much more persistent than insecticides and fungicides. Frequency of pesticide findings decreased significantly with increasing width of buffer zone and peak concentrations of pesticides tended to decrease with increasing width of buffer zone (1-10 m). No effect of height of the vegetation in the buffer zone (0-1 m) could be demonstrated. Not even a 10 m wide buffer zone was sufficient to provide complete protection of ponds against spray drift of pesticides. Only in one case an effect of pesticides on Bombina bombina tadpoles was found. Heavy contamination of a pond with herbicides probably caused the death of the macrophytes in the pond. Epiphytic coverings of algae, protozoa, rotifers and bacteria, on which the tadpoles depend for feeding, almost disappeared and was replaced by filamentous algae. The result was very poor survival of both small and large tadpoles. Correlations between pesticide contamination and growth parameters of tadpoles were found but the results were not consistent. Hatching of eggs was generally successful and not affected by pesticides. The newly hatched tadpoles were very vulnerable and survival was highly variable. In 3 out of 8 cases there was a significant positive correlation between abundance and quality of suitable food for the tadpoles and growth and survival of the tadpoles. The quality and thickness of epiphytic coverings on stems of higher plants are therefore probably of vital importance for the fitness of the tadpoles of Bombina bombina. On average half of the tadpoles released in the cages survived till metamorphosis, but the results were highly variable and offered only little basis of conclusions. The survival of adult Bombina bombina were generally lower in intensively cultivated agricultural areas than in uncultivated areas. Dansk sammendragFormål Formålet med dette projekt var at undersøge effekter af pesticider på vækst og overlevelse af æg og haletudser af klokkefrø samt at undersøge overlevelsen af voksne klokkefrøer på deres levesteder. I gennem tre år (1993-95) blev der gennemført en feltundersøgelse fra maj til august i 8 vandhuller på Avernakø (Fyns Amt) og i 3 vandhuller på Østfyn. Vandhullerne blev udvalgt blandt eksisterende vandhuller i konventionelle landbrugsområder undtagen to vandhuller på Østfyn. Landmændenes anvendelse af sprøjtemidler på marker omkring vandhullerne blev ikke ændret i forbindelse med undersøgelsen. To typer af eksperimenter blev udført for at undersøge effekter af pesticider på overlevelse af æg og små haletudser (<0,2 g) og vækst og overlevelse af store haletudser (>0,2 g). Klokkefrø æg blev placeret i poser (35 l) inden i bure (1,25*1,25*0,6 m) i hvert vandhul, hvorefter klækning og overlevelse blev registreret, til haletudserne vejede 0,2 g. Klokkefrø haletudser blev opdrættet i akvarier til en vægt på 0,2 g. Haletudserne blev derefter overført til bure, hvor vækst (vægt og længde) og overlevelse blev registreret til metamorfose. Æg og haletudser blev tilset ugentligt. Haletudsernes prædatorer blev registreret og fjernet fra burene ved hvert besøg. Vanddybde og maksimum/minimum vandtemperatur i vandhullerne blev registreret ugentligt. Prøver af epifytiske belægninger af alger, bakterier, hjuldyr og protozoer i vandhullerne blev taget ugentligt fra plastfolie til bestemmelse af mængde og diversitet af potentielle fødeemner for haletudserne (kun i 1994 og 1995). Vandprøver til analyse af pesticider blev taget fra overfladevandet (0,5 cm) i vandhullerne ugentligt. Landmændene afgav en detaljeret rapport over forbrug af pesticider og gødning (produkt, dosis, dato) ved afslutningen af hver sæson. Overlevelsesdata for voksne klokkefrøer på Agersø, Avernakø, Hjortø, Knudshoved Odde og Nekselø blev indsamlet og vurderet i forhold til arealanvendelse. Herbicider blev fundet i 10 ud af 11 vandhuller inklusive et fund i hvert af de to vandhuller i uopdyrkede områder. Insekticider og fungicider blev fundet i 6 af vandhullerne, men kun i landbrugsområder.Kun tre insekticider og to fungicider blev fundet, men hele 14 herbicider blev fundet. Den maksimale koncentration af herbicider var 11,440 g/l, hvorimod insekticider og fungicider nåede en maksimal koncentration på henholdsvis 460 ng/l og 7,475 g/l. Herbicider var langt mere persistente end insekticider og fungicider. Antal pesticidfund i vandhullerne faldt med bredden af bræmmen og der blev fundet en tendens til faldende maksimale koncentrationer af pesticider i vandhullerne med stigende bræmmebredde (1-10 m). Højden af vegetationen i bræmmen (0-1 m) havde ingen effekt. End ikke en bræmme på 10 m bredde var tilstrækkeligt til at sikre vandhuller mod forurening med pesticider. Kun i et tilfælde blev der fundet en effekt af pesticider på klokkefrø haletudser. Høje koncentrationer af flere herbicider i et vandhul forårsagede sandsynligvis, at alle makrofytter døde. De epifytiske belægninger af alger, protozoer, hjuldyr og bakterier, som haletudserne lever af, forsvandt næsten helt og blev erstattet af trådalger. Resultatet var en katastrofalt dårlig overlevelse af både små og store haletudser. Der blev fundet korrelationer mellem forurening med pesticider og vækst parametre for haletudser, men resultaterne var ikke entydige. Generelt klækkede en meget høj procentdel af æggene, og der var ingen effekt af pesticider på dette stadie. De nyklækkede haletudser var meget sårbare og overlevelsen varierede stærkt. I 3 ud af 8 mulige korrelationer blev der fundet en signifikant positiv sammenhæng mellem mængde og kvalitet af egnede fødeemner for haletudserne og vækst og overlevelse af haletudserne. Dette indikerer, at kvalíteten og tykkelsen af epifytiske belægninger på stængler af højere planter sandsynligvis er af stor betydning for væksten af klokkefrø haletudser. Gennemsnitligt overlevede halvdelen af klokkefrø haletudserne i burene til metamorfose, men resultaterne var meget varierende og gav kun et ringe grundlag for konklusioner. Overlevelsen af voksne klokkefrøer var generelt lavere i intensivt opdyrkede landbrugsområder end i uopdyrkede områder. 1 Introduction1.1 Background and aimsPesticides are an important part of modern agriculture and are a potential threat to plants and animals in the margin of the fields. The influence of pesticides on world-wide amphibian decline is reviewed by Bishop (1992) and Carey & Bryant (1995). It was concluded that co-ordinated field and laboratory studies are needed to establish, whether causal relations exist between use of pesticides and the decline of amphibians. This investigation is the field investigation part of such an attempt. The aim of this field investigation was to clarify the impacts of pesticides in and near the habitats of an endangered species, Bombina bombina. Various lifestages of B. bombina were investigated under field conditions in the attempt to find effects of pesticides. Effects of pesticides on algae and invertebrates affect amphibians indirectly, as they are an important food source to tadpoles and adults respectively. Hypothesis It was the intention of the investigation to test the following hypothesis:
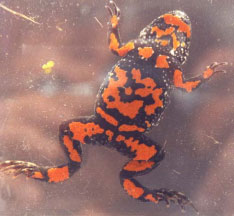
1.2 Biology of Bombina bombinaDistribution Bombina bombina is a small frog. The adults reach a maximal length of 55 mm. The back is brown, or nearly black, often with two light green spots on the neck, resembling duckweed. As a sharp contrast the belly has a very distinctive orange red pattern on a black background (figure 1.1). The pattern is highly specific for each individual which makes it possible to recognize individual frogs in a population year by year. B. bombina is found in 8 populations in the eastern and southeastern part of Denmark, and its existence in Denmark has always been limited to the islands east of Jutland. It requires a continental warm climate and is therefore on its northern and western border of its distribution in Denmark. B. bombina has a wide distribution in the North European lowland in Eastern Germany (former DDR), Poland, Lithuania and Belarus. It is also distributed in the lowlands of Russia (west of Moscow), Ukraine, Hungary, Czech, Romania, Bulgaria and former Yugoslavia.
Figure 1.1 Klokkefrøens specifikke bugmønster kan bruges til at genkende individer i en bestand. Ideal biotopes Ideal biotopes for Bombina bombina are extensively grazed fringes and meadows with numerous more or less permanent ponds. B. bombina is often found in ponds surrounded by cultivated land, but requires at least that the surrounding area is fragmented by scrubs, quickset hedges, stone fences or some fallow land (Briggs 1993). In many parts of Europe the main part of the populations live in agricultural areas, for example in East Germany (Schneeweiss & Schneeweiss 1997) and in Poland (Briggs pers. obs.). In Denmark, adult B. bombina often only migrates 200-300 m between breeding and foraging ponds as well as to winter biotopes (Briggs 1993). Therefore their terrestrial habitat must be in the near vicinity of the ponds. Prefers shallow temporary ponds for breeding Bombina bombina prefers shallow temporary breeding ponds (30-60 cm) that do not dry up until the end of the summer. These ponds only exist in areas where the water table has not been lowered by drainage, and therefore such biotopes have become increasingly rare during the last 50 years in Denmark. The breeding ponds must be fully exposed to the sun and preferably sheltered from the wind because the tadpoles require warm water (>20 °C ) to complete their development. There must be densely vegetated areas where the frogs and tadpoles can hide from predators as well as zones with open water. B. bombina tadpoles graze upon the surface of macrophyte stems, feeding on algae, bacteria and protozoa (Mossin 1988, Andersen 1992). Foraging ponds After the breeding season the frogs often migrate to forage in other ponds. Foraging ponds are often eutrophic, and partly overgrown. Normally Bombina bombina enters the terrestrial habitat in the late summer where it hibernates from October to April. In summary their yearly activity cycle is like this: Yearly activity cycle
Exceptions from this scheme occur, and for example some individuals stay in the same pond from April to September. The newly metamorphosed frogs usually appear in August and, after an aquatic foraging period, they migrate towards the hibernation sites. The following 1-2 years are a foraging and hibernation period. At the age of 2-3 years they start breeding. The migrations observed in the studied habitat on Avernakø are of a length of 100-500 m (Briggs 1993).
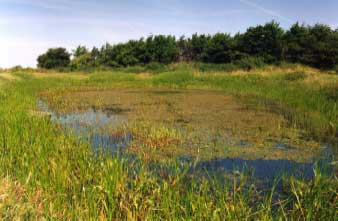
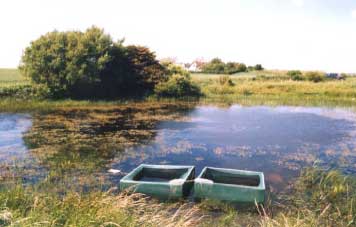
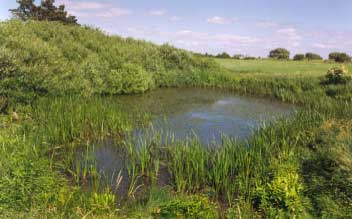
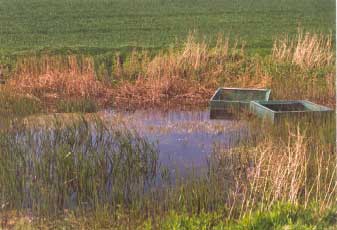
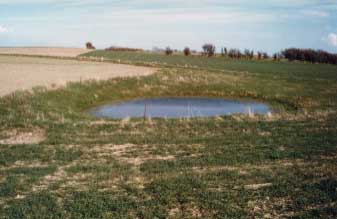
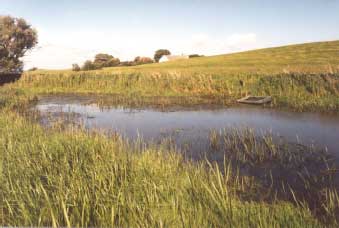
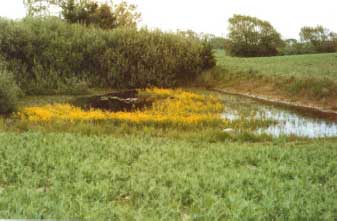
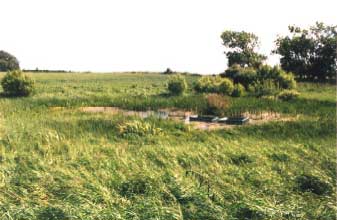
Figure 1.2 Eksempel på godt klokkefrø vandhul (vandhul P3). 1.3 Criteria for selecting Bombina bombinaThe following describes why amphibians generally, and Bombina bombina in particular, are well suited for studies of the impact of pesticides and modern farming in general on pond ecosystems and the surrounding areas. Amphibians in general
Bombina bombina was selected for this investigation according to the following criteria:
2 Localities2.1 Criteria for selection of localitiesIn 1993, 8 ponds (P1-P8) in agricultural areas were selected for experiments and an additional pond (P9) was included in 1994-95. Two ponds in uncultivated areas were included for the investigation in 1994-95 (P10-P11). Except for pond P8 on the east coast of Fyn Bombina bombina was found in all the ponds. B. bombina became extinct in P8 in the middle of the 1970's. Criteria The 9 ponds (P1-P9) were chosen according to the following criteria:
2.2 Description of localitiesOn Avernakø, a small island with small family farms located south of Fyn, 8 of the ponds were chosen (P1-P7, P9) (figure 2.1). On a large manor, Juelsberg, on the east coast of Fyn pond P8 was found (figure 2.2). The two ponds in uncultivated areas, P10 & P11, were chosen on the east coast of Fyn (figure 2.2). In all ponds except P8 the top layer of sediment was removed once during the period 1983-90 (table 2.1). The ponds in the uncultivated area, P10 and P11, were dug in 1987 and 1990 respectively. Pond P5 received surface water from P3 and drainage water from 2-3 hectares of farm land through an inlet. There were no inlets to the other ponds. Table 2.1 Fysisk beskrivelse af vandhuller.
Figure 2.1 Oversigt over lokaliteter. Beliggenhed af vandhuller på Avernakø (P1-P7, P9).
Figure 2.2 Beliggenhed af vandhuller på Østfyn (P8, P10-P11). 3 Methods
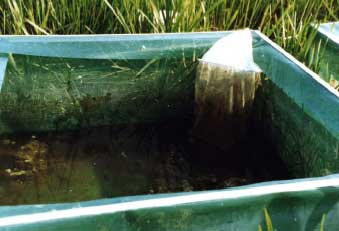
3.1 Field work programmeThe investigation was conducted from May to July 1993-95. All ponds on Avernakø (P1-P7, P9) were monitored intensively every seventh day. The ponds on the east coast of Fyn (P8, P10-P11) were monitored every seventh day in the first 2 weeks of the enclosure experiment and every 14-21 days thereafter. 3.2 EnclosuresCages Bags Experiments with eggs and tadpoles of Bombina bombina were conducted in two types of enclosures, cages and bags (table 3.1). The cages were made of an aluminium frame coated with a net of fine-meshed nylon (1 mm) and measured 1.25x1.25x0.6 m (figure 3.1). The cages were partly submerged in the ponds (<40 cm). The net both retained the tadpoles and assured a good exchange of water between pond and cage. In 1993 and 1994 the bags were made of large-meshed nylon (1x1 mm mesh width) but in 1995 bags of fine meshed nylon (mesh width<0.1 mm) were used in all ponds and, as control, the large-meshed bags were still used in 2 ponds. The bags were cylindrical with a diameter of 30 cm and a height of 50 cm (volume 35 l). The bags were submerged in the cages. Table 3.1 Program for forsøg med bure og poser. Antal bure i hvert vandhul og maskestørrelse på poser, L: stormasket nylon net, F: finmasket nylon net.
In 1994 and 1995 the experiments were conducted in all ponds but in 1993 the cages were only used in P1-P8 and the bags were only used in P3-P8.
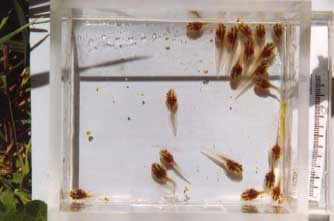
Figure 3.1 Bur og pose brugt til æglægning, klækning af æg og til forsøg med vækst og overlevelse af haletudser. Predators removed Specimens of large predators appeared regularly in the cages. All larger predators such as Dytiscidae, Odonata and Hirudinea were removed by emptying the enclosures at every visit. The predators were identified and counted. All Lemna sp. and filamentous algae were removed from the cages at every visit. 3.3 Vegetation and buffer zoneArea of vegetation and buffer zones were measured In 1994 the ponds were drawn to scale, with the exact proportions of vegetated/non vegetated zones in the ponds and width and height of buffer zones. A zone of at least 180 ° of the buffer zone being without trees and bushes and with the shortest distance to the field was chosen for calculation of the average width of the buffer zone. The areas of the vegetation zones and buffer zones were estimated with a planimeter (Ushikata x-plan 360 cl). The vegetation in the buffer zones was not described. The dominating vegetation in the ponds were identified to individual species. In 1995 the distribution of vegetation zones was measured relative to the 1994 zones, and the 1994 maps were modified, according to the changes in vegetation. For the year 1993 the vegetation zone was extrapolated from 1994 maps, schematic drawings, notes and pictures from 1993. 3.4 Population of Bombina bombina3.4.1 Population size and survival of adultsCalling males Calling males were used as an indicator of the population size of Bombina bombina. Calling males were counted on warm sunny days in May or June. The males were first located by listening and finally individual males could be counted by means of binoculars. Adult B. bombina were caught on Avernakø in P1-P7 and P9 with a dip-net under good weather conditions from late April to early July to register as large a percentage of the population as possible by photographs of the frogs' belly pattern. Adult survival The results gathered from photographs of belly patterns were used to calculate the yearly survival of adult frogs. All survival data were calculated over a number of years. In year x a number of individuals in the population were photographed. A capture-recapture estimate was calculated in year x+y based on frogs photographed in year x. The method used is a simple Lincoln-index modified for survival calculations (Briggs 1993). A large proportion of the population (>50 %) must be caught in each round to obtain a reliable estimate. Survival data of Bombina bombina collected over a 10 year period in Fyn and West Zealand counties were used in this investigation. The data from Fyn (Hjortø, Avernakø) and Knudshoved Odde (east and west) were collected by Lars Briggs. Data from West Zealand was collected by Ditte Guldager Christiansen and Erich Wederkinch. The counties and persons involved kindly allowed these data to be used. 3.4.2 Breeding successTo monitor breeding success, tadpoles were registrated in July, and in August or September the number of metamorphosed frogs was counted in each pond. Breeding was not investigated in ponds where no calling males were heard. 3.4.3 Eggs for experimentsFertile males and females were caged until after spawning Fertile males and females were collected in late April each year, and females ready to spawn were put together with fertile males in the cages. It is very difficult to find Bombina bombina eggs in ponds and therefore it was necessary to use the cages to ensure that a sufficient amount of eggs were available. Within a few days eggs were collected from the enclosures and were used for further experiments. 400-650 eggs were collected each year Each year around the 20th-25th of April, 300-500 eggs were collected from 1-2 females on Avernakø. This was enough to raise 280-320 tadpoles for the experiments with growth and survival of tadpoles in the 8 ponds on Avernakø (P1-P7 and P9). In addition approximately 100-150 eggs were collected from one female on the east coast of Fyn, enough to raise 60-100 tadpoles for the experiments concerning growth and survival of tadpoles in P8, P10 and P11. From the 20th of April to the 20th of May several hundred eggs were collected from several females for the experiment on hatching of eggs. 3.5 Experiments with Bombina bombina3.5.1 Hatching of eggs and survival of small tadpolesEggclusters gathered from the enclosures were placed in the bags in the cages. The original egg number was determined at the beginning of the experiment and thereafter the number of hatched, remaining and dead eggs were noted every seventh day. As soon as all living eggs were hatched the survival of the small tadpoles was monitored. The experiment was terminated after one month at which time the tadpoles weighed approximately 0.2 g. 3.5.2 Growth and survival of large tadpolesRearing of tadpoles Eggs gathered from the enclosures were hatched and the tadpoles reared in an indoor aquarium. When the tadpoles had reached an almost equal weight of about 0.2 g, 20 tadpoles were transferred to each cage in all ponds (only P1-P8 in 1993).
Figure 3.2 Klokkefrøhaletudser brugt til undersøgelser i bure Growth of tadpoles Every seventh day the tadpoles were weighed individually and photographed and the number of dead or missing tadpoles was recorded. Tadpoles were caught with a net, transferred to a small sieve, and excess water removed by gently touching the sieve with blotting paper. The tadpoles were after wards weighed in a container filled with water on a digital field weight. To measure growth in length the tadpoles were placed in a glass aquarium with length marks on the side and then photographed. The weight at metamorphosis and the time needed to reach metamorphosis were also registered. Growth of the tadpoles was calculated from equation 3.1:
where The method was tested with success by Andersen (1992). 3.6 Sampling and analysis3.6.1 PesticidesSampling of surface water Detection limits Water samples for pesticide analysis were taken from the ponds P1-P9 every seventh day during a period of 2 months. The samples were carefully taken from the top 0.5 cm surface layer of the water column in an open water area about 2 m from the margin of the pond. The sample bottles used were 1 and 2 l Pyrex or Duran glass bottles. Immediately after sampling, the bottles were stored in a freezer at -18 °C until they could be analysed for pesticides. The samples were analysed at two laboratories: MLK FYN, Odense (Environment and Food Agency) and DTI, Copenhagen (Danish Technological Institute). One sample from 1995 were sent to both laboratories for parallel analysis. In 1993 and 1995 the detection limits were around 10-40 ng/l but in 1994 the detection limits were 100-500 ng/l. Since the investigators were in weekly contact with several of the farmers, it was possible to get spraying information during the growing season. When information about pesticide application during the growth season was available, additional samples were taken shortly after spraying. 3.6.2 Food Quality IndexEpiphytic growth Epiphytic coverings of algae, bacteria, rotifers and protozoa in the ponds were described in 1994 and 1995. In 1993 only a few identifications were made. Plastic sheets were placed vertically in the water in the cages (2 sheets) and in the ponds (1 sheet) to study the thickness of the coverings and the composition of species of the epiphytic growth. Samples for analysis of dominating species of algae, Leptothrix bacteria and protozoa were taken every seventh day from these sheets. The samples were immediately analysed under a microscope and subsequently preserved in lugol for further examination later. In addition stems of macrophytes were collected, analysed and preserved as described above for analysis of epiphytic coverings. Identification The algae were identified to individual species. Leptothrix bacteria and sulphur bacteria were identified and the protozoa recognized as Vorticella, amoeba or Paramecium. Rotifers were only identified as a group. From the diversity and abundance of these organisms a score for the amount and quality of food sources for the tadpoles, the Food Quality Index, was assigned to each pond in 1994 and 1995. Food Quality Index The Food Quality Index was based on the following:
The Food Quality Index score was created by an addition of points based on the scheme in table 3.2. Table 3.2 Food Quality Index point system til beskrivelse af epifytisk vækst i vandhuller.
3.6.3 Water temperature and water levelMaximum and minimum temperatures were measured at 20 cm depth, which is the depth where the eggs of Bombina bombina are deposited and where the tadpoles live. The water level in the enclosures was also noted at every visit. 3.7 Landowner interviewUse of pesticides and fertilizer Farmers were well known The investigators had no influence upon the spraying regime of pesticides on fields surrounding the ponds. Information concerning use of specific pesticides and fertilizers was collected from the respective landowners every year after harvest. The landowners filled out a form about their use of pesticides and fertilizer around each pond and were also interviewed to ensure the precision of the data. In that way the exact dates for spraying of pesticides and distribution of fertilizer as well as the specific amount were known. The investigators have been in contact with these landowners for a number of years before this investigation, due to previous agreements between farmers and investigators about dredging of ponds. 3.8 StatisticsSpearman Rank analysis All statistics were done using Spearman Rank correlation analysis (Zar 1984). Ranking of data The ponds were ranked with the increasing rank to increasing exposure to pesticides. The highest ranks were given to ponds in which pesticides were detected. Pesticides could not always be found in ponds after spraying. The reason might be that the pond was not contaminated, lack of methods or low persistence of the specific pesticide in the environment. The medium rank values were given to ponds according to the number of pesticides used and times used, even if the pesticides were not detected. The investigators chose to assign ponds where pesticides were used but not found a medium rank value because of the potential risk of contamination. When pesticides were not used on fields surrounding a pond nor found in the samples, the pond was assigned the lowest rank. All herbicides, insecticides and fungicides were treated as having the same effect on the ecosystem. The knowledge concerning toxicity on ecosystem level of the various pesticides used in this investigation is limited. Therefore a more detailed ranking system was not possible. Examples of ranking The rank of herbicide, insecticide and fungicide in 1993 was based on the data in table 3.3. The data in table 3.3 were ranked from 1 to 8 (table 3.4). In the following an example of how the data were ranked is given. The example given concerns contamination with insecticides in 1993. In P3, P6 and P8 the maximum concentrations of insecticides were almost equal, 115-130 ng/l. Therefore all three ponds received the same rank, 7 instead of being ranked 6, 7 and 8. In the fields around P4 an insecticide was used but not detected in the pond water. Pond P4 was therefore given an intermediate rank value of 5, because of the potential risk of the pond having been contaminated without detection of the insecticide. Ponds, where insecticides were not used nor found in the samples, were all ranked equally low with the value 2.5 as a mean of the values 1, 2, 3 and 4. Estimation of rank An attempt was made to rank the pesticide exposure without the use of pesticide measurements but only based on the number of pesticides used multiplied by the times the pesticides were sprayed. The resulting rank was almost identical with the rank presented above. For none of the ponds the ranks deviated more than 1 point between the two methods. Growth and survival data were ranked according to the numerical values. The Food Quality Index was ranked as described in chapter 4.5. Table 3.3 Pesticidbelastning i 1993. Øverst i tabellen ses maksimum koncentrationer af pesticider. Den midterste del af tabellen viser vandhuller, der potentielt var eksponeret for pesticider, men hvor ingen pesticider blev fundet i vandprøverne. Den nederste del af tabellen viser vandhuller hvor pesticider ikke blev brugt på de omkringliggende marker og heller ikke blev fundet i vandprøverne.
Table 3.4 Vandhuller rangordnet i henhold til pesticid belastning i 1993. Summen af point for herbicider, insekticider og fungicider er brugt til at rang-ordne vandhullerne i henhold til den generelle pesticidbelastning.
4 Results
4.1 Vegetation in pondsThe macrophytes in P8 died in 1995 The vegetation in most of the ponds was dominated by Sparganium erectum, Potamogeton natans, Eleocharis palustris, Glyceria fluitans, Equisetum fluviatile and Polygonium amphibium or a combination of these plants. Lemna minor dominated in P5 and Typha latifolia in P11. The vegetation in P8 was dominated by Sparganium erectum in 1993-94 but in 1995 the entire population of macrophytes died out. Excessive mortality of macrophytes did not occur in any other ponds. For further information on plant species in the ponds see appendix 10.4. 4.2 Buffer zonesThe width of the buffer zones ranged from 1 to 10 m, and the height of vegetation in the buffer zones ranged from 0.2 to 1 m (figure 4.1). In P4 and P7 the width of the buffer zone varied between years. This was in P4 caused by large variations in water level and in P7 by ploughing of the buffer zone. The width of the buffer zone surrounding P7 in 1993 is not shown because the field around P7 was fallow in 1993.
Figure 4.1 Bredde og højde af bræmmer omkring vandhullerne. 4.3 PesticidesHerbicides dominated A total of 14 herbicides but only 3 insecticides and 2 fungicides were detected in the 11 ponds. Herbicides were all together detected 61 times in eight of the nine experimental ponds (P1-P8) at concentrations up to 11.44 μg/l and once in each of the reference ponds, P10 (580 ng/l) and P11 (10 ng/l) (table 4.1). Clopyralide, ioxynil, mechlorprop and propyzamide were found at peak concentrations above 1 μg/l. The average concentration of herbicides were 662 ng/l. Insecticides Three insecticides were detected 10 times in 6 ponds (P1, P3, P4, P6, P8, P9) but only in concentrations below 500 ng/l. The average concentration of insecticides was 140 ng/l. Fungicides Only two fungicides were found a total of 14 times in 6 ponds (P1, P3, P4, P6, P8, P9). Fenpropimorph and propiconazol were found at concentrations up to 7.475 and 2.968 μg/l respectively with an average concentration of 1.235 μg/l. Table 4.1 Pesticidfund i vandhuller fra 1993-95.
1993 In 1993 large concentrations of the fungicide fenpropimorph were found in P3 and P4, 3.550 μg/l and 7.475 μg/l respectively (figure 4.2). The herbicide ioxynil was found in P6 at 1.190 μg/l coincident with 0.581 μg/l of fenpropimorph. Three insecticides were found in the ponds P3, P6 and P8 at concentrations between 115 and 130 ng/l.
Figure 4.2 Maksimale pesticid koncentrationer i vandhuller i landbrugsområder, P1-P9. Bemærk ændret skala på y-akse i 1994. 1994 In 1994, pesticides could only be detected in P8 (fields around P3, P4 and P9 were fallow). The herbicides mechlorprop and ioxynil were found at 11.44 μg/l and 1.105 μg/l respectively and the fungicide propiconazol at 2.968 μg/l coincident with other herbicides and fungicides in lower concentrations. Tribenurone was sprayed together with mechlorprop and ioxynil but the laboratories were not able to detect this herbicide. 1995 In 1995 again, very high concentrations could only be found in P8. The herbicides clopyralide and propyzamide were found at 2.160 μg/l and 2.340 μg/l, respectively. In the other ponds, only minor concentrations of herbicides were found, except for 650 ng/l of mechlorprop in P6. The insecticide pirimicarb was found in the ponds P1, P3, P4 and P9 with the highest concentration in P9 (460 ng/l). All individual measurements of pesticides are listed in appendix 10.3 and dates of spraying and dose are listed in appendix 10.1 (landowner interviews). In 1993 and 1995 the detection limits were around 10-40 ng/l, but in 1994 the detection limits were raised to 100-500 ng/l. Pesticides were only found in 1 out of 9 ponds in 1994. In 1993 pesticides were found in all 7 ponds tested and in 1995 pesticides were found in 7 out of 8 ponds tested. Test of laboratories Two identical samples from P1 (10/7-95) were sent to the laboratories on DTI (Dansk Teknologisk Institut) and MLK (Miljø- og Levnedsmiddel Kontrollen) to evaluate the precision of the measurements between the two laboratories. The insecticide pirimicarb was found at 115 ng/l by DTI and at 90 ng/l by MLK. DTI found that the concentration of the fungicide propiconazol was below the limit of detection (<20 ng/l) but MLK found 40 ng/l of propiconazol. Because the deviations were minor no further parallel analysis was conducted. Both laboratories are tested yearly by the Danish Environmental Protection Agency (DEPA). Persistence of pesticides The time from spraying to the last detection of a pesticide varied between groups of pesticides. Herbicides persisted generally much longer in the ponds than insecticides and fungicides. The herbicides propyzamide and clopyralide were found at concentrations above 2 μg/l in P8 in June 1995 about 7½ months after spraying which was done in October 1994. Other herbicides could be detected for 26 to 76 days after spraying. Except for the fungicide propiconazol, insecticides and fungicides could often only be detected until 5 days after spraying. Disappearance of pesticides from the water In a few cases the disappearance of pesticides from the water could be traced: Herbicides
Insecticides
Fungicides
A comparison of concentrations of the fungicides propiconazol and fenpropimorph in P8 in 1994 showed that propiconazol was much more persistent than fenpropimorph (table 4.2). In spite of the fact that fenpropimorph was applied at a 2.4 times higher dose than propiconazol, fenpropimorph was only found in high concentrations within a few days from spraying whereas propiconazol was still found at a high concentration 24 days after spraying. In each of the examples mentioned above either the laboratory on DTI or MLK were chosen (but not both) for analysis of the samples. Therefore the results reflect the individual persistence of the pesticides and not an effect of changing laboratories. Table 4.2 Sammenligning af koncentrationer af fungiciderne propiconazol og fenpropimorph i P8 i 1994. Propiconazol og fenpropimorph blev sprøjtet på marken omkring P8 i en blanding med forholdet 1:2,4.
Herbicides were found where they had not been sprayed Several phenoxy acids (herbicides) were detected in ponds surrounded by fields where the compounds where not used. Dichlorprop, for example, was found in 7 out of 8 ponds in 1993 in concentrations up to 341 ng/l, though only sprayed on fields around P2. 4.4 Pesticides and buffer zoneDecreasing number of findings due to buffer zone The number of pesticide findings increased significantly with decreasing width of buffer zone (rs=0.811, p<0.005) (figure 4.3). The number of analysed pesticide samples varied between ponds, introducing a possible bias. Therefore Rf/m, describing the ratio of the number of findings of pesticides in relation to the number of samples measured from the respective pond, was also tested against the width of the buffer zone (figure 4.3 and table 4.3). This ratio also correlated significantly with buffer zone width (rs=0.739, p<0.002) indicating that the correlation between number of findings and buffer zone width is true. For ponds with buffer zones >4 m the average value for Rf/m was 0.68 compared to 2.2 for ponds with buffer zones of 4 m.
Figure 4.3 Pesticidfund og ratio af pesticidfund i forhold til antal målte pesticidprøver (Rf/m) - som funktion af bræmmebredde. Ved variabel bredde af bræmme blev data for hvert enkelt år afsat mod den respektive bræmmebredde. Tendency toward decreasing concentrations with wider buffer zones There was found a weak tendency towards decreasing peak concentrations of pesticides with increasing width of buffer zones (rs=0.64, p=0.1) (figure 4.4). In ponds with buffer zones of 4 m or less, maximal concentrations of pesticides exceeded 1 μg/l in 4 out of 5 cases (table 4.3). Maximal pesticide contamination of ponds with buffer zones wider than 4 m was below 500 ng/l. However even in a pond with a buffer zone of 10 m pesticides were found. There was no correlation between findings of pesticides or maximal pesticide concentrations and height of vegetation in the buffer zone. The value given for the total number of sprayings comprises both the frequency of spraying and the number of compounds used and thus provides information on the potential risk of contamination of each pond. If three different compounds were sprayed at the same time, three sprayings were counted because three compounds may have contaminated the pond. The total number of sprayings varied considerably between ponds (table 4.3). There was no correlation either between findings of pesticides and spraying of pesticides (rs=0.507, p<0.2) or between spraying of pesticides and width of the respective buffer zone (rs=0.211, p>0.5). It was tested if there was any correlation between number of samples measured and width of buffer zone in the respective ponds. No correlation was found (rs=0.427, p=0.2). Table 4.3 Sammenligning af bræmmebredde med antal fund og maksimal koncentration af pesticider.
Figure 4.4 Pesticidkoncentration som funktion af bræmmebredde. Ved variabel bredde af bræmme blev koncentrationer for hvert enkelt år afsat mod den respektive bræmmebredde. 4.5 Population of Bombina bombina4.5.1 Population size and breedingCalling males Variation in number of calling males between years was small except in P3, P4 and P9 (figure 4.5). The populations were minor in most of the ponds and only in P2, P4 and P11 there were more than 10 calling males. In P8 there was no population of Bombina bombina. Variation in the total population of B. bombina in the ponds on Avernakø and the east coast of Fyn (except P8) between years was rather small, but the highest number of calling males was heard in 1994. The total numbers of males heard in the ponds in 1993, 1994 and 1995 were respectively 60, 65 and 55.
Figure 4.5 Antal kvækkende klokkefrø hanner og index for ynglesucces. Breeding success In 6 of the 8 ponds on Avernakø both calling males and eggs were found and natural breeding success was proved evident by metamorphosed frogs (figure 4.5). The breeding success was highly variable between years and in many cases breeding success was not apparent although calling males were heard. Only in P1, P4 and P9 there were large successful breedings with more than 100 metamorphosed frogs. The natural breeding success was much higher in 1994 than in the other years. The average score for successful breeding was 1.2 in 1994 compared to 0.5 in 1993 and 0.3 in 1995. The 5 largest successful breedings occurred in ponds surrounded by buffer zones wider than 5 m, but there was no significant correlation (rs=0.464, p<0.1, n.s.) between breeding success and width of buffer zone (figure 4.6).
Figure 4.6 Index for ynglesucces, hvert år relateret til bredden af bræmmen omkring det pågældende vandhul (rs=0,464, p<0,1, n.s.). Score 1: 1-10 metamorfoserede frøer; score 2: 11-99 metamorfoserede frøer; score 3: >100 metamorfoserede frøer. 4.5.2 Survival of adultsSurvival and cultivation Yearly survival rates of Bombina bombina older than 1 year ranged between 43 and 94 % (figure 4.7). There were only small variations in survival within localities between the different periods except for Knudshoved Odde east where the lowest and highest yearly survival were found. Survival estimates were calculated over a number of years and were related to the median year of the periods. On Avernakø, where 90 % of the area was cultivated, the yearly survival was maximally 60 %. On Hjortø and Knudshoved Odde east where respectively 51 % and 0 % of the land was cultivated, up to 93 % and 94 % yearly survival was found. On the islands Nekselø and Agersø with 40 % and 80 % cultivated land respectively, the yearly survival ranged between 62 % - 74 % and 73 % - 77 % respectively. The results indicate that yearly survival rates of adult B. bombina are generally lower in intensively arable lands than in more natural areas, such as dry and wet permanent grasslands (figure 4.8). See appendix 10.5 for more information.
Figure 4.7 Årlig overlevelse af klokkefrø ældre end 1 år på danske lokaliteter. Overlevelsesestimater er udregnet som gennemsnit over flere år.
Figure 4.8 Årlig overlevelse af klokkefrøer ældre end 1 år på danske lokaliteter som funktion af dyrkningsgrad af habitaten. Vandhuller, moser, enge, overdrev, hegn og skov er udyrkede arealer, mens landbrugsarealer med jordbearbejdning er dyrkede arealer. 4.6 Enclosure experiment with Bombina bombina4.6.1 Hatching of eggsSuccessful hatching With one exception the success of hatching was above 90 % in all ponds (figure 4.9). In P3 in 1995 the hatching success was only 47 % and it was observed that embryo development had stopped before hatching.
Figure 4.9 Klækningsprocent for klokkefrøæg. 4.6.2 Survival of newly hatched tadpolesSurvival was highly variable The survival of the small tadpoles till 14 and 30 days of age was highly variable between ponds and years (figure 4.10). In 1993, 1994 and 1995 all tadpoles died within 30 days in at least three ponds.
Figure 4.10 Overlevelse af 0 til 14 dage og 14 til 30 dage gamle nyklækkede klokkefrø haletudser. Connection to presence of predators The conditions were worst in P5 with survival ranging from 0 to 50 % from day 0-14 and 0 to 13 % from day 14-30. Only in the ponds P4, P8 and P11 survival through development above 50 % was seen in more than one year during the investigation. No significant correlations could be found between density of predators and survival of small tadpoles but in a few cases there was an obvious connection. Several small leaches were observed inside the bags in P6 and P7 in 1994 and the survival ranged from 0 to 25 % that year. 4.6.3 Growth and survival of large tadpolesGrowth and survival was highly variable The growth rate of the tadpoles was highly variable between ponds and years (figure 4.11). In P1 in 1993, in P5 and P7 in 1995 the growth rates were very low through the first week.
Figure 4.11 Vækstrate af klokkefrø haletudser de 2 første uger efter udsætning i bure. The survival of tadpoles from a size of ca. 0.2 g to metamorphosis was also highly variable with no examples of more than 50 % survival in every one of the three years (P9-P11 was only investigated in 1994-95). In P8 in 1993-94 and in P1, P2, P9-P11 in 1994-95 the survival exceeded 50 % (figure 4.12). In P1 in 1993 and in P8 in 1995 the survival was extremely low (<5 %). The average survival varied between years and the highest survival of large tadpoles to metamorphosis was found in 1994, when 63 % survived. In 1993 the average survival was 56 % compared to 48 % in 1995. No significant correlations could be found between density of predators and survival of large tadpoles. Survival and growth did not correlate Survival did not correlate with growth rate. The very low growth rate in P1 in 1993 was coincident with a very low survival. Also the extremely low growth rates during the first week in P5 and P7 in 1995 was followed by a low survival. The very low survival in P8 in 1995 occurred despite a high growth rate.
Figure 4.12 Overlevelse af klokkefrø haletudser fra en størrelse på ca. 0,2 g til metamorfose. 4.6.4 MetamorphosisNo connection between time and weight The average metamorphosis weight ranged from 0.6 to 0.8 g in most of the ponds (figure 4.13). In P3, P10 and P11 in 1994 and P10 in 1995 the metamorphosis weight was very low ranging from 0.34 to 0.40 g. The weight at metamorphosis was very high in P9 in 1994, up to 0.98 g. Time from a size of approximately 0.2 g to metamorphosis ranged between 6 and 10 weeks. No clear pattern between time to metamorphosis and weight could be found. In 1993 there was a significant negative correlation between metamorphosis weight and density of predators in general (rs=-0.830, p<0.05). A significant negative correlation between metamorphosis weight and density of the predator Hirudinea was found in 1995 (rs=-0.767, p<0.05).
Figure 4.13 Metamorfosevægt og -tid for klokkefrø haletudser i bure. 4.7 Food Quality IndexVariation of FQI between ponds The variation in the abundance and diversity of food sources for the tadpoles, denoted as Food Quality Index (FQI), was small between years but very large between ponds (figure 4.14). The FQI was extremely low in P3 in 1994 and in P8 in 1995 with only a thin epiphytic layer of a few algae species and no Leptothrix bacteria or protozoa. In P2, P6 and P9 the FQI was above 7 in both 1994 and 1995 and the tadpoles could feed on a very diverse and thick layer of algae, Leptothrix bacteria and protozoa. In 1994 the FQI was not sufficiently described in the ponds on the east coast of Fyn (P8, P10-P11). The abundance and diversity of potential food sources for the tadpoles are described in detail in appendix 10.8. Thick coverings of sulphur bacteria was found in P5 in 1993, in P5, P6 and P9 in 1994 and in P2, P5, P6, P8 and P9 in 1995.
Figure 4.14 Food Quality Index: mængde og diversitet af potentielle fødekilder for klokkefrø haletudser. Correlation with growth parameters There was a tendency towards positive correlation between FQI and the average metamorphosis weight pr individual in 1994 but not in 1995 (1994: rs=0.734, p<0.1; 1995: rs=0.049, p>0.5) (figure 4.15). The total biomass of metamorphosed frogs from each pond includes both growth and survival and can therefore describe the capacity of the pond to support production of frog larvae. FQI was positively and significantly correlated with the total metamorphosed biomass in 1994 but not in 1995 (1994: rs=0.874, p<0.05; 1995: rs=0.558, p>0.05). The average specific growth rate of the tadpoles in the first 2 weeks did not correlate with FQI in 1994 (rs=0.383, p<0.5) but in 1995 there was a positive significant correlation (rs=0.628, p<0.05). Survival to metamorphosis was significantly positively correlated with FQI in 1995 (rs=0.754, p<0.05) but not in 1994 (rs=0.199, p>0.5). Growth may depend on FQI Although growth variables were only significantly correlated to FQI in 3 out of 8 cases, rs - values were always positive, indicating that growth may have been dependent on abundance and quality of food sources.
Figure 4.15 Spearman Rank korrelationer mellem Food Quality Index og A: Metamorfose vægt, 1994: rs=0,734, p<0,1, n.s.; 1995: rs=0,049, p>0,5, n.s. B: Total biomasse af metamorfoserede frøer, 1994: rs=0,874, p<0,05; 1995: rs=0,558, p>0,05, n.s. C: Specifik vækstrate af haletudser, 1994: rs=0,383, p<0,5, n.s.; 1995: rs=0,628, p<0,05. 4.8 Water temperature and water levelNo correlation with growth parameters Average maximum temperatures ranged from 18.4 °C to 23.6 °C in 1994 (May to June) and 18 °C to 25.3 °C in 1995 (June) (appendix 10.9). Maximum temperatures of 30 °C was reached in a few ponds. In 1994 and 1995 the influence of temperature on metamorphosis weight and time, growth rate and hatching of eggs was tested. No significant correlations were found. Low water level in P8 each year In some cases the ponds were close to dry out too early and it was not possible to keep the water level in the cages at 30 cm (figure 4.16). This happened every year in P8, where the water level sank to 10 cm during the last 2 weeks of the experiment. At the end of the experiment in 1993 the pond P4 was too small too maintain a water level of 30 cm in both cages. In P9 the water level was down to 20 cm at the end of the experiment in 1994.
Figure 4.16 Vanddybde i bure.
Signature to pond drawings. 4.9 Summing up of resultsIn this section a brief summary of data and results from the ponds are given. Drawings of the ponds and surroundings are included to the left of the descriptions of the ponds. P1
Pond P1 In 1993 growth and survival of large tadpoles were very low. In May a thick epiphytic layer consisting mostly of cyanobacteria covered the net of the cages and all higher plants in the pond. In 1993 more fertiliser was supplied to the surrounding field than recommended by the agricultural advisor. Survival of the small tadpoles was average in 1994 and 1995. In 1994 and 1995, when detailed microscope investigations were made, both abundance and diversity of algae, protozoa and bacteria and the growth rate, survival and metamorphosis weight of the tadpoles were average. Natural breeding occurred with success in 1990, 1991, 1994 and 1995. The buffer zone was 6.7 m wide and the area of the pond was about 750 m2.
Figure 4.17: Vandhul P1 i 1995. Billede taget fra sydvest. P2
Pond P2. In this pond the growth of the tadpoles was good and stable in all three years, and in 1994-95 the Food Quality Index was very high. Survival of small and large tadpoles was good in 1994-95 but in 1993 the survival of large tadpoles was low. The average metamorphosis weight was high and stable during the investigation. Natural breeding success occurred from 1990-94. The buffer zone was 9.3 m wide and the area of the pond was about 170 m2.
Figure 4.18 Vandhul P2 i 1992. Billede taget fra vest. P3
Pond P3. The small tadpoles survived very well in 1993, at average in 1994 but in 1995 all died after the second week. The growth and survival of the large tadpoles were lower than the average value. The Food Quality Index was very low in 1994 but high in 1995. The Average metamorphosis weight was more than doubled from 1994 to 1995. Natural breeding success was not observed in 1993-95 but was seen in 1990 and 1991. A peak concentration of 7.475 g/l of fenpropimorph was found in 1993 at the day of spraying (12th of June) which coincided with the cage experiment. The buffer zone was 4 m wide and the area of the pond was about 940 m2.
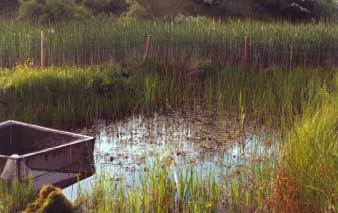
Figure 4.19: Vandhul P3 i 1995. Billede taget fra sydøst. P4
Pond P4, 1993. None of the small tadpoles survived in 1993. The pond was then rather small (140 m2) with a narrow buffer zone (2.5 m). The survival of small tadpoles was good in 1994-95. This time the pond was large (1,050 m2) and the buffer zone wider (5.5 m). The survival of the large tadpoles decreased from an average level in 1993 to below average in 1995. The Food Quality Index was rather good in 1994-95 and the tadpoles grew very well from 1993 to 1995. Natural breeding success occurred in 1994 and 1995, but not from 1990 to 1993 when the water level was low and the area covered by water was less than 150 m2.
Pond P4, 1995.
Figure 4.20 Vandhul P4 i 1993. Billede taget fra øst. P5
Pond P5. In all three years the survival of the small tadpoles was very low. The growth rate of the large tadpoles was good in 1993 but in 1994 and 1995 it was very low during the first week. In all years the tadpoles ended on an average metamorphosis weight. The Food Quality Index was low in 1994-95. Thick coverings of purple sulphur bacteria were found each year and this was the only pond where Lemna minor was dominating. The pond received drainage water from 2-3 hectares of farmed land through an inlet. Successful natural breeding was not observed in 1993-95. The buffer zone was 4.2 m wide and the area of the pond was about 170 m2.
Figure 4.21 Vandhul P5 i 1996. Billede taget fra vest. P6
Pond P6. Growth and survival of both small and large tadpoles were good in 1993 and 1995 but in 1994 no small tadpoles survived and the growth rate and survival of large tadpoles were at an average level. Low survival of small tadpoles in 1994 coincided with the presence of several small leaches inside the bags. In 1993 and 1995 no leaches were observed inside the bags. Survival of the large tadpoles in 1993 was good even though 115 ng/l of fenvalerate, 581 ng/l of fenpropimorph and 1.19 g/l of ioxynil were found the 1st of June, 2 weeks after spraying. The buffer zone was only 2.2 m wide and the area of the pond was about 640 m2. The Food Quality Index was high and the metamorphosis weight was average. Successful natural breeding occurred in 1994 and 1995.
Figure 4.22 Vandhul P6 i 1995. Billede taget fra sydvest. P7
Pond P7, 1994. The survival of the small tadpoles was low in 1993 and 1994 but good in 1995. In 1994 several small leaches were observed inside the bags but not in 1993 and 1995. The growth rate of tadpoles ranged from average in 1993-94 to low in 1995 when also very low survival occurred. The Food Quality Index was fairly high. Natural breeding was successful in 1994. The field surrounding P7 was fallow in 1993 but in 1994 and 1995 the field was farmed with a buffer zone of 9.2 m and 4 m respectively. The area of the pond was about 300 m2.
Pond P7, 1995.
Figure 4.23 Vandhul P7 i 1990. Billede taget fra sydvest. P8
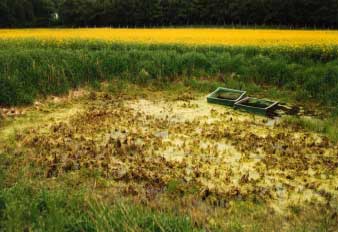
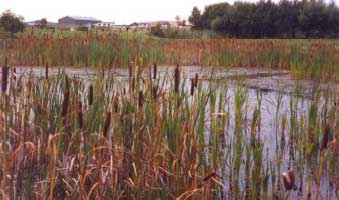
Pond P8. The highest concentrations of herbicides was found in P8 in 1994 where mechlorprop reached 11.44 μg/l. In 1995 the herbicide concentrations was again high with more than 2 μg/l of clopyralide and propyzamide. It was also noticed that the tractor tracks in the field was so close to the margin of the pond that pesticides could have been sprayed straight across the pond. No damage to higher plants was noticed in 1994 but in 1995 the dominating population of Sparganium erectum was dead and was replaced by mats of filamentous algae, covering the entire surface of the pond. The buffer zone was only about 1 m all years and the area of the pond only about 50 m2. The survival of the small tadpoles was good in 1993 and 1994 but in 1995 all died. The growth rate of the large tadpoles was at an average level. The large tadpoles survived very well in 1993-94 but in 1995 only 1 out of 40 tadpoles survived to metamorphosis. In 1995 the Food Quality Index was extremely low. Natural breeding could not take place, because Bombina bombina is extinct in the area.
Figure 4.24 Vandhul P8 i 1993. Billede taget fra vest.
Figure 4.25: Vandhul P8 i 1995. Der blev fundet høje koncentrationer af herbicider i 1994 og 1995 og Sparganium erectum døde i 1995. Billede taget fra nord. P9 
Pond P9. Both in 1994 and 1995 the survival of the small tadpoles was very low. On the other hand growth and survival of the large tadpoles was very good and the average weight at metamorphosis was very high. The Food Quality Index was very high from 1994-95, including a very large amount of rotifers and Vorticella. As in P5 large coverings of purple sulphur bacteria appeared. There was successful natural breeding in 1994 coincident with flooding of the 10 m wide buffer zone. The area of the pond was about 80 m2.
Figure 4.26 Vandhul P9 i 1995. Billede taget fra nordvest. P10 
Pond P10. The survival of the small tadpoles was at average but growth and survival of the large tadpoles were good. The Food Quality Index was medium in 1995.
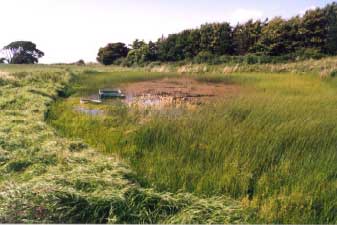
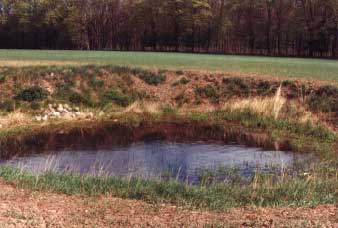
Figure 4.27 Vandhul P10 i 1993. Billede taget fra sydøst. The average weight at metamorphosis was low. There was successful natural breeding in 1993-95. The area of the pond was about 40 m2 and the pond is situated in a camping site. P11
Pond P11. The survival of small tadpoles was average but growth and survival of the large tadpoles were good. The Food Quality Index was medium in 1995. The weight at metamorphosis was low in 1994 but average in 1995. Successful natural breeding occurred in 1993. Nine-spined sticklebacks entered the pond in 1994 and in 1994-95 no breeding occurred. In 1996 the pond was emptied and the sticklebacks were removed with nets. Hereafter breeding was again successful. The pond is situated in a grazed meadow. The area of the pond was 1,100 m2.
Figure 4.28 Vandhul P11 i 1993. Billede taget fra sydøst. 5 Effects of pesticidesAnalysis of variation There was significantly less variation between the cages within ponds than between ponds in all three years for metamorphosis time and weight and for growth rate in the first week but not in the second week (table 5.1). Growth rate in the second week can therefore not be used for evaluation of pesticide effects. Table 5.1 Statistisk test af variation i vækstparametre mellem bure indenfor vandhuller og mellem vandhuller. Signifikans betyder at variationen mellem vandhuller var større end variationen mellem bure i de enkelte vandhuller. I 1993 og 1994 var der ingen forskel i metamorfosetid mellem bure inden for vandhuller og en ANOVA kunne derfor ikke udføres.
All correlations tested All growth and survival parameters of tadpoles in the individual years were tested for correlations with contamination of herbicides, insecticides, fungicides and pesticides. Only a few significant correlations were found. Survival to metamorphosis was significantly negatively correlated with contamination with herbicides in 1995 (rs=-0.781, p<0.05). Contradictory correlations In 1993 there was a significant negative correlation between contamination with insecticides (rs=-0.869, p<0.02) and fungicides (rs=-0.741, p<0.05) and metamorphosis weight (figure 5.1). The opposite connection, a significant positive correlation between fungicide (rs=0.751, p<0.05) and pesticide contamination (rs=0.721, p<0.05) and metamorphosis weight, was found in 1995. In 1995 there was a significant negative correlation between survival of the small tadpoles from week 2-4 and fungicide contamination (rs=-0.835, p<0.02). In 1994 the growth rate of tadpoles in the first week was significantly negatively correlated with contamination with fungicides (rs=-0.723, p<0.05). Food Quality Index was not correlated with any pesticide contamination.
Figure 5.1 Spearman Rank korrelationer mellem metamorfose vægt og insekticid-rank (rs=-0,869, p<0,02) og fungicid-rank (rs=-0,741, p<0,05) i 1993. Pesticiderne er rangordnet med største værdi til højeste koncentration/største eksponering. 6 Discussion
6.1 Pesticide concentrationsThere are very few reports on pesticide contamination of ponds. On the contrary, pesticides in ditches, streams and watersheds have been examined numerous times. Therefore concentrations of pesticides in running waters has to be included for evaluation of results obtained in this investigation. 6.1.1 HerbicidesConcentrations exceed previous Danish results Herbicides ranged up to 11.44 μg/l in this investigation and were detected in ponds P1-P8 and P10. The concentrations exceed previous results from four Danish ponds where mechlorprop, 2,4-D and MCPA were found in concentrations between 0.1 and 1.1 μg/l (Mogensen & Spliid 1997). In a southern Danish stream on clay soils, Højvands rende, mechlorprop and other phenoxy acids were found in concentrations of 20-5300 ng/l (Mogensen & Spliid 1997). In a stream in Fyn County situated in an agricultural landscape maximum concentrations of the herbicides bentazone, hexazinone, isoproturon and mechlorprop from 1994-96 were between 1 and 10 μg/l (Wiberg-Larsen & Pedersen 1997). Out of the totally 19 detected pesticides in the present investigation 14 were herbicides. Herbicides generally seemed to be more persistent in the pond water than the insecticides and fungicides and often two or more herbicides were present in the same sample. In accordance with this Spliid (2001) found herbicides more frequent than insecticides and fungicides in drainage water in Danish clay soils. In southern Sweden Kreuger (1998) found that the clear majority of pesticides found in stream water in an agricultural catchment area were herbicides and some of the herbicides were found to persist during a year after spraying. 6.1.2 InsecticidesNormal concentration in Denmark Insecticides were found in concentrations up to 460 ng/l (pirimicarb) which is in accordance with concentrations found in surface waters in other investigations in Denmark. In Ringkøbing County, dimethoate and pirimicarb were found at concentrations of 560 ng/l and 230 ng/l respectively (Mogensen & Spliid 1997). In Fyn County, dimethoate and pirimicarb have reached concentrations of 200 ng/l and 600 ng/l respectively (Wiberg-Larsen & Pedersen 1997). Peak surface water concentrations of 2.5 mg/l of the pyrethroid insecticide fenitrothion in small Canadian forest ponds have been reported by Ernst et al (1991). The high level of insecticide was reached as a result of spraying by aircraft and the samples were taken 15 minutes after the spraying was performed. Mean surface water concentrations ranged from 0.04 to 1.5 mg/l in six ponds. In Kansas, dimethoate reached 4.3 μg/l at maximum and a mean of 1.9 μg/l in tailwater drainage pits collecting run-off irrigation water (Kadoum & Mock 1978). Insecticides were generally found in much lower concentrations than herbicides and the concentration of insecticides diminished quickly after application. Pirimicarb was reduced from 240 to 60 ng/l from the day of spraying till 2 days after. In tailwater drainage pits, Kadoum & Mock (1978) found herbicides to occur more frequently than insecticides, and insecticidal residues were usually not found at the end of the growing season. Heinis & Knuth (1992) showed that 90 % of the applied amount of esfenvalerate disappeared from the water column within the first 24 hours after spraying with an initial concentration of 5 μg/l. Mogensen et al (in press) have found fast disappearance of the pyrethroid insecticides fenpropathrin, permethrin, esfenvalerate and deltamethrin from the water column in artificial experimental ponds. The insecticides were sprayed onto the surface of the ponds and were evenly distributed in the water column within the first day. The concentration in the water decreased fast mainly due to adsorption of the insecticides to sediment particles. Low persistence of insecticides Low persistence of insecticides Pyrethroid insecticides adsorb fast to vegetation, algae, suspended organic matter and sediment and thereby complicate detection and evaluation of risk (Heinis & Knuth 1992; Pedersen 1999). Insecticides are designed for rapid disappearance from the environment and are often highly degradable (Smith & Stratton 1986). Rapid degradation and adsorption may explain the frequent observations of no insecticides or only low concentrations in the ponds following application to surrounding fields. Possibly higher peak concentrations Out of seven detections of pirimicarb in 1995, the highest concentration was 460 ng/l on the 9th of July. The sample was taken a few hours after application in a pond with a 10 m wide buffer zone. It is likely that other ponds with more narrow buffer zones might have reached higher initial concentrations of insecticides than the highest detected values of 130-150 ng/l. If samples in all cases had been taken within a few hours after spraying, the actual maximum concentrations would have been obtained. Such a procedure was impossible in this investigation. 6.1.3 FungicidesGenerally low persistence Like the insecticides, the fungicides fenpropimorph and propiconazol were less persistent than the herbicides. In P8 in 1994 the persistence of fenpropimorph and propiconazol could be compared. Although it is prohibited to use fenpropimorph and propiconazol within 20 m from lakes (Petersen et al 1998), the water in pond P8 was contaminated with both fungicides three times in the spring 1994, possibly as a result of spray drift. In all three cases the concentration of fenpropimorph decreased much faster than the concentration of propiconazol. In a pond water/sediment system the degradation time (DT50) to half concentration was 5 days for fenpropimorph compared to 30 days for propiconazol (DEPA 1996a, DEPA 1996b). Given the low persistence of especially fenpropimorph it is obvious that some of the peak concentrations reported easily could have been much higher. 6.2 Sources of contaminationSpray drift Rain Spray drift of pesticides was presumably the major source of contamination of ponds. However other sources may also have been involved. In the present investigation phenoxy acids were often found in concentrations of 10-350 ng/l, even though the same herbicides were not applied to the surrounding fields that year. Contamination of pond water by rain is a possibility as rain water in Denmark can contain up to 400 ng/l of MCPA and dichlorprop, and up to 130 ng/l of mechlorprop (Mogensen & Spliid 1997). Phenoxy acids can also appear in high concentrations in groundwater in Denmark (Mogensen & Spliid 1997). Many herbicides are persistent in the environment and may wash out from the top soil to surface waters either by run-off incidents, or through horizontal migration of pore water during heavy rain fall or by drainage water (Wauchope 1978; Kadoum & Mock 1978; Nicholaichuk & Grover 1983; Thurman et al 1992; Klöppel et al 1994; Aderhold & Nordmeyer 1995). In Danish sand and clay soils sudden leaching of several pesticides to drainage depth as a result of short rain events has been shown with concentrations up to 2.84 mg/l (Spliid & Køppen 1998; Spliid 2001). In P10, which is situated in a camping site on the east coast of Fyn, 580 ng/l of 2,6-dichlorbenzamid also known as BAM was found in December 1997. BAM is a breakdown product of the herbicide dichlobenil. Dichlobenil has probably been used to remove vegetation from small unpaved roads on the camping site. The pond P10 is situated about 30 m from an unpaved road. After breakdown of dichlobenil BAM has probably been washed into the nearby pond through the soil. Buffer zone can minimize transport Run-off An established vegetation in a buffer zone can filter out eroded soil during run-off incidents and thereby minimize the transport of pesticides adsorbed to soil particles (Nicholaichuk & Grover 1983; Klöppel et al 1994). All ponds were filled by surface water and water originating from secondary ground water sources. P5 also had an inlet of drainage water from 2-3 hectares of farmed land. Some contamination of pesticides has undoubtedly been transported to the ponds by run-off surface water, migration of pore water or by drainage water in P5. It was not possible to detect any influence of the drainage water on the contamination of pond P5 with pesticides. Pond P5 was one of the least contaminated ponds. 6.3 Buffer zone and spray driftBuffer zones reduced contaminations The buffer zones were found to reduce contamination of the ponds with pesticides. Findings of pesticides in ponds was reduced significantly by increasing width of buffer zone between 1-10 m. There was also found a tendency (non significant) towards decreasing maximum concentrations of pesticides with increasing width of the buffer zone (1 to 10 m). Maximum pesticide concentrations during the three year investigation period never exceeded 0.5 μg/l in ponds with buffer zones of more than 4 m but was above 1 μg/l in ponds with buffer zones of 4 m or less in 4 out of five cases. The results show that a buffer zone reduces the deposition of pesticides in ponds probably by filtering out pesticides in the vegetation. But even a buffer zone of 10 m did not offer complete protection against contamination with pesticides. 6.3.1 Establishing a safe distanceSafe distance varies between organism and lifestyle Establishing safe dimensions for buffer zones is a vital issue and a matter of increasing concern in Denmark. The width needed depends on the organism or life stage that is in focus. According to de Snoo & de Wit (1998) a buffer zone of only 3 m decreases drift deposition in a ditch by 95 % and a buffer zone of 6 m eliminates drift deposition. The results from de Snoo & de Wit was found using water sensitive paper and it is doubtful if the safe distance given is adequate in all circumstances given the results in the present investigation. Other investigators have shown that at least for some species, younger plants are more susceptible to herbicide drift than established plants (Marrs et al 1991; Marrs et al 1993). This may alter the ecological balance by reducing the diversity of plant species in field margins and buffer zones (Marshall 1987), or by replacing sensitive species by resistant species (Marrs & Frost 1997). In earlier experiments with established perennials, the width of buffer zones sufficient for protection of vegetation were estimated to be 6-10 m (Marrs et al 1989). Later experiments with seedlings have shown that buffer zones must be 20 m wide to protect regeneration of vegetation by seedlings (Marrs et al 1993). Extremely sensitive plant species may need a safe distance of 100 m or more for complete protection (Nordby & Skuterud 1975; Byass & Lake 1977). Davis et al (1993) showed in an experiment with the highly toxic pyrethroid insecticide cypermethrin that safe distances for reducing mortality of butterfly larvae (Pieris brassicae) to 10 % were between 16 to 24 m. Buffer zones of 10 m are not enough In conclusion, most results comply with findings in this investigation that buffer zones of 10 m are not sufficient to protect sensitive environments from spray drift of pesticides. 6.3.2 Height of vegetationNo effect of height of vegetation The height, structure and density of the vegetation in buffer zones will affect the turbulence of a drifting cloud of pesticides and thereby alter the probability of deposition within the buffer zone (Marrs et al 1993). By increasing vegetation height, the roughness coefficient, Z0, and the eddy or frictional velocity, U*, increases, causing increased deposition of small droplets. How ever in this investigation the height of the vegetation in the buffer zone (0.1 - 1.0 m) did not correlate with maximum pesticide concentrations in ponds. Deposition of spray complex Greater risk in spring and autumn It seems surprising that buffer zone height had no effect on maximum pesticide concentrations in this investigation. The reason may be that the number of investigated ponds or the span of height of buffer zone (0.1 - 1 m) were too small to yield a statistical difference. The lack of comparability in methodology, e.g. in density and structure of vegetation, boom height, working pressure, wind speed and time elapsed between spraying and sampling, makes the comparison of results and detection of differences difficult. Marrs et al (1991) did not either find a connection between height of vegetation in buffer zone and spray drift, but ascribed the missing connection to the complex pattern of deposition of spray under field conditions. Davis et al (1993) failed to connect deposition of drifting droplets to vegetation height due to large variations in methodological variables. Longley & Sotherton (1997) found that autumn spraying, when compared to summer spraying, involved greater risks of spray drift because of lower vegetation in both field and buffer zone. Spraying in spring compared to summer should therefore also involve greater risks. Hedges limits spray drift To effectively reduce a drifting cloud of pesticide within a short distance the vegetation of the buffer zone has to be significantly higher than the crop. Hedges in the buffer zone limits spray drift significantly (Davis et al 1993; Longley et al 1997). Planting a hedge consisting of 2-3 m high bushes in the buffer zone should increase the ability of the buffer zone to filter out pesticide drift, thereby preventing contamination of ponds. Amphibians breed in partly or fully sun-exposed ponds and therefore it is important not to plant bushes or trees that will shade ponds. 6.3.3 Practical measures to minimize spray driftWind speed Boom height and working pressure A few measures can be taken to effectively minimize spray drift. Maybank et al (1978) found that the amount of drift increased linearly with the wind speed (2–7 m/s). Spraying should therefore be carried out in the lightest wind possible (Maybank et al 1978) and not stronger than 3 m/s (Nordby & Skuterud 1975; Longley & Sotherton 1997). Wind speeds often vary during the day and are normally lower in early morning than later in the day. Spraying in the morning is therefore recommended. The boom height and working pressure has a huge effect on drift (Nordby & Skuterud 1975; Maybank et al 1978). Spraying with a boom height of 40 cm instead of 80 cm and a working pressure of 2.5 bar instead of 10 bar, reduced initial drift by 50 % (Nordby & Skuterud 1975). Spray drift will be reduced if spray droplets are changed from fine to coarse (Murphy et al 2000). Maybank et al (1978) also point out that the use of thickeners and application of higher total volume can reduce the level of initial drift. 6.3.4 Effect of farm sizeIn 1993, high concentrations of pesticides (up to 7.475 μg/l) appeared in ponds on the relatively small farms/fields on Avernakø (P1-P7), and low concentrations (<130 ng/l) appeared in pond P8 on the large farm/field on the east coast of Fyn. In 1994 the maximum concentrations were a few hundred ng/l on Avernakø (P1-P7, P9), but more than 11 g/l in P8 on the large farm. In 1995 again there were peak concentrations of up to 3 μg/l in P8, whereas concentrations on Avernakø (P1-P7, P9) did not exceed 500 ng/l. Observations of tracks in the field made during spraying showed that spraying was done at distances from the ponds that varied from year to year. This may be the main reason for the large year-to-year variation. Therefore this investigation cannot conclude that a certain size or type of farm causes less chance of contaminating ponds with pesticides. Cautiousness from the workers is probably far more important. 6.4 Food Quality IndexHigh FQI increased growth Bombina bombina tadpoles feed upon epiphytic layers of algae, bacteria, protozoa, ciliates and rotifers on stems of plants (Mossin 1988; Andersen 1992). Established plant communities were found in all ponds. Cages and bags served as substrates for epiphytic growth in the experiments, and thereby acted as a substitute for the lack of vegetation in the enclosures. An increase in FQI, the amount and quality of food available to tadpoles, had a positive effect on the growth of the tadpoles. Effect of herbicides in P8 No direct effect on algae There were no significant correlations between FQI and use of herbicides, fungicides or insecticides. Since algae diversity is the main component of FQI, it was expected that herbicides could have an influence on FQI. Only in P8 a connection between herbicide contamination and FQI was revealed. The amount and diversity of food sources for the tadpoles were very low in P8 in 1995 due to a very low diversity of algae and due to the absence of Leptothrix bacteria. Maximum concentrations of herbicides were 11.4 μg/l of mechlorprop in 1994, and 2.1 μg/l of clopyralide, and 2.3 μg/l of propyzamide in 1995. The high level of herbicides was possibly the main reason for the complete dying out of the dominating Sparganium erectum vegetation in the pond. The decay of a complete vegetation releases a large amount of nutrients and the ecosystem was altered dramatically when the vegetation changed from macrophytes to a dense cover of filamentous algae, keeping out all light and thereby reducing the biomass and diversity of epiphytic algae. Probably no direct toxic effects of herbicides on algae occurred in P8 but the effect of the herbicides were indirect by removing the plants which the epiphytic community of algae, bacteria and protozoa depends up on. Hormone type herbicides Hormone type herbicides like MCPA and 2,4-D have EC50 values of 85 and 98 mg/l on a Scenedesmus algae (Fargasova 1994). In another investigation, the application of 2,4-D, resulting in a concentration of 140 g/l, eliminated all plants in an irrigation channel (Akinyemiju & Bewaji 1990). In this investigation residues of 2,4-D were found in most of the ponds, but the concentrations were below detection limits (10-500 ng/l). MCPA reached a maximum concentration of 172 ng/l in P2 in 1993. For hexazinone the EC50 for growth inhibition of green algae, diatoms, duckweed and cyanobacteria were respectively 10, 50, 70 and 600 g/l (Peterson et al 1997). In this investigation hexazinone was only detected in P7 in 1995 at a concentration of 70 ng/l. Hormone type herbicides did probably not occur in harmful concentrations in the ponds in this investigation. Effect of propiconazol In P8 concentrations of propiconazol reached 1.214 μg/l and 2.968 μg/l in 1994 after spraying of the formulated product Tilt Megaturbo (active ingredient fenpropimorph and propiconazol) 3 times (April, May and June). According to DEPA (1996b) the EC50 of propiconazol is 9 mg/l for the aquatic plant Lemna gibba (duckweed), 93 μg/l for the algae Navicula seminulum and 21 μg/l for the marine algae Skeletonema costatum. When using the formulated product Tilt 250 EC (active ingredient propiconazol) effects on algae appear at much lower concentrations. In a five days experiment with Tilt 250 EC half of the algae Skeletonema costatum was killed by 0.7 μg/l of propiconazol (DEPA 1996b). No direct effect on algae It seems obvious that in this investigation the contamination of herbicides was too small to have a direct effect on algae diversity. But the contamination of P8 in 1994 with the fungicide propiconazol may have affected the algae. The Food Quality Index is unfortunately not available from P8 in 1994 and it is not known what the initial concentrations were in the pond just after the pesticide spraying. Further, there are also too few reports available concerning toxicity of formulated pesticides towards fresh water algae. Therefore no conclusions can be drawn. Effect on protozoa and other small organisms The herbicide isoproturon has a negative effect on the ciliate Tetrahymena with EC50 of >1.1 mg/l (Traunspurger et al 1996). In the same investigation no effects of isoproturon were observed on rotifers. The effects of three insecticides on Tetrahymena were tested in the laboratory (Larsen 1997). There were no effects of cypermethrin at 20 μg/l, which was the highest concentration tested. Pirimicarb and dimethoate showed a dose dependent effect on growth at concentrations above 200 and 500 mg/l respectively. A concentration of 50 μg/l of the pyrethroide permethrin kills rotifers effectively in experimental lake enclosures. The effect is short-lived however, and the population can recover within 3-4 weeks (Smith & Stratton 1986). Only at concentrations exceeding 50 mg/l there has been demonstrated an effect of propiconazol on protozoa (DEPA 1996b). It seems very unlikely that pesticides had a direct effect on protozoa and other small animals in this investigation. Leptothrix bacteria are known to be an important food source for Bombina bombina tadpoles in some ponds (Mossin 1988). Very few data are available on the effects of pesticides on microbes. Smith & Stratton (1986) report that the insecticide permethrin, when tested in situ at concentrations up to 10 mg/kg in mineral and organic soils, showed no long-term effect towards numbers of bacteria and fungi. The methane production of a freshwater sediment was almost completely inhibited as a result of 90 μg/l of isoproturon (Traunsburger et al 1996). Probably the inhibition of methanogenesis was caused by one or more metabolites of isoproturon degradation. Another herbicide, simazine reduced methanogenesis in homogenised sediment samples at concentrations of 20 mg simazine/l when incubated for one week (Isolda & Hayasaka 1991). Due to the very high, effective concentrations of pesticides reported and low concentrations obtained in this investigation, it is not likely that pesticides had an effect on the diversity and quality of food for the tadpoles except indirectly in P8. 6.5 Survival and growth of eggs and tadpoles6.5.1 Hatching of eggsHatching in spraying season Except for P3 in 1995 hatching of eggs was almost 100 % successful in all ponds, which reflects that the eggs were of a high quality. Hatching of eggs occurred during the end of May and beginning of June which coincided with the middle of the spraying season. In May 1995 the herbicides tribenurone and fluroxypyr were sprayed around P3 and 4 days later it was observed that the development of about half of the embryos was arrested. Only 47 % of the eggs hatched. Tribenurone and fluroxypur could not be detected by the laboratories and contamination of the pond could therefore not be verified. The pyrethroide insecticide fenitrothion (8 mg/l) and the herbicides triclopyr (4.8 mg/l) and hexazinone (100 mg/l) had no effect on hatching of embryos of Rana pipiens, Rana clamitans and Rana catesbeiana under laboratory conditions (Berrill et al 1994). According to Larsen & Sørensen (2004), periodic spasmodic twisting was induced in embryos of both Xenopus laevis and Bombina bombina at 1 μg/l of the pyrethroide esfenvalerate (LOEC, 120 hr). Malformations of embryos of B. bombina increased with increasing concentration of esfenvalerate from 5 μg/l (LOEC) with an EC50 value of 29 g/l. No inhibition of growth or increased mortality of embryos was found at the highest tested concentration, 150 μg/l. No levels of pyrethroids in this investigation even came close to the LOEC of esfenvalerate found by Larsen & Sørensen (2004). In conclusion, the embryo when still inside the egg was probably not a particularly vulnerable life stage to pesticides for B. bombina in this investigation. 6.5.2 Survival of tadpolesSmall tadpoles vulnerable The survival of the tadpoles was often negatively affected during the first 14 days after hatching indicating that this life stage is one of the most vulnerable periods in the life of tadpoles. Berrill et al (1997) have found that newly hatched tadpoles are vulnerable to exposure to low concentrations of herbicides and insecticides. Bromoxynil caused extensive mortality among Rana clamitans tadpoles at 10 μg/l, and the pyrethroids permethrin and fenvalerate caused paralysis or at least much weakened responses in tadpoles of R. clamitans and Rana pipiens also at 10 μg/l. The embryos of the same species were unaffected by exposure to the same concentrations of pesticides (Berrill et al 1997). This fact underlines the vulnerability of the newly hatched tadpoles. Predators important There seems to be a number of possible threats to tadpoles besides the pesticides. In 1993-94 the experimental bags were made of large-meshed nylon (1*1 mm) which made entering of small leaches possible. Intruding leaches were found to have caused the death of all tadpoles in 2 cases from 1993-94. New bags of finely-meshed nylon (0.1*0.1 mm) were used in 1995 which made it possible to separate the tadpoles from predators. In 7 out of 10 cases of low survival from 1993-95, sulphur bacteria (indicating a low oxygen concentration) were abundant. There were no cases of good survival when sulphur bacteria was abundant. The young tadpoles do not breathe by lungs and therefore depend solely on the oxygen in the water. They also have a low mobility in this stage. It is therefore possible that they were killed either because of a low oxygen concentration or because of the presence of the highly toxic H2S. Fungicide correlation coincidental There was a significant negative correlation between fungicide concentration and survival of 14-30 days old tadpoles in 1995. But only minor concentrations of fungicides were found in the ponds this year. Given all the other possible mortality factors for newly hatched tadpoles mentioned above, the correlation might as well be coincidental. Large tadpoles less vulnerable The cage experiment started with tadpoles of 0.2 g. At this stage the tadpoles are very mobile and therefore have a good chance of escaping intruding predators or areas with low oxygen tension or presence of H2S. Furthermore, they have developed lungs and are able to breathe air at the surface. Tadpoles in ponds with large coverings of sulphur bacteria and large numbers of predators such as leaches, did not have the same low survival rate as demonstrated for the small tadpoles in the bag experiments. Small variations in water temperature Survival of tadpoles to metamorphosis was negatively correlated with herbicide concentration and positively correlated with FQI in 1995. It could be that the herbicides primarily reduced FQI and thereby indirectly reduced the fitness of the tadpoles. But these correlations might also be coincidental. In 1995 no significant correlations could be found between herbicides and any other growth parameters. Herbicide contamination – low survival of tadpoles The herbicide contamination was worst in P8 in 1995, when the lowest survival of tadpoles occurred with only one out of 40 surviving to metamorphosis. In 1993 and 1994 the highest survival of the large tadpoles in cages was found in P8. It is not likely that the tadpoles were killed by the herbicides in 1995. According to Cooke (1972), the herbicide 2,4-D had no effect on tadpoles of Rana temporaria and Bufo bufo in a laboratory experiment even at 50 mg/l. In a laboratory bioassay Sanders (1970) showed that 2,4-D has an LC50 value of 100 mg/l towards Pseudacris triseriata tadpoles. The reason for the very low survival may be that the ecosystem in the pond was completely altered after the disappearance of the dominating macrophytes. Although all filamentous algae were removed from the cages every week the layer of algae became so dense between the weekly cleanings that the tadpoles might have been caught in it and killed during the night due to depletion of oxygen. The food sources of the tadpoles disappeared almost completely as the algae diversity was reduced to a thin layer of only two species in May. Also the low water level in the end of the experiment (10 cm) in combination with a probably high oxygen demand of the decomposing vegetation have probably stressed the tadpoles. Thick coverings of sulphur bacteria were found in the cages in P8 in 1995. Poor conditions for the tadpoles could have made them more susceptible to predation by leaches that could enter the cages. The growth rate of the tadpoles was at average in 1995 although the survival was very low and therefore not as poor as could have been expected due to the very low FQI. A possible explanation might be that the tadpoles utilised epiphytic coverings in areas periodically open due to the weekly removal of filamentous algae. By the decay of the macrophytes a large amount of dissolved organic material was probably released to the water. The tadpoles might also partly have lived on filtering out the dissolved organic material from the water as the epiphytic food sources were very scarce. 6.5.3 Growth of tadpolesFrom a previous investigation it is known that the water temperature has some importance for growth of Bombina bombina tadpoles (Andersen 1992). In this investigation however, there were no correlations between water temperature and parameters regarding hatching of eggs, growth of tadpoles or weight and time at metamorphosis. The reason is probably that all ponds were selected to be shallow and fully exposed to the sun in order to minimize differences in temperature between ponds. Also an effect of differences in temperature between ponds was partly counterbalanced since the tadpoles would search the optimal temperature in the cages. There are nevertheless some indications from this investigation that temperature could be of importance during the weeks of the cage experiment. The lowest growth rate for tadpoles in week one was found in P5 and in P6 in 1994 where also the lowest water temperatures in the experiment were recorded. In 1995 the lowest growth rate of tadpoles in week one and the lowest temperature was found in P5 and P7. Besides these examples, no other effect of temperature on growth rate could be found. 6.5.4 MetamorphosisSmall metamorphs in new ponds The abundance of protozoa in P9 in 1994 may be the reason that the highest average metamorphosis weight during the investigation occurred in P9 that year. In P10 and P11 situated in a non-cultivated landscape the metamorphosis weight were low compared to the other ponds. The reason is probably that P10 and P11 were newly dug with a clay bottom and therefore presumably less eutrophic than the other ponds. Bombina bombina prefers natural eutrophic ponds with a thick sediment of mud (Andrèn et al 1984) which partly can be explained by a higher density of epiphytic growth on plant stems. Effect of low water level Only in P8 the water level decreased considerably in the cages during the experiment. In 1993 the tadpoles metamorphosed early in P8 compared to the other ponds. This may have been caused by the low water level, but in 1994 and 1995 no effect of low water level was seen on metamorphosis time. Amphibians are seen to accelerate their development if endangered by desiccation (Duellman & Trueb 1994). Correlations with pesticides In 1993 there were significant negative correlations between both fungicide and insecticide contamination and weight at metamorphosis. This was the only year where insecticides were sprayed on fields at five ponds and fungicides on fields at four ponds before mid June. Insecticides could be detected in three ponds and high concentrations of fungicides (3.550 μg/l and 7.475 μg/l) were found in two ponds this year. In 1994 insecticides were not detected, and in 1995 insecticides were sprayed in the period 25th of June to 9th of July. In 1995 weight at metamorphosis correlated significantly positive with fungicide and pesticide contamination. Much higher concentrations of fungicides were found in the ponds in 1993 than in 1995. Around four ponds the fields were sprayed with fungicides before mid June, and at three more ponds fungicides were sprayed on fields 25th of June in 1995. The potential contamination of ponds with fungicides was not less in 1995 than in 1993. Therefore the results are contradictory and offer no basis for conclusions. Only the negative correlations between both insecticides and fungicides and metamorphosis weight in 1993 make sense. But given the small scale of the investigation and frequency of contaminations of the ponds, the correlations can be coincidental. Synergistic and additive effects Synergistic (Lichtenstein et al 1973) or additive (Bailey et al 1997) effects are possible when pesticides appear together in the same environment. Synergism of organophosphorus, carbamate and chlorinated hydrocarbon insecticides by the herbicides atrazine, simazine, monurone and 2,4-D have been reported by Lichtenstein et al (1973). Fairchild et al (1994) failed to show synergism of the insecticide esfenvalerate by atrazine, probably because of rapid aqueous dissipation of esfenvalerate. Bailey et al (1997) have shown that the organophosphorus insecticides diazinone and chlorpyrifos exhibit additive toxicity. Synergistic or additive effects could not be shown in this investigation, but in P3, P4 and P6 in 1993, and in P8 in 1994 and 1995 high concentrations of fungicides and herbicides respectively were supplemented with the presence of other types of pesticides. Effect of pesticides on tadpoles Pesticides may influence the weight and fitness at metamorphosis by altering the behaviour of tadpoles or by inducing damages in tadpoles. Berrill et al (1993) found effects as delayed growth, abnormal backs and twisting behaviour in tadpoles of Rana clamitans from exposure of embryos to 0.1 mg/l of the pyrethroide permethrin. Periodic spasmodic twisting in embryos of Xenopus laevis and Bombina bombina was seen from 1 g/l of esfenvalerate (Larsen & Sørensen 2004). Marian et al (1983) found that Rana tigrina tadpoles suffered significant reduced size at metamorphosis as a result of exposure to 0.1 mg/l of the insecticide carbaryl. Because pyrethroids are rapidly adsorbed to organic matter (Ohkawa et al 1980), tadpoles may increase their exposure to esfenvalerate by their feeding behaviour. Beginning malformations of the gut have been found in embryos of B. bombina at 5 μg/l of esfenvalerate by Larsen & Sørensen (2004). The effect was dose dependent and at 100 μg/l all embryos suffered from malformations in the gut, heart, abdomen and eyes. Xenopus laevis was also tested in this experiment and showed the same response to esfenvalerate but at much lower concentrations. Thus the EC50 for malformations of X. laevis and B. bombina was 3 μg/l and 29 μg/l respectively. Pirimicarb and dimethoate are not as toxic as esfenvalerate but the concentrations needed to reduce activity in tadpoles are unknown. Pirimicarb has been shown to cause malformations of tadpoles of Rana perezi when exposed to concentrations of 250 μg/l (Alvarez et al 1995). Damages on vital internal organs and increased mortality of R. perezi tadpoles are caused by pirimicarb at concentrations of 70 mg/l (Honrubia et al 1993). Such high concentrations are not likely to have occurred in this investigation and therefore it is believed that insecticides did not have direct effects on the tadpoles of Bombina bombina. In this investigation 3-4 different pesticides were often found in the same samples and some of the pond ecosystems were subjected to repeated exposures to pesticides at low concentrations. Reports on synergistic or additive effects on tadpoles by repeated exposures to low concentrations of the most commonly used fungicides and insecticides are not available at present. Such a investigation would provide a better basis for evaluation of the actual risks of amphibians under typical field conditions. Size and fitness The size at metamorphosis determines the size (males and females) and time (only females) of first reproduction in the newt Ambystoma talpoideum (Semlitsch et al 1988). A reduction in growth of tadpoles will increase risk of predation and delay the time of metamorphosis. Salamanders metamorphosing early were larger at first and second reproduction compared to late-metamorphosing individuals (Semlitsch et al 1988). A delay of metamorphosis also increases the risk of desiccation in temporal ponds which are preferred as breeding ponds by many amphibian species including Bombina bombina. Sublethal concentrations of pesticides can therefore reduce the reproductive potential of an amphibian population and thereby increase vulnerability to other threats. Induction of abnormal behaviour as partial paralysis and twisting will increase vulnerability to predation (Berrill et al 1993). Pesticide induced hyperactivity can also increase risk of predation. Cooke (1971) has shown that DDT-treated hyperactive tadpoles of Rana temporaria were predated selectively by the newt Triturus cristatus. 6.6 Survival of adultsSurvival connected to degree of cultivation The yearly survival of adults was in general higher in uncultivated areas than in cultivated areas. The yearly survival was up to 94 % in areas with less than 50 % of the habitat being cultivated. In areas with intensive cultivation as on Avernakø, the yearly survival did not exceed 60 %. Low adult survival (43 %) also occurred in one case in an uncultivated landscape (Knudshoved Odde) which could reflect natural oscillations in survival of an isolated population (Duellman & Trueb 1994). A 1990-cohorte of young Bombina bombina from the island Hjortø (50 % cultivation) had a significantly faster growth rate (1990-92) than a 1990-cohorte of young B. bombina from the island Avernakø (90 % cultivation) (Briggs 1993). The anuran species diversity and density in a vegetable growing area has been shown to be significantly lower relative to nearby uncultivated wetlands (Bishop et al 1999). Mechanical disturbance An increased mortality in agricultural habitats could be a result of mechanical disturbance by agricultural machinery. Dürr et al (1999) found that ploughing caused the death of more than 90 % of juvenile migrating amphibians because they were buried alive (including Bombina bombina). Cultivation of a stubble field did not damage amphibians, but mulching of plants with a flair mower caused the death of 30 % of Rana arvalis in wet spots in fields (Dürr et al 1999). Furthermore the lack of hideaways in a modern agricultural landscape increases the risk of desiccation and predation during migration. Especially for amphibian populations dependent on crossing large fields during migration ploughing and the lack of shelters are important factors for adult survival. On Avernakø, B. bombina often crosses fields to reach ponds or winter habitats several times during a year, provided the distance does not exceed 200-300 m (Briggs 1993). When migration coincides with cultivation of fields the death of a large percentage of the population of B. bombina is to be expected. Crops as winter wheat and winter rape requires ploughing of the fields in August-September which is coincident with the migration period of B. bombina. These crops are commonly used on Avernakø and this might partly explain the lower survival of B. bombina in this highly cultivated area. Contact with fertilizer grains Migrations across fields impose a serious risk to amphibians due to the possible contact with fertilizer grain and pesticides. Nitrate and potassium from the fertilizers easily diffuse across the highly permeable skin of amphibians and damage the nervous system (Nielsen & Schouboe 1990). Schneeweiss & Schneeweiss (1997) showed that fertilizers killed 75 % of spring migrating amphibians on a field the first three days after application of fertilizer. Repeating the experiment in the autumn resulted in the death of all migrating amphibians the first day after application. Both in spring and autumn there was zero mortality of migrating amphibians before application of fertilizer. Dürr et al (1999) found that fertilizer grains had almost no effect on migrating amphibians as long as the ground was not completely dry. The fertilizer grains take up water from the soil and this reduces the toxicity towards amphibians (Dürr et al 1999). On Avernakø fertilizer grains have been observed lying undissolved on the ground for 14 days from late April to early May. In dry and sunny periods B. bombina males are calling from the ponds, competing to attract females. Both sexes migrate from the hibernating sites to the ponds and between ponds during this period. According to Schneeweiss & Schneeweiss (1997) the frogs may suffer a high mortality during migration across fields with fertilizer grains. Pesticides and survival The knowledge concerning effects of pesticides on adult amphibians is limited. In field trials Dürr et al (1999) found no effects on juvenile Rana arvalis of spraying of the herbicide glyphosate on fields. DNA profiles can indicate whether a frog population is under pressure due to contamination with pesticides. Lowcock et al (1997) found a significant increase in abnormal DNA profiles in individuals from corn fields, relative to control sites for Rana clamitans in Quebec. This is believed to be a result of either acute or cumulative toxicity. None of the pesticides used in the investigation in Quebec were used in this investigation. It is possible that application of pesticides directly to the frog may cause increased direct mortality or indirect mortality by slowing migration speed, thereby increasing the risk of predation, being runned down by machinery, or desiccation during the migration. Indirect effects of pesticides Indirect effects of pesticides on adult amphibian survival could be reduction of diversity and abundance of invertebrate food. Skylarks which depend upon foraging in open fields had a 38 % reduction in numbers of fledglings from sprayed fields, when compared to skylarks from unsprayed barley fields. The abundance of food was generally higher in the unsprayed fields and compared with sprayed fields immediately after spraying it was three times higher (Odderskær 1997). Dover et al (1990) found that the populations of some species of butterflies increased as a result of reduced pesticide input to headlands of cereal fields. Unsprayed headlands have a higher coverage, density, biomass and species diversity of weeds as well as a higher density of nontarget arthropods when compared to herbicide treated headlands (Chiverton & Sotherton 1991). Serious threat to Bombina bombina A decrease in survival due to cultivation is a serious threat to Bombina bombina, because it lays relatively few eggs compared to other frog species (Briggs 1993). Frog species of the genus Rana have normal yearly survivals from 30-60 % (Turner 1960, Briggs 1993), and mortality also occurs due to cultivation of fields for Rana sp. (Schneeweiss & Schneeweiss 1997). Due to lower reproductive potential, B. bombina needs higher adult survival than other frogs to ensure a stable development of a population. 7 ConclusionFindings of pesticides decreased significantly with increasing width of buffer zone and there was found a tendency towards decreasing peak concentrations of pesticides with increasing width of buffer zone (1-10 m). In ponds with buffer zones wider than 5 m pesticide concentrations above 1,000 ng/l did not occur. Even buffer zones of 10 m width did not completely prevent contamination of ponds. Hatching of eggs was almost 100 % successful and was apparently not influenced by pesticides. Young tadpoles (0-30 days old) was shown to be the most vulnerable life stage. In 3 out of 8 cases there were a significant positive correlation between the Food Quality Index, representing the amount and quality of food sources for the tadpoles, and growth parameters of the tadpoles. This indicates that the quality and thickness of epiphytic coverings on stems of higher plants are probably of vital importance for the fitness of the tadpoles of Bombina bombina. Only in one case an indirect negative effect of pesticides on tadpoles was found. Probably because of contamination with herbicides, the higher plants in a pond was wiped out in 1995 and replaced by dense mats of filamentous algae, causing very poor survival of both newly hatched and large tadpoles. A few significant correlations between growth parameters of tadpoles and pesticide contamination was found, but the results were contradictory. At least some of the correlations must have been coincidental due to a low number of ponds investigated. Synergistic and additive effects on tadpoles of commonly used insecticides and fungicides at repeated exposures to low concentrations is recommended to receive more attention in future studies. Intensive cultivation can possibly reduce the yearly survival of adult frogs. Adult survival of 80-94 % was found on more natural habitats and 55-60 % in the most cultivated areas. Lower adult survival in cultivated areas are suspected to be caused by mechanical disturbance by heavy machinery and the use of fertilizers and pesticides. 8 ReferencesAderhold, D. & Nordmeyer, H. 1995: Leaching of herbicides in soil macropores as a possible reason for groundwater contamination. BCPC Monograph no. 62: Pesticide Movement to Water, pp. 217-222. Akinyemiju, O.A. & Bewaji, F.A. 1990: Chemical control of water hyacinth and associated aquatic weeds at Itoikin near Lagos. Proceedings EWRS 8th Symposium on Aquatic Weeds, pp. 3-8. Alvarez, R., Honrubia, M.P. & Herraez, M.P. 1995: Skeletal malformations induced by the insecticide ZZ-Aphox and Folidol during larval development of Rana perezi. Arch. Environ. Contam. Toxicol., 28, pp. 349-356. Andersen, A.M. 1992: Funktion af oprensning og nygravning af vandhuller til Klokkefrø på Fyn og de sydfynske øer. Specialerapport, Biologisk Institut, Odense Universitet. Andrèn, C., Nilson, G. & Podloucky, R. 1984: Council of Europe study on critical biotopes for threatened amphibians and reptiles: The fire-bellied toad Bombina bombina. Societas Europaea Herpetologica, Conservation Committee, pp. 1-29. Bailey, H.C., Miller, J.L., Miller, M.J., Wiborg, L.C., Deanovic, L. & Shed, T. 1997: Joint acute toxicity of diazinone and chlorpyrifos to Ceriodaphnia dubia. Environmental Toxicology and Chemistry, 16 (11), pp. 2304-2308. Berrill, M., Bertram, S., Wilson, A., Louis, S., Brigham, D. & Stromberg, C. 1993: Lethal and sublethal impacts of pyrethroide insecticides on amphibian embryos and tadpoles. Environmental Toxicology and Chemistry, 12, pp. 525-539. Berrill, M., Bertram, S., McGillivray, L., Kolohon, M. & Pauli, B. 1994: Effects of low concentrations of forest-use pesticides on frog embryos and tadpoles. Environmental Toxicology and Chemistry, 13 (4), 657-664. Berrill, M., Bertram, S. & Pauli, B. 1997: Effects of pesticides on amphibian embryos and larvae. In: Amphibians in decline: Canadian studies of a global problem. Edited by Heyer, W.R. Herpetological Conservation, 1, pp. 233-245. Bishop, C.A. 1992: The effects of pesticides on amphibians and the implications for determining causes of declines in amphibian populations. In: Declines in Canadian Amphibian Populations, pp. 67-70. Ottawa. Bishop, C.A., Mahony, N.A., Struger, J., NG, P. & Pettit, K.E. 1999: Anuran development, density and diversity in relation to agricultural activity in the Holland River watershed, Ontario, Canada (1990-92). Environmental monitoring and Assessment, 57, pp. 21-43. Briggs, L., 1993: Populationsbiologi for Klokkefrø med særligt henblik på artens bevarelse i Danmark. Specialerapport, Biologisk Institut, Odense Universitet. Byass, J.B. & Lake, J.R. 1977: Spray drift from a tractor-powered field sprayer. Pestic. Sci., 8, pp. 117-126. Carey, C. & Bryant, C.J. 1995: Possible interrelations among environmental toxicants, amphibian development, and decline of amphibian populations. Environmental Health Perspectives, 103 (S4), pp. 13-17. Chiverton, P.A. & Sotherton, N.W. 1991: The effects on beneficial arthropods of the exclusion of herbicides from cereal crop edges. Journal of Applied Ecology, 28, pp. 1027-1039. Cooke, A.S. 1971: Selective predation by newts on frog tadpoles treated with DDT. Nature, 229, pp. 275-276. Cooke, A.S. 1972: The effects of DDT, dieldrin and 2,4-D on amphibian spawn and tadpoles. Environ. Pollut., 3, pp. 51-68. Danish Environmental Protection Agency 1996a: Fenpropimorph, Sagens oplysninger og miljøstyrelsens vurdering, Toksikologi. Danish Environmental Protection Agency 1996b: Propiconazol, Sagens oplysninger og miljøstyrelsens vurdering, Toksikologi. Davis, B.N.K., Lakhani, K.H., Yates, T.J., Frost, A.J. & Plant, R.A. 1993: Insecticide drift from ground-based, hydraulic spraying of peas and brussels sprouts: Bioassays for determining buffer zones. Agriculture, Ecosystem and Environment, 43, pp. 93-108. de Snoo, G.R. & de Wit, P.J. 1998: Buffer zones for reducing pesticide drift to ditches and risks to aquatic organisms. Ecotoxicology and Environmental Safety, 41, pp. 112-118. Dover, J., Sotherton, N. & Gobbett, K. 1990: Reduced pesticide inputs on cereal field margins: the effects on butterfly abundance. Ecological Entomology, 15, pp. 17-24. Duellman, W.E. & Trueb, L. 1994: Biology of amphibians. The John Hopkins University Press. Dürr, S., Berger, G., Kretschmer, H. 1999: Effekte acker- und pflanzenbaulicher Bewirtschaftung auf Amphibien und Empfehlungen für die Bewirtschaftung in Amphibien-Reproduktionszentren. RANA Sonderheft 3, pp. 101-116. Ernst, W., Julien, G. & Hennigar, P. 1991: Contamination of ponds by fenitrothion during forest spraying. Bull. Environ. Contam. Toxicol., 46, pp. 815-821. Fairchild, J.F. & La Point, T.W., Schwartz, T.R. 1994: Effects of a herbicide and insecticide mixture in aquatic mesocosms. Arch. Environ. Contam. Toxicol., 27, pp. 527-533. Fargasova, A. 1994: Toxicity determination of plant growth hormones on aquatic alga - Scenedesmus quadricauda. Bull. Environ. Contam. Toxicol., 52, pp. 706-711. Heinis, L.J. & Knuth, M.L. 1992: The mixing, distribution and persistence of esfenvalerate within littoral enclosures. Environmental Toxicology and Chemistry, 11, pp. 11-25. Honrubia, M.P., Herráez, M.P. & Alvarez, R. 1993: The carbamate insecticide ZZ-Aphox® induced structural changes of gills, liver, gall-bladder, heart, and notochord of Rana perezi tadpoles. Archives of Environmental Contamination and Toxicology, 25, pp. 184-191. Isolda, A. & Hayasaka, S.S. 1991: Effect of herbicide residues on microbial processes in pond sediment. Arch. Environ. Toxicol., 20, pp. 81-86. Kadoum, A.M. & Mock, D.E. 1978: Herbicide and insecticide residues in tailwater pits: Water and pit bottom soil from irrigated corn and sorghum fields. J. Agric. Food Chem., 26 (1), pp. 45-50. Klöppel, H., Haider, J. & Kördel, W. 1994: Herbicides in surface runoff: A rainfall simulation study on small plots in the field. Chemosphere, 28 (4), pp. 649-662. Kreuger, J. 1998: Pesticides in stream water within an agricultural catchment in southern Sweden, 1990-96. The Science of the Total Environment, 216, pp. 227-251. Larsen, J. 1997: Effects of cypermethrin, pirimicarb and dimethoate on Tetrahymena. Pesticides Research, 35. Danish Environmental Protection Agency. Larsen, J. & Sørensen, I. 2004: The effect of esfenvalerate and prochloraz on amphibians with special reference to Xenopus laevis and Bombina bombina.. Pesticides Research no.83, Danish Environmental Protection Agency,. Lichtenstein, E.P., Liang, T.T. & Anderegg, B.N. 1973: Synergism of insecticides by herbicides. Science, 181, pp. 847-849. Longley, M., Cilgi, T., Jepson, P.C. & Sotherton, N.W. 1997: Measurements of pesticide spray drift deposition into field boundaries and hedgerows: 1. Summer applications. Environmental Toxicology and Chemistry, 16 (2), pp. 165-172. Longley, M. & Sotherton, N.W. 1997: Measurements of pesticide spray drift deposition into field boundaries and hedgerows: 2. Autumn applications. Environmental Toxicology and Chemistry, 16 (2), pp. 173-178. Lowcock, L.A., Sharbel, T.F., Bonin, J., Ouellet, M., Rodrigue, J. & DesGranges, J. 1997: Flow cytometric assay for in vivo genotoxic effects of pesticides in Green frogs (Rana clamitans). Aquatic Toxicology, 38, pp. 241-255. Marian, M.P., Arul, V. & Pandian, T.J. 1983: Acute and chronic effects of carbaryl on survival, growth, and metamorphosis in the bullfrog (Rana tigrina). Arch. Environm. Contam. Toxicol., 12, pp. 271-275. Marrs, R.H., Williams, C.T., Frost, A.J. & Plant, R.A. 1989: Assessment of the effects of herbicide spray drift on a range of plant species of conservation interest. Environmental Pollution, 59, pp. 71-86. Marrs, R.H., Frost, A.J. & Plant, R.A. 1991: Effects of herbicide spray drift on selected species of nature conservation interest: The effects of plant age and surrounding vegetation structure. Environmental Pollution, 69, pp. 223-235. Marrs, R.H., Frost, A.J., Plant, R.A. & Lunnis, P. 1993: Determination of buffer zones to protect seedlings of non-target plants from the effects of glyphosate spray drift. Agriculture, Ecosystems and Environment, 45, pp. 283-293. Marrs, R.H. & Frost, A.J. 1997: A microcosm approach to the detection of the effects of herbicide spray drift in plant communities. Journal of Environmental Management, 50, pp. 369-388. Marshall, E.J.P. 1987: Herbicide effects on the flora of arable field boundaries. British Crop Protection Conference, Weeds, pp. 291-298. British Crop Protection Council. Maybank, J., Yoshida, K. & Grover, R. 1978: Spray drift from agricultural pesticide applications. Journal of the Air Pollution Control Association, 28 (10), pp. 1009-1014. Mogensen, B.B. & Spliid, N.H. 1997: Forekomst af pesticider i danske miljøprøver. Danmarks Miljøundersøgelser. pp. 1-57. Mogensen, B.B., Stuer-Lauridsen, F., Sørensen, P.B. & Lassen, P. 2004: Fate of pyrethroids in farmland ponds. Part I: Field studies. Pesticides Research no. 86. Danish Environmental Protection Agency. Mossin, J. 1988: Ferrous Iron oxidizing bacteria as a food item for Danish Bombina bombina tadpoles at Knudshoved Odde near Vordingborg. Memoranda Soc. Fauna & Flora Fennica, 64 (3), pp. 116-118. Murphy, S.D., Miller, P.C.H. & Parkin, C.S. 2000: The effect of boom section and nozzle configuration on the risk of spray drift. Journal of Engng Res., 75, pp. 127-137. Nicholaichuk, W. & Grover, R. 1983: Loss of fall applied 2,4-D in spring runoff from a small agricultural watershed. J. Environ. Qual., 12 (3), pp. 412-414. Nielsen, M. & Schouboe, H. 1990: NPK-gødning; en mulig fare for padder under forårsvandring. Specialerapport. Zoologisk Museum & August Krogh Instituttet, ZLA, Københavns Universitet, pp. 1-137. Nordby, A. & Skuterud, R. 1975: The effects of boom height, working pressure and wind speed on spray drift. Weed Research, 14, pp. 385-395. Odderskær, P., Prang, A., Elmegaard, N. & Andersen, P.N. 1997: Skylark reproduction in pesticide treated and untreated fields - comparative tudies of skylark Alauda arvensis breeding performance in sprayed and unsprayed spring barley fields. Pesticides Research no. 32. Danish Environmental Protection Agency., pp. 1-72. Ohkawa, H., Kikuchi, R. & Miyamoto, J. 1980: Bioaccumulation and biodegradation of the (S) acid isomer of fenvalerate (Sumicidin) in aquatic model ecosystems. J. Pestic. Sci., 5, pp. 11-22. Pedersen, C.L. 1999: Effects of the pesticides esfenvalerate and prochloraz on pond ecology. Pesticides Research, no. 50. Danish Environmental Protection Agency. Petersen, P.H., Jensen, P.K., Nielsen, G.C., Jørgensen, L.N. & Friis, K. 1998: Vejledning i planteværn. Danmarks Jordbrugsforskning, Landskontoret for Planteavl. Peterson, H.G., Boutin, C., Freemark, K.E. & Martin, P.A. 1997: Toxicity of hexazinone and diquat to green algae, diatoms, cyanobacteria and duckweed. Aquatic Toxicology, 39, pp. 111-134. Pikulik, M.M. 1985: Zemnovodnye Belorussii. Minsk: Nauka i Technika. pp. 191. Sanders, H.O. 1970: Pesticide toxicities to tadpoles of the western chorus frog Pseudacris triseriata and fowler's toad Bufo woodhouseii fowleri. Copeia, 2, pp. 246-251. Schneeweiss, N. & Schneeweiss, U. 1997: Amphibienverluste infolge mineralischer Düngung auf Agrarflächen. Salamandra, 33 (1), pp. 1-8. Semlitsch, R.D., Scott, D.E. & Pechmann, J.H.K. 1988: Time and size at metamorphosis related to adult fitness in Ambystoma talpoideum. Ecology, 69 (1), pp. 184-192. Smith, T.M. & Stratton, G.W. 1986: Effects of synthetic pyrethroide insecticides on nontarget organisms. Residue Reviews, 97, pp. 93-120. Spliid, N.H. & Køppen, B. 1998: Occurrence of pesticides in Danish shallow ground water. Chemosphere, 37 (7), pp. 1307-1316. Spliid, N.H. 2001: Udvaskning af pesticider fra marker med kendt sprøjtepraksis. Jordbrugsforskning, 2, pp. 6. Thurman, E.M., Goolsby, D.A., Meyer, M.T., Mills, M.S., Pomes, M.L. & Kolpin, D.W. 1992: A reconnaissance study of herbicides and their metabolites in surface water of the Midwestern United States using immunoassay and gas chromatography/mass spectrometry. Environ. Sci. Technol., 26, pp. 2440-2447. Traunsburger, W., Schäfer, H. & Remde, A. 1996: Comparative investigation on the effect of a herbicide on aquatic organisms in single species tests and aquatic microcosms. Chemosphere, 33 (6), pp. 1129-1141. Turner, F.B. 1960: Population structure and dynamics of the Western Spotted Frog, Rana pretiosa Baird & Girard, in Yellow Stone Park, Wyoming. Ecological Monographs, 30, pp. 251-278. Wauchope, R.D. 1978: The pesticide content of surface water draining from agricultural fields - a review. Journal of Environmental Quality, 7 (4), pp. 459-472. Wiberg-Larsen, P. & Pedersen, S.E. 1997: De fynske vandløb. Vandmiljøovervågning, Fyns Amt, pp. 210. Zar, J.H. 1984: Biostatistical analysis. Prentice Hall, Inc., Eaglewood Cliffs, New Jersey. 9 Abbreviations2,4–D 2,4-dichlorophenoxyacetic acid: herbicide. ANOVA Analysis of Variance: statistical test. BAM 2,6-dichlorbenzamid: breakdown product of the herbicide dichlobenil. DDT dichlorodiphenyltrichloroethane: persistent insecticide. DEPA Danish Environmental Protection Agency. DNA Deoxyribonucleic acid: carrier of genetic information in all living cells. DT50 Degradation Time 50: time during which 50 % of a compound has been degraded. DTI Danmarks Teknologiske Institut: Danish Technological Institute. EC50 Effective Concentration 50: that concentration which causes an effect on 50 % of a test population. FQI Food Quality Index: abundance and quality of suitable food for Bombina bombina tadpoles. ha Hectare. H2S Hydrogen sulphide: colourless and very poisonous gas produced by decaying organic matter. LC50 Lethal Concentration 50: that concentration which is lethal to 50 % of a test population. LOEC Lowest Observed Effective Concentration. MCPA 2-methyl-4chlorophenoxyacetic acid: herbicide. MLK Miljø- og Levnedsmiddelkontrollen: Environment and Food Agency. n.s. Non significant. rs Spearman rank correlation coefficient: nonparametric statistic. Appendix ATable A.1: Brug af pesticider på mark(er) omkring vandhullerne. Upræcise datoer er markeret med (*). Hvor to marker omgav et vandhul er markerne angivet med romertal.
Table A.2 Tilførsel af gødning til marker omkring vandhullerne. Ukendt gødningsmængde er markeret med (?). Hvor to marker omgiver et vandhul, er markerne angivet med romer tal.
Grey cells indicates that the pond was not included in the investigation in 1993. Table A.3 Pesticidkoncentrationer i vandhuller (ng/l) Table A.4: Vegetationsdække i vandhuller (%). Click here to see the Table.Table A.5 Årlig overlevelse af klokkefrøer ældre end 1 år på danske lokaliteter og dyrkningsgrad af habitaten. Vandhuller, moser, enge, overdrev, hegn og skov er udyrkede arealer, mens landbrugsarealer er dyrkede arealer. Overlevelsesestimater er udregnet som gennemsnit over flere år.
Table A.6 Prædatorer i bure under klækningseksperiment. Antal prædatorer er markeret ved: - ingen, + 1, ++ 2-5.
*A leach was observed swallowing a small tadpole. Grey cells indicate that the pond was not included in the investigation in 1993. Table A.7 Prædatorer i bure under haletudse eksperiment. Antal Dystiscidae og Odonata er markeret ved: - ingen, + 1, ++ 2-10. Antal Hirudinea er markeret ved: - ingen, + 1-10, ++ 11-20, +++ 21-50, ++++ >50.
Grey cells indicate that the pond was not included in the investigation in 1993. Table A.8 Epifytiske belægninger af alger, bakterier og protozoer i vandhuller i 1994.
* ** *** Grey cells indicate uncompleted registration of algae. Table A.9 Vandtemperaturer i 20 cm's dybde. Gennemsnitsværdier er baseret på data i grå felter. Click here to see the Table.
|
|||||||||||||||||||||||||||||||||||||||||||||||||||||||||||||||||||||||||||||||||||||||||||||||||||||||||||||||||||||||||||||||||||||||||||||||||||||||||||||||||||||||||||||||||||||||||||||||||||||||||||||||||||||||||||||||||||||||||||||||||||||||||||||||||||||||||||||||||||||||||||||||||||||||||||||||||||||||||||||||||||||||||||||||||||||||||||||||||||||||||||||||||||||||||||||||||||||||||||||||||||||||||||||||||||||||||||||||||||||||||||||||||||||||||||||||||||||||||||||||||||||||||||||||||||||||||||||||||||||||||||||||||||||||||||||||||||||||||||||||||||||||||||||||||||||||||||||||||||||||||||||||||||||||||||||||||||||||||||||||||||||||||||||||||||||||||||||||||||||||||||||||||||||||||||||||||||||||||||||||||||||||||||||||||||||||||||||||||||||||||||||||||||||||||||||||||||||||||||||||||||||||||||||||||||||||||||||||||||||||||||||||||||||||||||||||||||||||||||||||||||||||||||||||||||||||||||||||||||||||||||||||||||||||||||||||||||||||||||||||||||||||||||||||||||||||||||||||||||||||