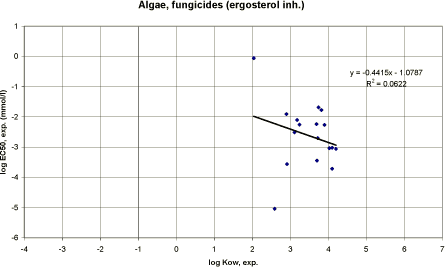
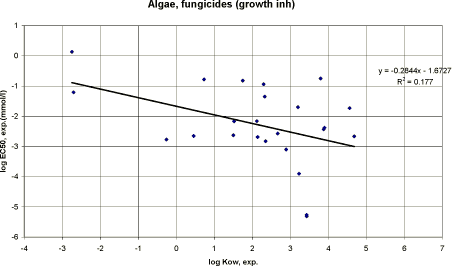
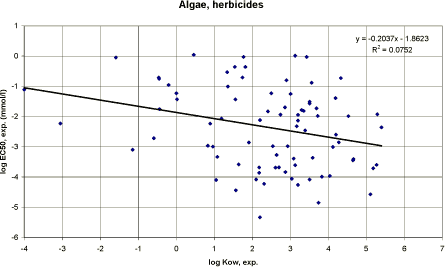
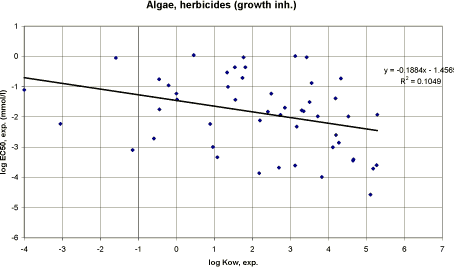
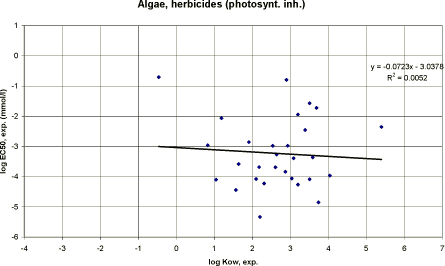
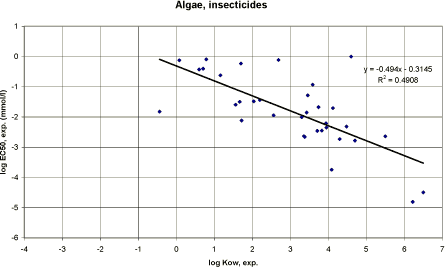
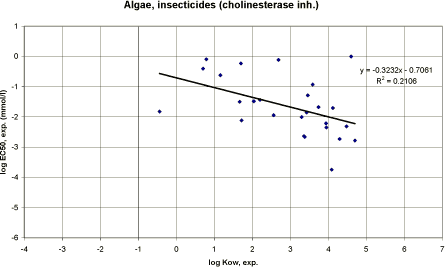
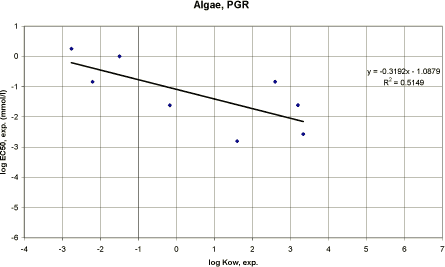
|
Quantitative Structure-Activity Relationships (QSAR) and Pesticides 3 Pesticides3.1 Modes of action Pesticides are chemicals that are especially chosen for their ability to affect “unwanted organisms” whether it may be animals, plants, fungi or microorganisms without affecting non-target organisms. Thus, pesticides are biological active substances or preparations containing one or more substances with a broad range of biocidal activity and often with a specific mode of action. 3.1 Modes of actionIt has been observed that chemicals of analogous structures have similar modes of action on the target organism. Dividing such chemicals into chemical classes therefore means that predictions of the mode of action are possible. Pesticides may act by contact or systemic mode of action. A contact action means that the pesticide by contact with the target organisms affects the surface or penetrates the surface to reach the target site. A systemic mode of action means that a pesticide is taken up by an organism and then acts after the uptake (e.g. insecticides taken up by eating or sucking insects from the plants the insecticide has entered). Below some of the major chemical classes used in pesticides are presented. Aryloxyalkanoic acids Aryloxyalkanoic acids (phenoxy acids) are selective systemic hormone type herbicides that are absorbed by the leaves and roots and translocated throughout the plant but concentrates in the meristematic regions where it inhibits growth. Azoles Azoles are fungicides acting as steroid demethylation inhibitor. Carbamates Carbamates may be herbicides or insecticides. As herbicides, carbamates are systemic herbicides, which are absorbed by the roots, leaves and stem, and translocated to active growth sites (meristems) where it inhibits elongation of roots and aerial parts. Some carbamates are insecticides with contact and stomach action and act as cholinesterase inhibitor. Dinitroanilines Dinitroanilines are selective soil herbicides, which are absorbed by the roots. Dinitroanilines affect seed germination and prevent plant growth by inhibition of root and shoot development. Organophosphorous Organophosphorous substances are usually insecticides with contact and stomach action and act as cholinesterase inhibitor affecting the nervous system. Organophosphorous herbicides do exist as selective herbicides, which are absorbed through the roots. Pyrethroids Pyrethroids are usually non-systemic insecticides with contact action. They cause paralysis initially (“knock-down effect”) and may lead to death later. Usually, they are non-phytotoxic. Sulfonylureas Sulfonylureas are selective systemic herbicides, which are absorbed by the leaves and roots and translocated throughout the plant. Sulfonylureas inhibit the acetolactate synthesis. Plant growth is inhibited followed by the development of chlorotic patches, which spread acropetally and then basipetally. Triazines Triazines are selective systemic herbicides, which are absorbed by the leaves and roots and then translocated acropetally in the xylem to accumulate in apical meristems. Triazines inhibit photosynthesis and interfere with other enzymatic processes. Triazoles Triazoles are non-selective systemic herbicides, which are absorbed by the leaves and roots and then translocated in both the phloem and the xylem. Triazoles inhibit the chlorophyll formation and re-growth from buds. Ureas Ureas are selective herbicides, which are absorbed by the roots and leaves. They inhibit photosynthesis. 3.2 QSAR and pesticidesMost QSARs are based on simple chemical structures and the use on more complex organic molecules which is often the case with pesticides, should be performed with this in mind. However, some studies have been using the QSAR models on pesticides. Generally, most aspects of pesticides are very well documented compared with other chemicals and this should improve the input data quality. However, data on metabolites and degradation products are usually missing and validated QSAR models may present estimates on whether a metabolite or degradation product should be considered for more study or not. Evaluation of the validity of the latest accepted QSARs is performed by comparing experimental values and the QSAR model estimates using specified models. The experimental values are based on information from the manufacturers (Tomlin 1994, 1997, Linders et al. (1994) or letters of approval of plant protection preparations from the Danish-EPA) and a Danish-EPA database (Clausen 1998). It means that data on ecotoxicological effects are based on evaluated and accepted studies. The QSAR estimations on physico-chemical proportions are performed by programmes developed by Syracuse Research Corporation: MPBPVP, WSKOW, KOWWIN, HENRY, and PCKOCWIN. The programmes are stand-alone programmes but can be run together using the Estimation Programs Interface (EPIWIN) as an interface. The programmes require that the molecular structure be presented as a SMILES notation, cf. 3.2.1. Fortunately, the programme includes a database where, by using CAS number, the programme itself presents the SMILES notation. If no SMILES notation exists it can relatively easy be performed. The QSAR estimations on toxicity to aquatic organisms are performed by QSARs recommended in the EU technical guidance document (TGD 1996). 3.2.1 SMILES notationSimplified Molecular Input Line Entry System (SMILES) is a simple chemical notation system to identify the molecule from its structure by a linear string of symbols. The system has been designed so that a computer can use it. The chemical structure is described from basal symbols and a few rules:
For a more comprehensive introduction to SMILES see to Weininger (1988). Writing SMILES notation is relatively easy since a SMILES notation depicts a molecular structure as a two-dimensional picture. A single structure can be depicted correctly from different SMILES. This means that there may be more than one correct SMILES notation result if the rules are followed. More complicated structures, such as some pesticides, may be difficult and time consuming to construct. A few examples have been presented for illustration (table 1). Table 1 Eksempler på SMILES notation.
3.3 Physico-chemical properties3.3.1 Boiling pointThe boiling point is defined as the temperature at which the vapour pressure of a liquid is equal to the pressure of the atmosphere on the liquid. For pure compounds, the normal boiling point is defined as the boiling point at one standard atmosphere of pressure on the liquid. Besides being an indicator for the physical state (liquid vs. gas) of a chemical, the boiling point also provides an indication of the volatility. The boiling point is estimated by using the Stein and Brown (1994) method of group contributions that calculates boiling point (BP) of a compound by adding group increment values according to the relationship:
Where gi is a group increment value and ni is the number of times the group occurs in the compound. The resulting BP is then corrected by one of the following equations:
The Stein and Brown method was derived from a training set of 4426 organic compounds. Other methods Other methods are described in Lyman et al. (1982) but are either not validated or are using a reduced number of chemicals. Pesticides Boiling points for pesticides are usually not available. The available experimental values are either based on studies performed at non-comparable pressures or the substance decomposed before a boiling point was reached. Apparently, most pesticides are estimated to have boiling points in the vicinity of 400°C according to the Stein and Brown method. The average estimated boiling point and standard deviation was 406±102°C. Results of the estimations are presented in the appendix. Conclusion The validity of the estimations could not be evaluated due to the lack of experimental data on pesticide boiling points. Besides the Stein and Brown method, no other estimation method exists that has been validated so extensively or accurately for diverse structures. 3.3.2 Melting pointThe melting point is defined as the temperature at which crystals are in equilibrium with the liquid phase at atmospheric pressure. The melting point is an important parameter since it affects the solubility. Solubility controls toxicity by affecting the bioavailability of the substance and the possibility of being transported to the active site within an organism. Primarily intermolecular forces and molecular symmetry holding the molecules in a crystal lattice control the melting point of a compound. The melting point is determined by the strength of the crystal lattice since melting point is a measure of the energy required to disrupt the crystal lattice. In the same way, the solubility can be regarded as a partitioning of the substance between its crystal lattice and the solvent. The melting point tends to increase with molecular size simply because the molecular surface area available for contact with other molecules increases (Dearden 1991). Meylan and Howard (1994) estimated the melting point by two different methods. The first is an adaptation of the Joback group contribution method for melting point and the second is a simple Gold and Ogle method suggested by Lyman (1985). The Joback adaptation is an extension of the original method to include the same groups as in the adapted Stein and Brown boiling point method. The Joback method overestimates MP for some structures. The Gold and Ogle method simply relates melting point (MP) to boiling point (BP) as follows:
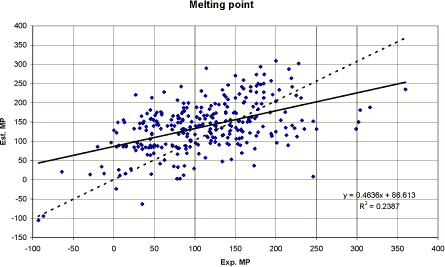
The computer programme MPBPVP by Meylan and Howard (1994) performs minor evaluations. If the values are close to the model averages, the two estimates are averaged, if not, the programme performs and decides which estimate is more likely to be accurate and presents a “suggested” melting point. Although, the suggested MPBPVP estimates are usually adequate for screening purposes the overall accuracy is not outstanding. The accuracy of the “suggested” value was tested on a 666 compound data set containing a diverse mix of simple, moderately complex compounds and many pesticides and pharmaceutical compounds. MPBPVP estimates yielded a correlation coefficient (r²) of 0.73. However, even if the estimated melting points can only be used for screening purposes, it seems to be the best method currently available (Meylan and Howard 1994). Pesticides Usually, the melting point of pesticides is known. Comparing the experimental melting points of the pesticides including salts and esters used in this study with the MPBPVP suggested melting points performed the correlation presented in figure 1.
Figure 1 Eksperimentelle overfor estimerede smeltepunkter i °C. Den stiplede linie repræsenterer ideal korrelation, dvs. skæringspunktet er sat til 0 og hældningen til 1. Den ubrudte linie repræsenterer lineær korrelation. In figure 1, the dotted trend line is placed with the intercept 0 and the slope 1, which represents the ideal situation of a perfect match. The position of the dotted line relative to the marking demonstrates that most estimated values are apparently overestimated for the low experimental values and underestimated for the higher experimental values. The meanSD value for experimental and estimated melting points was 112±69 and 140±69°C, respectively. The correlation between the experimental values from 297 melting points and estimated values indicates that the estimations are inaccurate, as can be seen from the correlation coefficient (r² =0.24) presented in the figure. Conclusion The correlation between experimental and estimated melting points was low. The method generally overestimated the melting point values for substances with an experimental melting point up to 100°C. Furthermore it underestimated melting point values for substances with an experimental melting point above 250°C. Thus, the currently best available method by Meylan and Howard (1994) cannot be used to estimate the melting point of pesticides with a sufficient accuracy in its present form. 3.3.3 Solubility in waterThe water solubility reflects the maximum amount of a chemical that will dissolve in pure water at a given temperature. The water solubility is one of the most important physico-chemical properties in ecological hazard assessment and exposure assessment, including environmental fate. The spatial and temporal movement (mobility) of a substance within and between the environmental compartments of soil, water and air depends largely on its solubility in water. The knowledge of the solubility in water is essential when estimating biological degradation, bioaccumulation, hydrolysis, adsorption and the partition coefficient octanol/water. Highly water-soluble chemicals are potentially easier distributed by the hydrologic cycle, as they tend to have relatively low adsorption coefficients (i.e. low adsorption to soil and sediment). As the term “insoluble” is sometimes seen in handbooks it must be emphasised that no organic chemical is completely insoluble in water. All organic chemicals are soluble to some extent. The range observed in pesticides is usually between µg/l to g/l. In a few instances, it may be even lower and some are infinitely soluble, i.e. total miscible with water. Several approaches to estimate the water solubility have been developed (Lyman et al. 1982, Yalkowky and Banerjee 1992). Yalkowsky and Banerjee (1992) have reviewed most of the recent literature where a variety of estimation methods are available. The methods involve the application of group activity coefficients, partition coefficients, chromatographic parameters, boiling point, molecular volume, molecular surface area, molecular connectivity, parachor, solubility parameters, UNIFAC, linear solvation energy and multivariate statistical methods. After critical evaluation of the available methods in terms of range of applicability, accuracy, ease of use and strength of underlying theory, Yalkowsky and Banerjee (1992) concluded that only two methods could be considered for universal application:
Group activity coefficient method The group activity coefficient method is demonstrated with the group contribution approach of Wakita et al. (1986) that derived the following equations for:
Where Σfi is the summation of all applicable fragment values. The fragment values are derived from experiments starting with small molecules and increasing the molecular structure with known atoms or functional groups and calculate the contribution from each change in the molecular structure. The Wakita method was fairly accurate for its training set, which primarily consisted of hydrocarbons and simple monofunctional compounds. When applied to a test set of pesticides and drugs, the accuracy was reduced: standard deviation (S.D.) = 1.05 (Yalkowsky and Banerjee 1992). Correlations using log Kow At present, the most practical method to estimate water solubility involves regression derived correlations using log Kow. Most of the highly water-soluble substances show low log Kow values. Several correlations have been developed depending on the applied chemicals used in the calculations. Eighteen different regression equations that correlate water solubility to log Kow have been found in the literature (Lyman et al. 1982, Isnard & Lambert 1989). Only the two equations, which include pesticides, are shown below: Lyman et al. 1982
Some equations include the melting point (MP) for solids. For liquids, the MP is set to 25°C which zeroes out the melting point parameter. Isnard and Lambert (1989) performed a correlation on 300 substances (166 liquids and 134 solids) including some pesticides and obtained following correlations where log S is the logarithm to the water solubility and MP is the melting point: Isnard and Lambert 1989
The two latter equations were recommended for liquids and solids in OECD (1993b). The equations can be changed to give the result in mol/l: log S (mol/l) = 1.17 - 1.38 log Kow log S (mol/l) = 1.0 - 1.26 log Kow - 0.0054 (MP -25) Meylan and Howard (1994) have developed a QSAR model on water solubility where the water solubility in mol/l is estimated based on log Kow with and without a melting point. The first equation was developed based on a validation set of 85 substances with an experimental log Kow and water solubility values but with no available melting point. The second validation set included 817 compounds with measured water solubility and melting points. The Meylan and Howard equations are shown below: Meylan and Howard 1994
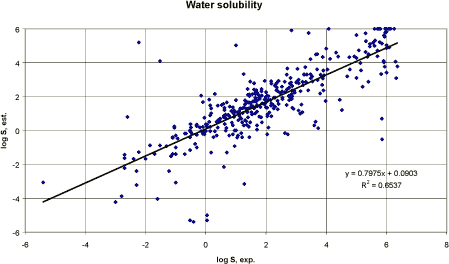
Where MW is the molecular weight, MP is the melting point and “cf” the correction factor. Knowledge of the melting point reduces the standard deviation and improves the correlation coefficient and this model should be used when a measured melting point is available. The melting point is only used for solids. The correction factor is applied to 15 structure types (e.g. alcohols, acids, selected phenols, amines, amino acids, etc). The calculations of the Meylan and Howard QSAR model can be performed on computer (WS-KOW, Syracuse, Meylan and Howard 1995). Pesticides Performing a correlation between the experimental water solubility from 377 pesticides and the result of Meylan and Howard computerised version (WSKOW) is presented in figure 2 using log values. The logarithmic values (log10) are used to reduce the range and to make the values comparable. For a perfect match, the intercept should be 0 and the slope 1. If the estimated values were overestimated the values should be above the trend line with a slope of 1 and intercept 0. Such a trend line would be close to the linear regression line presented in figure 2 that had a slope of 0.8. Performing regression between the experimental water solubility values and the values estimated using the computerised WSKOW model with melting point resulted in a correlation coefficient r² of 0.65. It is a poorer result than found by the training set used by Meylan and Howard (1994) but considering the wide diversity of the included pesticides the result cannot be considered unacceptable for a first estimate.
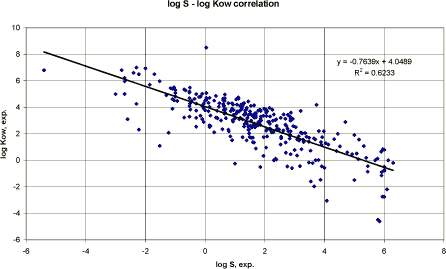
Figure 2 Korrelation mellem logaritmen til eksperimentel vandopløselighed og logaritmen til estimeret vandopløselighed. Based on the measured water solubility and log Kow values from 322 pesticides, a linear regression analysis was performed. Figure 3 presents the result graphically.
Figure 3 Korrelation mellem logaritmen til målt vandopløselighed og log Kow. The resulting correlations using mg/l (figure 3) or recalculating the solubility data to mmol/l were:
The result of the correlation seems relatively poor and no improvement was obtained by including the molecular weight. However, considering the variation in chemical classes etc. the result is not unacceptable. It should also be considered that the experimental data are based on temperatures varying from 20 to 25°C whereas the estimated water solubility are estimated at 25°C. Figure 3 also demonstrates the negative correlation between water solubility and octanol/water partition coefficient (lipophilicity). Conclusion The estimations of water solubility was reasonable acceptable using the selected computerised QSAR model although the correlation coefficient for pesticides was smaller than for the data used to develop the model. A linear regression analysis based on log water solubility and log Kow of the pesticides used in this report resulted in a QSAR model with an almost identical correlation coefficient. Thus, both methods may be used with the same degree of uncertainty. 3.3.4 Vapour pressureThe vapour pressure is defined as the pressure at which a solid is in equilibrium with its own vapour. The vapour pressure is a chemical specific property, which is important in evaluating the behaviour and fate of a pesticide in the environment. Especially, when evaluating the distribution into the environmental compartments soil, air and water and its persistence in the compartments. Experimental or estimated vapour pressures given in mmHg or atm. are recalculated to Pa in this report. Numerous equations and correlations for estimating vapour pressure are presented in the literature. They normally require information on:
The vapour pressure is estimated by three methods:
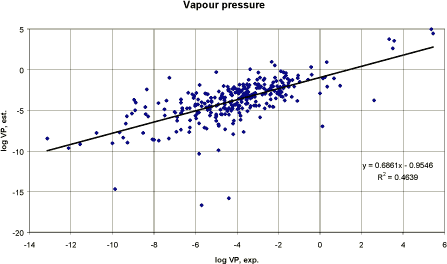
All three methods use the normal boiling point to estimate the vapour pressure. The Antoine method The Antoine method was developed for liquids and gases. The method is described in detail in Lyman et al. (1990). The general equation is: ln VP = [(ΔHvb (BP-C2)²) / (ΔZb R BP²)] * [1/(BP-C2) - 1/(T-C2)] Where ΔHvb is the heat of vaporisation at the boiling point (cal/mol) The modified Grain method The modified Grain method is described in Lyman (1985). The method is a modification of the modified Watson method. It is applicable for solids, liquids and gasses. The method converts super-cooled liquid vapour pressure to a solid phase vapour pressure. It is probably the best all round VP estimation currently available (Meylan and Howard 1994) and is used by US-EPA in the PC-CHEM programme. Mackay method Mackay derived the following equation to estimate the vapour pressure: ln VP = - (4.4 + ln BP)[1.803(BP/T-1) - 0.803 ln (BP/T)] - 6.8 (MP/T-1) The equation includes the boiling point (BP), the melting point (MP) and the temperature (T) in °K. The melting point is ignored for liquids. Since the boiling point was usually unknown to pesticides, the method was not applicable. MPBPVP The computer estimations made by MPBPVP (Meylan and Howard 1994) report all three methods and a “suggested” value. For solids, the suggested vapour pressure is the modified Grain estimate. For liquids and gasses, the average of the Antoine and the modified Grain method is suggested. The Mackay method is not used, as it is limited to its derivation classes: hydrocarbons and halogenated compounds (both aliphatic and aromatic). Using a data set of 805 compounds, a correlation coefficient (r²) of 0.941 and a standard deviation, S.D., of 0.717 were observed. Pesticides For the pesticides, a linear regression analysis has been performed using log transformation due to the large variation in the experimental vapour pressure values. The result is presented graphically in figure 4. The experimental vapour pressure values and values estimated by the model MPBPVP and presented as suggested values (Meylan and Howard 1994) were not well correlated for pesticides. The correlation coefficient r² was 0.46 for n = 308. The deviations seem to increase at decreasing vapour pressures. The reason for the low correlation coefficient may be the relatively few outliers. However, removing the outliers did not significantly improve the result.
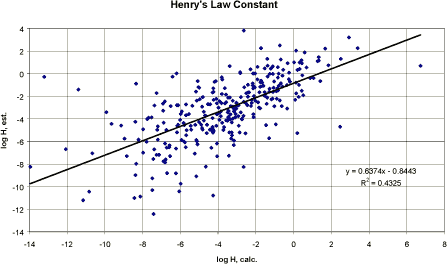
Figure 4 Korrelation mellem eksperimentelt rapporteret damptryk og model-estimeret damptryk (begge logaritmiske). Conclusion Generally, the presented QSAR model was not able to perform a sufficient close correlation of experimental and estimated vapour pressures from the included pesticide data set. However, the main part of the substances is relatively well correlated and the estimation method may be considered sufficient for a first estimate. 3.3.5 Henry's Law constantHenry's constant is the ratio of chemical concentration in air to the concentration in water, when those two phases are in contact and are at equilibrium. The partitioning between water and air is a physical property that is described by the Henry's Law constant, H. The magnitude of H provides an indication of which of the two phases a chemical will tend to partition into at equilibrium. Henry's Law constant can be estimated from: H = Vapour pressure x Molecular weight / Water solubility [Pa m³/mol] H can also be expressed as the ratio of the concentration in air and water, called the “dimensionless” H, H', where: H' = concentration in air / concentration in water, i.e. Where kair-water is the air-water partition coefficient. QSAR models QSAR estimations of H are based on a combination of connectivity indices and calculated polarisability (Nirmalakhandan and Speece 1988). A narrow range of chemical types was used to develop the method, which is not widely applicable. QSARs based on group and bond contributions are developed from experimentally measured log Kair-water values, when available. The methods of Hine and Mokerjee (1975) have been further developed and are now available in PC programme (HENRY in EPIWIN, Meylan and Howard 1992). Compounds with large structures, which include many different types of bonds and groups, may have significant inaccuracies in their estimations. Pesticides For the pesticides in this project, no measured Henry's Law constants were available. It was decided to compare the computerised estimation with the calculated H values using: H = VP (Pa) * MW (g/mol) / S (mg/l) [Pa m³/mol] This is the preferred estimation method when reliable measured data on vapour pressure and water solubility are available (Meylan and Howard 1991). In the PC-model, the group estimation methods were usually presenting the message “incomplete” in the estimation programme and therefore the bond contribution method was applied in the estimations (Meylan and Howard 1991). The regression analysis between the calculated H and the H estimated by bond contribution method is shown graphically in Figure 6 and resulted in a correlation coefficient r² of 0.43 (n= 308). The results of the bond contribution method are relatively underestimated compared with the calculated values.
Figure 5 Korrelation mellem Henrys Lov konstant beregnet og estimeret ud fra strukturanalysen i HENRY Pc-modellen (Meylan and Howard 1992). No conclusion can be drawn from the used pesticide data set since values estimated by calculation and by computer model are not necessarily correct for the pesticide in question. It can be concluded that the two estimation methods are presenting comparable results with estimated H being slightly above calculated H below log H -2 and slightly above the calculated H above log H -2. 3.3.6 Octanol/water partition coefficient (Kow)Hydrophobicity is one of the key parameters in QSARs for environmental endpoints. The property is usually modelled by the n-octanol/water partition coefficient (Kow) which is an established laboratory method to measure the hydrophobicity of a chemical. As such, Kow or log Kow is a key parameter in the assessment of environmental fate and the bioaccumulation potential. Kow has been found to be a good predictor for relatively non-specific processes. For instance, many distribution processes are found to be related to Kow, e.g. sorption to soil and sediment, partitioning into air and bioconcentration, and non-specific toxicity. This especially relates to non-polar organic chemicals. When more polar chemicals and more specific processes such as degradation, biodegradation and specific toxic interactions are the subject, other kinds of interactions (stereo-electronic) become more relevant (EEC report 1995). The octanol/water partition coefficient is the ratio of a chemical's concentration in the octanol phase to its concentration in the aqueous phase of a two-phase system at equilibrium. Thus, the two-phase system consists of octanol as the non-polar solvent and water as the polar solvent. Since measured values range from below 10-4 to more than 108, the logarithm (log Kow) is normally used to characterise its value. The literature contains several methods for estimating log Kow. The most common method for the estimation of Kow is based on fragment constants. The fragmental approach is based on simple addition of the lipophilicity of the individual molecular fragments of a given molecule, i.e. atoms or larger functional groups. The most widely used fragment constant method was proposed by Hansch and Leo (1979) and initially computerised for use by Chou and Jurs in the CLOGP programme (Daylight Chemical Information Systems, New Orleans). The fragment constant method consists of determining the log Kow values of a set of small molecules very accurately and then calculating “fundamental” chemical fragments from these values. The method uses single atom “fundamental” fragments consisting of isolated carbons or a hydrogen or hetero-atom plus multiple atom fundamental fragments, e.g.-CN, and a large number of correction factors. Other methods have been developed but have, at present, not proven to be acceptable as a general estimation method (Meylan and Howard (1995). Meylan and Howard (1995) have evaluated 10 different methods and concluded that CLOGP and the AFC methods (cf. below) are the best comprehensive predictors currently available. A major problem with most fragment constant approaches is their inability to estimate log Kow for a structure containing a fragment that has not been correlated. Meylan and Howard (1995) have developed a new fragment constant approach, the atom/fragment contribution (AFC) method which was developed by multiple linear regressions of reliable experimental log Kow values. The regressions were performed in two stages: The first regression correlated atom/fragment values with log Kow and the second correlated correction factors. The log Kow is then estimated by summing up the values from a structure. In general, each non-hydrogen atom, e.g. carbon, nitrogen, oxygen, sulphur, in a structure is a core for a fragment and the exact fragment is determined by what is connected to the atom. The result of the atom and/or fragment regression was:
Where (Σfini) is the summation of fi (the coefficient for each atom or fragment) times ni (the number of times the atom/fragment occurs in the structure). The general equation for estimating log Kow of any organic compound is
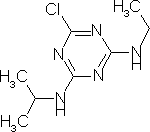
Where (Σcjnj) is the summation of cj (the coefficient for each correction factor) times nj (the number of times the correction factor occurs or is applied in the structure). Examples Three calculation examples using pesticides are presented Simazine Simazine is a herbicide belonging to the triazines and has the molecular structure presented below:
Table 2 Simazin, strukturfragmentanalyse anvendt til beregning af log Kow.
Simazine has an experimental log Kow of 2.18. Based on structure fragment analysis the log Kow was estimated to be 2.40. Thiodicarb Thiodicarb is an insecticide belonging to the oxime carbamates and has the molecular structure:
Table 3 Thiodicarb, strukturfragmentanalyse anvendt til beregning af log Kow.
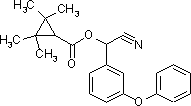
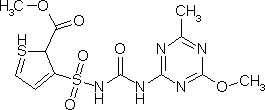
Thiodicarb has an experimental log Kow of 1.70. Based on structure fragment analysis the log Kow was estimated to be 1.91. Thifensulfuron-methyl Thifensulfuron-methyl is a herbicide belonging to the sulfonylureas. It has the molecular structure shown below.
Table 4 Thifensulfuron-methyl, strukturfragmentanalyse anvendt til beregning af log Kow.
Thifensulfuron-methyl has an experimental Kow of 1.6 at pH 5 and a Kow of 0.02 at pH 7. The deviation demonstrates that the method results are “ion-corrected” for compounds that have log Kow values that vary with pH. The log Kow correction for ionisation is calculated as:
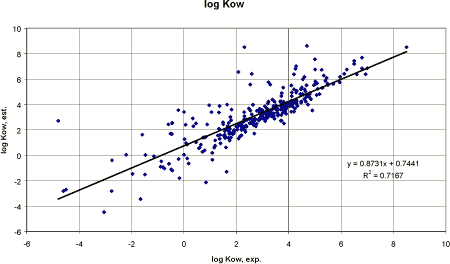
Thifensulfuron-methyl has a pKa value of 4.0. This would result in a corrected Kow at pH 7 = log (0.02) + log (1+107 - 4) = log 1.3. Pesticides Performing a correlation between 327 pesticides, an overestimation seems to be the case for pesticides of low experimental Kow values. In figure 6, the trend line with the intercept 0 and the slope 1 would be almost identical to the linear regression line that had the slope 0.87. Thus, the correlation is close to represent the ideal correlation. A linear regression analysis between the experimental log Kow and the estimated log Kow gave a correlation coefficient r² of 0.72 (n = 327) (figure 6) which is sufficient close for predictive purposes.
Figure 6 Korrelationsanalyse mellem den eksperimentelle log Kow og den estimererede log Kow. Some derivation may arise from imprecise or incorrect log Kow's or from “ionised” substances (cf. the thifensulfuron-methyl example above). However, the results are accurate enough to be used for the estimation on related chemical compounds, e.g. pesticide degradation and/or transformation products. Concerning the pesticide active substance itself, there should always be an evaluated measured value present and the value should consider different pH if the substance is depending on pH (Ribo 1988). This is especially important since the log Kow is an essential part of most predicting methods on adsorption, toxicity etc. Very often several log Kow values may be found even as experimental data obtained from laboratory methods performed according to accepted guidelines (reverse phase HPLC, “shake-flask”, “slow stirring method” etc). In such cases, QSAR models may be used in evaluating which value to decide on. The method is, however, not recommendable for manual calculations since 130 fragments and 235 correction factors are included. The PC versions of the methods AFC or CLOGP are recommended instead. Log Kow estimated from water solubility Based on the selected pesticides in this report, a QSAR for manual calculation of an estimated log Kow based on water solubility can be suggested.
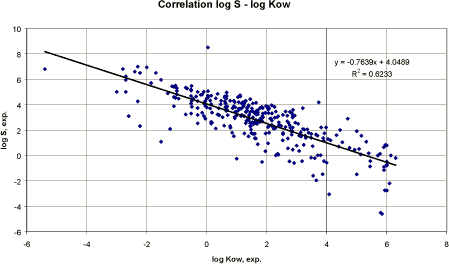
Figure 7 Korrelation mellem eksperimentel vandopløselighed (mg/l) og log Kow. Performing linear regression between the measured water solubility either as mg/l or mmol/l and log Kow resulted in the equations:
The correlation coefficient was 0.62 which is reasonable acceptable for predictive purposes. Conclusion The octanol/water partition coefficient log Kow could be reasonably well estimated from the QSAR models based on structure fragment analysis. The method is complicated and recommended to be performed by available computer models. However, an alternative QSAR model may be used based on water solubility. For the pesticides used in this report, it resulted in a lower correlation coefficient but if the computerised model is not available the method should be sufficient in a screening procedure. 3.3.7 SorptionThe sorption (adsorption/desorption) to soil and sediments is a determining factor for the mobility of chemicals. This property also contributes to the distribution among soil, sediment and water phases, volatilisation from soil surfaces, and bioavailability. The extent of soil and sediment sorption is governed by a variety of physico-chemical properties of both the soil/sediment and the chemical, e.g. organic carbon content, clay content, humidity, pH value, cation exchange capacity, temperature, etc. The sorption of non-polar substances may be regarded as a distribution process between the polar phase of the soil water and the organic phase of the soil component. The equilibrium constant of this partitioning between solid and solution phase constitutes the adsorption coefficient for soil and sediments. The sorption coefficient is defined, at steady state, as: Kd = Concentration of chemical sorbed to soil / Mean concentration in aqueous solution. As the organic fraction is the principal interaction site for hydrophobic compounds, a partition coefficient normalised for the content of organic carbon (OC) is used to reduce the variance of sorption coefficients: Koc = (Kd/OC%) 100 The remaining variation may be due to other characteristics of soils (clay content, clay composition, surface area, cation exchange capacity, pH, etc.), the nature of the organic matter present and/or variation in the test methods. Numerous studies of the correlation of adsorption coefficient with these variables found that the organic carbon content usually gave the most significant correlations (Stevenson 1976). Soil adsorption coefficients may be reported on a soil-organic matter basis (Kom). Since the organic carbon content of a soil can be measured more directly, reporting values as Koc are preferred. The ratio of organic matter to organic carbon varies from soil to soil but a value of 1.724 is often assumed when conversion is necessary, i.e. Koc =1.724 Kom (Lyman et al. 1990) based on an organic carbon content of 58% in organic matter. Since Koc is accepted as essential in the evaluation of pesticides, many different procedures for estimating Koc have been developed. One general method correlates Koc with Rf-values obtained from soil thin-layer chromatography tests. Various authors have shown a reasonable good correlation between these properties but gave no regression equation (Briggs 1973, Hance 1967, Lambert 1968) or required an additional parameter (pore fraction of the soil (Hamaker 1975)). Briggs (1969) described a correlation between Koc and the Hammet and Taft energy constants for phenylureas but without presenting a regression equation. Other factors affect the measured value of Koc under actual environmental conditions besides the differences in laboratory procedures (Lyman 1990):
Temperature Temperature may affect the measured values since adsorption is an exothermic process. Values of Koc usually decrease with increasing temperature. pH of soil and water Chemicals that tend to ionise are much affected by pH. Weak acids and weak bases show the greatest sensitivity to pH changes in the range normally met in soil and surface waters (pH 5 to pH 9). Particle size distribution and surface area of solids The fine silt and clay fraction of soil and sediments may have a great tendency to absorb chemicals. The different clay fractions have different adsorptive capacities. Non-equilibrium adsorption Non-equilibrium adsorption may occur when a chemical moves through an environmental compartment so rapidly that equilibrium conditions cannot be achieved. Solids to solution ratio Changes in the water content of a soil or sediment will change the fraction of chemical that is adsorbed. As the water content is lowered, the fraction adsorbed will increase as the concentration in solution does. Loss of chemical The chemical may be lost during the test due to volatilisation, degradation, adsorption to test flask walls etc. if this is not considered. Non-linear isotherm If the adsorption isotherm is non-linear, the reported value of Koc will depend on the range of chemical concentrations used in the tests. Time factor The time for the chemicals to adsorb/desorb varies depending on conditions, substance properties etc. Models Several compilations of QSAR models for soil sorption are published in the literature. All of the available methods for estimating Koc involve empirical relationships with some other property of the chemical:
Most models are based on Kow because hydrophobic interactions are the dominant type of interactions between non-polar substances and soil organic carbon. However, chemicals with more polar groups may interact by other types of interaction. It is therefore obvious that not one single model accurately predicts soil sorption coefficients and that different models should be used depending on which class of chemicals that the specific compound belongs to. Some of the models/equations have been developed from training sets of insecticides, herbicides and fungicides or compounds of related structure. The relationships are regression equations usually expressed in the log-log form: log Koc = a log (S, Kow, or BCF) + b Where “a” and “b” are constants. Examples of QSARs developed for estimating log Koc from experimental data on water solubility, log Kow and bioaccumulation factor BCF are given in Lyman et al. (1982) and presented in table 5 for different chemical classes. The second equation in table 5 was derived from pesticides (Kenaga 1980). Individual results estimated for the pesticides selected for this report can be found in the appendix under the heading ”Koc, Lyman, est”. Table 5 Estimering af Koc (Lyman et al. 1982).
S: water solubility in mg/l. NA: not available. n: number. r²: correlation coefficient. The EU Technical Guidance Document (TGD 1996) for risk assessment presents 19 equations to estimate log Koc in soil and sediment for different chemical classes. The 19 QSAR models were developed by Sabljic et al. (1995). For values of log Kow, evaluated and recommended log Kow values (known as LOGPSTAR data) or reliable ClogP data were used. For log Koc, data from two literature compilations of soil sorption coefficients were used and median values when several measured Koc values were available (Sabljic et al. 1995). The soil sorption data used in Sabljic et al. (1995) were determined for non-ionic species of respective chemicals and thus, the QSAR models presented in the table 6 will be applicable only for non-ionised chemicals: Table 6 Liste over udledte QSAR modeller til estimering af adsorption med deres kemiske områder (Sabljic et al. 1995).
n: Number of substances. r²: Correlation coefficient. SE: Standard error. In table 6, predominantly hydrophobics were in this context defined as compounds that contain only carbon, hydrogen and halogen atoms (i.e. C, H, F, Cl, Br, I). Nonhydrophobics were are all the chemicals not defined as predominantly hydrophobic. It means that the definition was based on molecular structure and does not imply anything about lipophilicity. For agricultural chemicals (acetanilides, carbamates, esters, phenylurea, phosphates, triazines and uracils), the following equation was recommended (cf. table 6 above):
Of other methods, the first order molecular connectivity index (1) has successfully been used to predict log Koc for hydrophobic organic compounds (Sabljic 1987, Bahnick and Douchette 1988). The calculation has been computerised and Meylan et al. (1992) describe the estimation methodology. Briefly, the equation used is:
Where ¹χ is the first order molecular connectivity index and ΣPf is the summation product of all applicable correction factors (Meylan and Howard 1994). The calculations are performed by PCKOC part of the EPIWIN (Meylan and Howard 1994). Pesticides Because pesticides are the subjects of this report, correlations have been performed using both the model calculation programmes PCKOC (Epiwin, Syracuse) and the TGD recommended QSAR model by Sabljic et al. (1995).
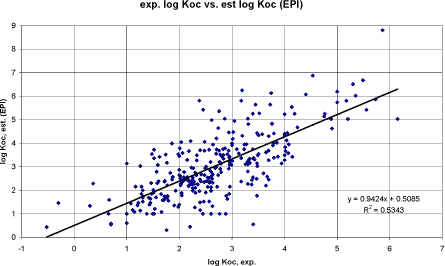
Figure 8 Korrelation mellem eksperimentel log Koc og log Koc vurderet efter PCKOC-program.
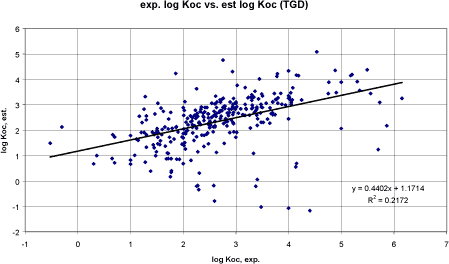
Figure 9 Korrelation mellem eksperimentel log Koc og log Koc vurderet efter TGDs QSAR-model for pesticider (Tabel 6, 4. ligning). Performing a linear regression between the experimental Koc and the Koc estimated by the computer model EPIWIN (Meylan and Howard, Syracuse) resulted in a correlation coefficient r² of 0.53 (n= 306) (cf. figure 8). Performing the same regression using the QSAR model recommended in TGD for agricultural chemicals (cf. above) resulted in a correlation coefficient r² of 0.22 (n= 306) (cf. figure 9). It would normally result in the EPIWIN model to be recommended. However, the poor result of the TGD model seem to be related to outliers whereas the main points are closer to the regression line than in the EPIWIN estimates and the TGD QSAR models for Koc estimation developed by Sabljic et al. may be used with care. Generally, all the correlation coefficients of the QSARs examined in this study were poor. The slope of the correlation equation for the EPI and the TGD recommended QSAR for hydrophobic substances were the closer to 1 (n = 305. y = log Koc. x = log Kow. Individual values can be found in the appendix):
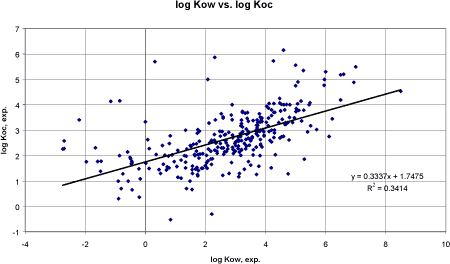
Performing a linear regression analysis between the experimental log Kow and experimental log Koc demonstrates problems in estimating Koc from low log Kow values, cf. figure 10.
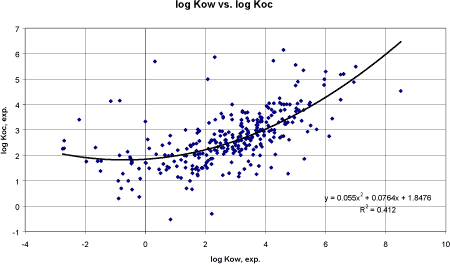
Figure 10 Korrelation mellem eksperimentel log Kow og eksperimentel log Koc. Based on 300 pesticides, the correlation coefficient r² was 0.34 and unacceptably low but an improvement compared to the Lyman and TGD correlations. Apparently, the data are not linear. A polynomial regression of the 2nd order was tried (figure 11) and resulted in the equation: log Koc = 0.055 logKow² + 0.0764 logKow + 1.8476 The correlation coefficient r² was 0.41 using data from 300 pesticides. The graph demonstrated that a linear correlation might be most valid between log -1 to 5. The individual results are presented in the appendix under the heading log Koc, OCH estimate.
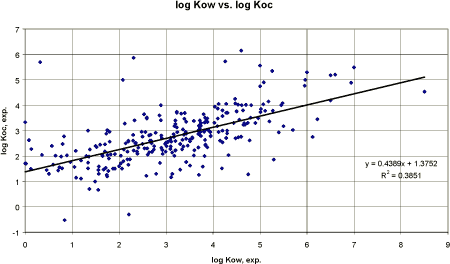
Figure 11 Korrelation mellem eksperimentel log Kow og eksperimentel log Koc. Kurven er fastlagt ud fra en polynomial regression (n=300). A new linear regression analysis was tried after leaving out the pesticides with the lowest log Kow values. The result is presented in figure 12. Reducing the number of outliers by narrowing the log Kow range from 0 to 8.5 increased the correlation coefficient to 0.39. The resulting regression equation or derived QSAR model was:
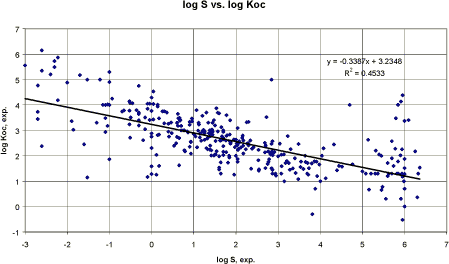
Figure 12 Korrelation mellem eksperiment log Kow og eksperimentel log Koc. Data med log Kow mindre end 0 er udeladt. Using the water solubility to estimate the adsorption coefficient did improve the result (figure 13).
Figure 13 Korrelation mellem eksperimentel vandopløselighed (log S) og eksperimentel log Koc. The resulting correlation was:
The result is close to the QSAR observed for pesticides by Kanazawa (1989), although for a fewer number:
Conclusion The soil adsorption coefficient factor is very important in the evaluation of the mobility of pesticides and since the known methods for estimation are approximate at best, measured values should be recommended. If however, measured data for some reason are not present; the QSAR model to estimate Koc developed by Sabljic et al. (1995) and recommended in TGD (1996) or the calculation programme PCKOC may be used. However, based on 338 pesticides in this project, QSAR models, based on log Kow or the water solubility, were derived which had correlation coefficients which were better than the model by Sabljic et al (1995). These QSARs derived for pesticides could be considered when evaluating experimental results are either not present or conflicting. 3.4 Bioaccumulation3.4.1 Bioaccumulation factor for aquatic organismsThe uptake of chemical substances into living organisms occurs mostly by direct adsorption but also along trophic web. The internal concentration, e.g. in fish, may increase by accumulation to a level causing toxic effects, even if the internal concentration remains below the critical limit (OECD 1993b). The accumulated substance may then be passed on to other organisms higher up in the food web which were not directly exposed themselves. The bioaccumulation or bioconcentration factor (BCF) in aquatic organisms is defined as the ratio between the concentration of the chemical in biota and the concentration in water at equilibrium. Procedures for estimating the bioconcentration potential have been reviewed by e.g. Lyman et al. (1982), Connell (1988), Nendza (1991b), and OECD (1993b). Comparison of non-ionic organic chemicals exhibiting substantial bioconcentration revealed several common characteristics. The bioconcentration potential of a chemical was directly related to its lipophilicity and inversely related to its water solubility, molecular charge and degree of ionisation (Lyman et al. 1982, Connell 1988). In fish, the lipid tissue is the principal site for bioaccumulation and since n-octanol is often a satisfactory surrogate for lipids, linear correlations are usually observed between log BCF and log Kow. Most QSAR models on bioconcentration are based on log Kow. The simplest form of the relationships is based on the partition process of the lipid phase of fish and water: BCF = a × Kow (where a is the lipid fraction actually ranging 0.02 - 0.2) It is generally agreed that a linear relationship exists for chemicals, which are not biotransformed with a log Kow < 6. Veith et al. (1979) developed a linear model based on fathead minnows (Pimephales promelas) valid for log Kow < 6:
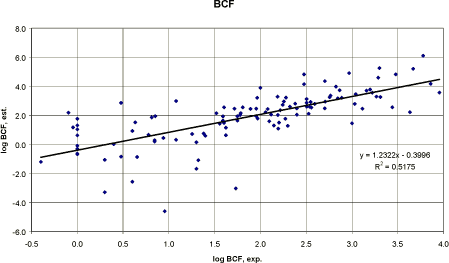
In the log Kow range above 6, the measured log BCF data tend to decrease with increasing log Kow. Performing a regression analysis, using the Veith et al. (1979) developed QSAR on the pesticides used in this report, would result in the following correlation (figure 14):
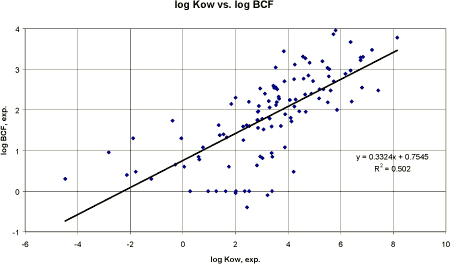
Figure 14 Korrelation mellem den eksperimentelle log BCF og den estimerede log BCF (Veith et al. 1979). The correlation between the experimental values and the estimated values seems to be acceptable with a correlation coefficient, r², of 0.52 (figure 14). The result is less accurate than Veith et al. (1979) but it is to be expected considering the diverse group of chemical compounds, different fish species and different laboratories although the amount of data (n=112) included was higher. Developing a new QSAR, based on regression analysis between measured log Kow and experimental log BCF for 112 pesticides, would result in a similar correlation coefficient (figure 15):
The QSAR is still inaccurate but being at the same level as Veith et al. (1979) and may be used for screening purposes.
Figure 15 Korrelation mellem eksperimentel log Kow og eksperimentel log BCF baseret på 112 pesticider. 3.4.2 Bioaccumulation factor for terrestrial organismsIn water, the bioconcentration factor are based on the concentration in the aquatic organism or part of the aquatic organism (e.g. whole fish or part of fish) divided by the concentration in water presumably under equilibrium conditions. The maximum amount of a chemical in water is governed by the water solubility of the chemical, which can be very low. In soil, the situation is different since no saturation limit is imposed by solubility. The biology of the soil living organism determines whether the bioavailability is a question of the water solubility of the substance or not. Distribution of pesticides in soil from use application is rarely uniform. If applied to soil surfaces, the upper few centimetres usually contain the majority of the substance and the measured concentration depends on the depth of the soil sampled for analysis. For instance, if the application is 1 kg/ha and assumed uniformly distributed in soil 2.5 cm, 5 cm, 10 cm or 25 cm deep with the density 1500 kg/m³, the estimated concentration in soil would be 2.67, 1.33, 0.66 or 0.26 mg/kg soil, respectively. Thus, bioconcentration factors for terrestrial animals on treated soil do not have the same basis for a denominator as for aquatic animals in treated water (Kenaga 1980). Because of the difficulty in determining and deciding on a uniform soil residue denominator for BCF, very little data comparable to aquatic organisms are available for terrestrial organisms. Earthworms For the assessment of secondary poisoning in the terrestrial food chain, the bioconcentration factor in worms is necessary. The bioconcentration factor is defined as:
As the concentration in soil and the concentration in pore water are related through the Koc where Koc = Csoil(oc) / Cpore water, the calculation could be performed using the concentration in soil and the soil/water partition coefficient assuming steady state:
QSAR Finally, the QSAR models may be used. Van Gestel and Ma (1988) determined the BCF for two species of earthworms for five chlorophenols and found a relationship with log Kow. Connel and Markwell (1990) increased the data amount from literature and developed a model based on log Kow. The model was generated on data on pesticides with a log Kow range of 1-6. The BCF-log Kow relationship applies generally to neutral organic substances, which are not easily biotransformed. The relationship is not valid for ionised substances and organometals. The model needs further validation. The QSAR for BCF in earthworms developed by Connel and Markwell (1990) is presented below:
Pesticides Only a very few data exist on BCF in earthworms for pesticides that are precise enough to be used in a comparison. Therefore, the accuracy of the estimation from the QSAR by Connel and Markwell (1990) could not be compared. 3.5 Aquatic toxicity3.5.1 QSAR models on aquatic ecotoxicityWithin the aquatic ecotoxicology, QSAR models have been used to estimate biological effects of various chemical substances. For instance, frequently the octanol-water coefficient (log Kow) of a substance has been used to estimate the ecotoxicity potential of the substance to organisms. Most literature on developing QSARs for toxicity estimations has assumed that compounds from the same chemical class should behave in a toxicologically similar manner (cf. section 3.1). Recent literature indicates that similarity in mode of toxic action is not necessarily related to typical chemical classification but to molecular structures. As a consequence, QSAR development and application have been evolving from a chemical class perspective to one that is more consistent with assumptions regarding modes of toxic action (TGD 1996, Russom et al. 1997). For instance, Russom et al. (1997) have performed a classification of chemicals into 8 modes of toxic action based on fathead minnow (Pimephales promelas) exposed in 96 hours flow-through studies to 617 chemicals. The Russom et al.(1997) classification on modes of toxic action included:
A few comments are given below on the most essential action mechanisms relating to pesticides. Base-line narcosis or non-polar narcosis Base-line toxicity or the “minimum toxicity” is related to the hydrophobicity of the substance and is also referred to as non-polar narcosis. In absence of specific toxic mechanisms, the internal effect concentration is almost constant and a substance will then be as toxic as predicted by its hydrophobicity due to the relation with bioconcentration (McCarthy and MacKay 1993). Indications of non-polar narcosis are the change of EC50 over time. The ratio EC50 (24 hours)/EC50 (96 hours) approximately 1.0 is considered indicative of non-polar narcosis. Excess toxicity values, calculated by dividing predicted “narcosis I” EC50 values by the observed values, greater than 10 indicate that the substance does not act by non-polar narcosis (Russom et al. 1997). Examples of pesticides classified as having the toxic mode of action of non-polar narcosis are alachlor, bromacil and diuron. Polar narcosis The polar narcosis class consists of more polar chemicals such as phenols, esters and anilines. The mode of action of these substances is not very specific but they are significantly more toxic than predicted by non-polar narcosis. Acetylcholinesterase inhibition Several insecticides are acting by acetylcholinesterase inhibition, e.g. carbamates and organophosphorous pesticides. Examples of pesticides are azinphos-methyl, carbaryl, carbofuran, chlorpyriphos, diazinon, malathion and methomyl. CNS seizure responses Central Nervous System (CNS) seizure/stimulant responses. In literature and handbooks, the mode of action is often called contact action or contact and stomach action. Examples of pesticides are organochlorines and pyrethroids such as dicofol, fenvalerate and permethrin (Russom 1997). QSARs for the acute and long term effects on fish, daphnia and algae are present for chemicals that act by non-specific mode of action (non-polar narcosis as well as polar narcosis). The latest evaluation of current models in ecotoxicity resulted in the QSAR models mentioned in the tables 7 and 8 (Verhaar et al. 1992, 1995). Table 7 QSAR for ikke-polær narkotisk virkende stoffer (Verhaar et al. 1995, TGD 1996).
The models are generated by linear regression analysis. The experimental data were generated according to OECD test guidelines or comparable methods. QSAR models for chemicals, which act by polar narcosis (esters, phenols and anilines), are also available. The mode of action of these compounds is also not very specific but they are significantly more toxic than predicted by non-polar narcosis. Table 8 QSAR for polær narkotisk virkende stoffer (Verhaar et al. 1995, TGD 1996).
The models were generated by linear regression analysis. The experimental data were generated according to OECD test guidelines or comparable methods. Classification For classification purposes, the Danish EPA has developed a programme to estimate the minimum acute aquatic toxicity: QTOXMIN. The programme QTOXMIN is available in Pedersen et al. (1995) and in Pedersen and Falck (1997). However, the use of QSAR data for classification is currently under discussion. At this stage it is proposed that the use of QSAR estimations for base-line acute aquatic toxicity should be limited and only used if the prerequisites below are fulfilled (Pedersen et al. 1995):
The QSAR equations recommended are (results in mol/l):
The equations are applicable for neutral, organic, non-reactive and non-ionisable compounds such as alcohols, ketones, ethers, alkyl and aryl halides, and can also be used for aromatic hydrocarbons, halogenated aromatic and aliphatic hydrocarbons as well as sulphides and disulphides (Pedersen et al. 1995). Generally, the differences in acute toxicity between non-polar and polar narcotic acting substances are only significant for substances with a log Kow value less than 2.7. Thus, for polar acting narcotic substances with a log Kow value above 2.7, the presented QSAR equations can also be used as a reliable predictor of their acute aquatic toxicity. For polar narcotic acting substances with a log Kow value less than 2.7, and especially for reactive substances and for substances with a specific mode of action, the presented QSAR equations will significantly underestimate the acute toxicity (Pedersen et al. 1995, Pedersen and Falck 1997). The QSAR equations recommended for classification are the same or almost the same as the equations recommended in TGD (1996), which are used in the estimations of aquatic toxicity of pesticides in this report. Pesticides It is important to realise that most of the QSARs developed and the QSARs presented above are based on chemicals that are biased toward industrial organic chemicals, which are not overtly designed to have biological activity. Pesticides are mostly reacting in a specific mode of action and no QSARs have been recommended for substances that act by more specific modes of action (TGD 1996). 3.5.2 Correlations between experimental and estimated ecotoxicityBase-line toxicity correlations In figure 16, the correlations on estimated acute toxicity in the aquatic organisms where estimated values are based on the QSARs for non-polar narcosis substances are presented. It is primarily performed to illustrate the concept of “minimum” toxicity than estimated EC50 values as only few pesticides have been identified as non-polar narcosis and then on a level D confidence, e.g. diuron, bromacil and alachlor (Rossum et al. 1997). For comparison, EC50-values have been analysed using both QSAR for polar as well as for non-polar substances. The estimated values in mol/l are recalculated to mg/l by multiplying with molecular weight and a factor 1000. Fish
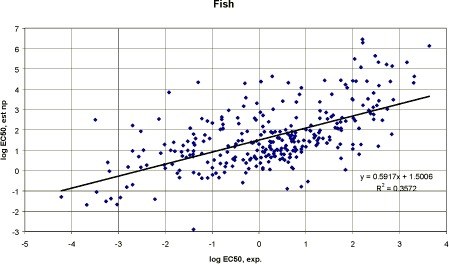
Figure 16 Korrelation mellem eksperimentelle og estimerede EC50-værdier (log) med ikke-polær narkosetype QSAR).
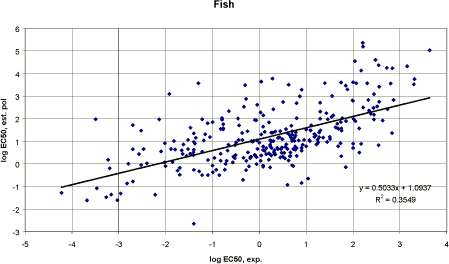
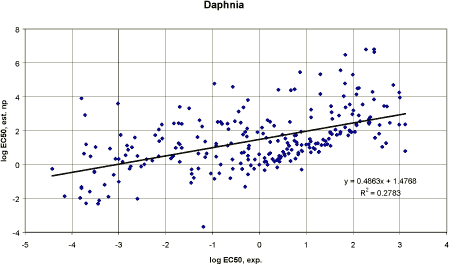
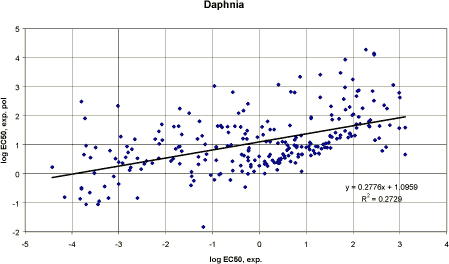
Figure 17 Fisk: Korrelation mellem eksperimentel EC50 - og estimerede EC50 værdier baseret på QSAR for polært narkotisk virkende stoffer. As expected, the estimated values on acute fish toxicity are overestimated i.e. above the trend line with intercept 0 and the slope 1. Thus, the true EC50-value is below the estimated value. For chemicals with a specific mode of action, the effect concentration is generally between 10 and 10000 times lower than predicted by baseline toxicity QSAR equations (Verhaar et al. 1992). The same applies to daphnia and algae (cf. below). The linear regression analysis of the relationship between the experimental log EC50 and the estimated log EC50 for fish resulted in a correlation coefficient r² of 0.35 based on n = 297. The result was approximately the same irrespective of whether the non-polar or the polar QSAR was used. It is far from satisfactory but the QSAR model may be used for screening purposes. Daphnia For comparison, linear regression analyses of the relationship between the experimental log EC50 and the estimated log EC50 for daphnia are performed for both non-polar and polar narcosis type QSARs (figures 18 and 19). The correlation coefficient r² for non-polar narcosis type QSAR was 0.28 and the correlation coefficient r² for polar narcosis type QSAR was 0.27. The number of data sets was 255. The result indicates that the available QSAR models for estimating acute toxicity to daphnia are not acceptable for pesticides in general at present.
Figure 18 Dafnier: Korrelation mellem eksperimentelle EC50 og estimerede EC50 -værdier baseret på QSAR for ikke-polære narkotisk virkende stoffer.
Figure 19 Dafnier: Korrelation mellem eksperimentelle EC50 og estimerede EC50 -værdier baseret på QSAR for polære narkotisk virkende stoffer. Daphnia, chronic Long-term effect studies (16 days) on Daphnia have also been used to develop a QSARs on daphnia reproduction.
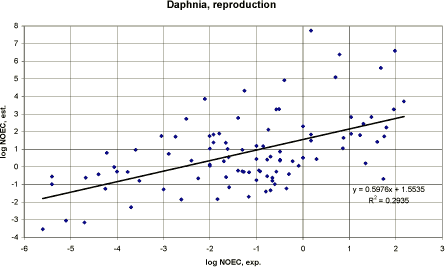
Figure 20 Korrelation mellem eksperimentel dafnie NOEC (16-21 dage) og NOEC værdier baseret på QSAR for ikke-polære narkotisk virkende stoffer. A linear regression analysis of the relationship between the log NOEC from experimental Daphnia reproduction tests and the currently recommended QSAR (table 7) resulted in a correlation coefficient r² of 0.29 based on n = 96 (figure 20). The correlation was lower than the recommended QSAR which was based on n=10. It should also be noted that the QSAR for estimating daphnia reproduction NOEC was based on 16-day tests and the experimental results in this report are mainly from 21-day tests. This could reduce the comparability. The result indicates that the used QSAR model for estimating chronic Daphnia NOEC values is not recommendable for pesticides in general.
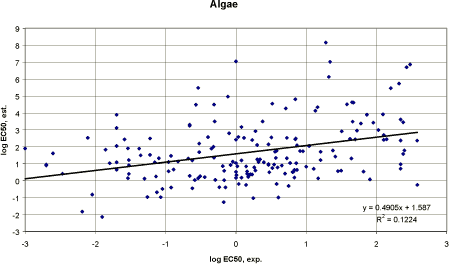
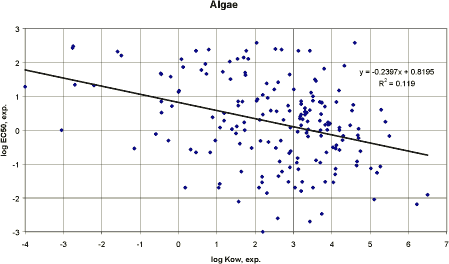
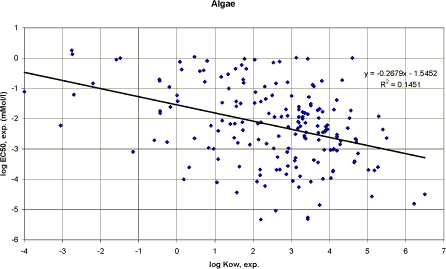
Figure 21 Korrelation mellem eksperimentel EC50 og estimeret EC50 -værdier for alger (ikke-polær narkotisk virkende stoffer). Algae Linear regression analyses of the relationship between the experimental log EC50 and the estimated log EC50 for algae for non-polar type QSARs (figure 21) resulted in the correlation coefficient r² 0.12. The number of data sets was 193. For algae, the correlation was so low that it must be concluded that the resulting estimations are unacceptably poor. Discussion The situation with the present data set is that it has been chosen as a mixture of different pesticides to evaluate whether the evolved QSARs could be used in general. The general conclusion is that the results demonstrate that the available QSAR models should be used with great precaution, as they are not developed specifically for pesticides. Individual results of the estimation can be found in the appendix. Generally, the results support the concept of minimum toxicity, i.e. if the substance is estimated to be toxic the experimental results may be expected to confirm that the substance is more toxic than estimated. If the pesticides were selected according to function, mode of action or chemical class another result might have appeared. The following two sections presents examples of QSARs developed for specific pesticides (3.5.3) and the QSARs derived from the pesticides used in the report (3.5.4). 3.5.3 QSARs developed for specific pesticidesTwo examples of developed QSAR models for pesticides from the same chemical class and assumed same mode of action are presented below. Phenylureas Phenylurea herbicides have been selected as model compounds representing a well-defined class of chemical structure mostly acting by a uniform mode of action by Nendza (1991) and Nendza et al. (1991). Satisfactory estimates on the phenylureas fish toxicity were obtained from a log Kow dependent QSAR. The toxicity to algae and plants which were the most sensitive species corresponding to the mode of action (interacts with the electron transport chain in the photolysis reactions) could be estimated by including the Hill reaction inhibition in the QSAR. Nendza et al. (1991) used the following equations with satisfactory results: Fish: log 1/LC50 (mmol/l) = 0.62 log Kow - 0.56 (n=118, r=0.91, s=30) QSARs derived for non-reactive chemicals underestimate the effects of phenylureas on algae significantly. Regarding their mode of action, the inhibition of algae photosystem should be included. Nendza et al. (1991) presents a QSAR modelling the interaction with the electron transport chain (pI50 Hill reaction) giving acceptable estimates of the phenylureas' algae toxicity by including the ionisation potential (IP) besides log Kow as descriptors: Algae: pI50 = 0.93 log Kow + 0.69 IP - 3.03 (n=12, r= 0.97, s= 0.37) In Nendza (1991), the equation on algae toxicity is changed and instead tabulated electronic properties () is employed: Algae (log 1/[mmol/l]): The results from Nendza et al. (1991) are presented in table 9. For algae, it was observed that the estimated EC50 values were always below the experimental values (cf. table 9). Table 9 Phenylurea herbiciders log Kow, eksperimentel (exp.) og estimeret (calc.) toksicitet (log 1/(mmol/l) (Nendza et al. 1991).
Organophosphorous QSARs have also been developed for the toxicity of organophosphorous pesticides to Daphnia (Vighi et al. 1991). The 22 tested chemicals were belonging to the subclasses: phosphates, phosphorothionates, phosphorodithionates, and phosphonates. They all had a specific mode of action: cholinesterase inhibition. The QSARs were obtained by multilinear correlations with independent variables: log Kow, first order valence molecular connectivity (1χv) and complementary information content (CIC) as independent variables for a number of chemical substances. For Daphnia, the best equation obtained was: log 1/EC50 = 0.55 log Kow - 0.085 (log Kow)² - 3.93IC -0.016 (1χvox)² + 0.13α3 - 0.0006(α3)² + 4.58 (n=22, r²=0.895, s=0.67) where the molecular connectivity indices developed by Hall and Kier (1981) and information index of neighbourhood symmetry, IC (information content), were used as descriptor of topological information. Valence molecular connectivity indices encode information on volumetric and electronic characteristics of the bonds in the molecule and are also calculated for the oxygen metabolites, 1χvox. The variable 3 describes the electronegativity of the leaving group in the acetylenesterase inhibition reaction (Vighi et al. 1991). The approach was considered satisfactory in describing the toxicity of a relatively heterogeneous set of organophosphorous compounds after introduction of variables able to describe the particular reactivity of these compounds characterised by a highly specific biological activity. 3.5.4 QSARs derived from pesticides in the reportBased on the approximately 400 pesticides including some salts and esters selected for this study (cf. appendix), it was decided to study whether dividing the pesticides into minor groups would improve the predictability. Furthermore, it was decided to use the mode of action as basis. At first the pesticides were divided into five main groups and then further subdivided if sufficient data were present:
Linear regression analyses were performed between the experimental EC50 values and the experimental log Kow. The analyses were performed using both mg/l and mmol/l on account of the general idea that the molecular weight influenced the effect level. Graphic presentations of the correlations between experimental EC50-values and log Kow are presented below for fish, daphnia and algae. Fish
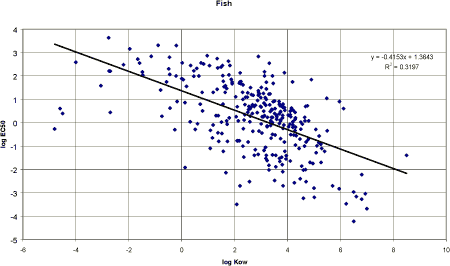
Figure 22 Korrelation mellem eksperimentel log Kow og eksperimentel EC50 for fisk (n=300) for alle pesticider i appendiks. Using all the selected pesticides and performing a linear regression analysis of the correlation between experimental log Kow and the acute toxicity (cf. figure 22), the resulting equation for fish was:
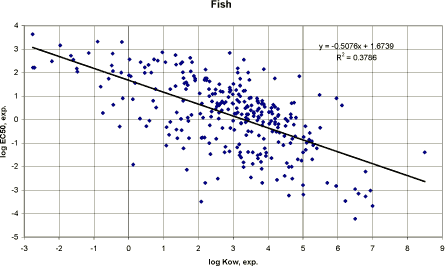
The reduced correlation compared with the previous section may be the result of data from several fish species and a broader variety of pesticides included in the calculation. However, a trend is obvious and the result may be sufficient for a screening procedure. Removing the data with the lowest log Kow values (log Kow values 4) improved the correlation coefficient slightly (Figure 23). The resulting equation for acute fish toxicity was then:
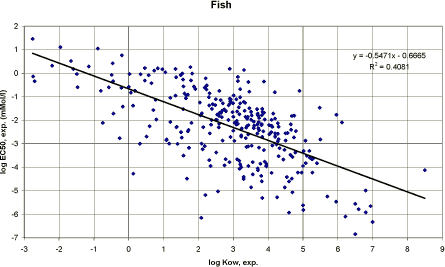
Figure 23 Korrelation mellem eksperimentel log Kow og eksperimentel EC50 for fisk (n=296). Many of the literature QSARs are presented using the mol/l instead of mg/l in the models estimating toxicity. It indicates that the molecular size or properties related to the molecular weight is important to the estimated toxicity. As the argument seems reasonable a recalculation of the measured data to mmol/l was performed. The result is presented in figure 24.
Figure 24 Korrelation mellem log Kow og eksperimentel EC50 for fisk (n=296) mmol/l. The resulting equation for acute fish toxicity was:
The correlation coefficient was slightly higher. The reason was probably that the variation of molecular weights for the used pesticides was relatively narrow (299±103 g/mol, n=409). Using mmol/l instead of mg/l had minor effect on the correlation coefficient. Mainly results from mmol/l are shown in the figures and both equations are presented in the text. Mode of action The data on fish acute toxicity were divided into:
pH of soil and water
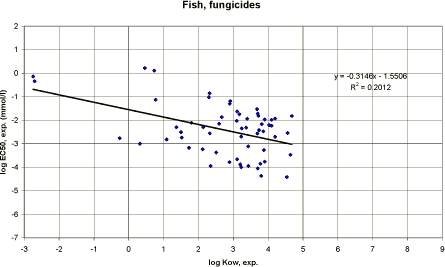
The axes in the following charts are kept constant for comparison. For fungicides, 59 corresponding experimental log Kow and EC50 values were found. In figure 25, a trend is indicated but the dispersion is high. This could be expected since fungicides do not have a specific action mode towards fish.
Figure 25 Korrelation mellem log Kow og eksperimentel EC50 for fisk med data for fungicider (n=59). The resulting equations for acute fish toxicity using fungicide data were:
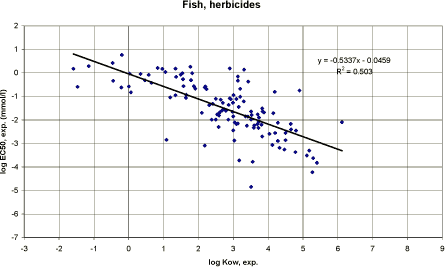
Figure 26 Korrelation mellem log Kow og eksperimentel EC50 for fisk ved anvendelse af herbicid data (n=118). For herbicides, all available data on experimental log Kow and fish EC50 were used and presented in figure 26. The resulting equations for acute fish toxicity using herbicide data were:
The data on herbicides was divided into herbicides with a growth inhibition mode of action and herbicides with a photosynthesis inhibition mode of action.
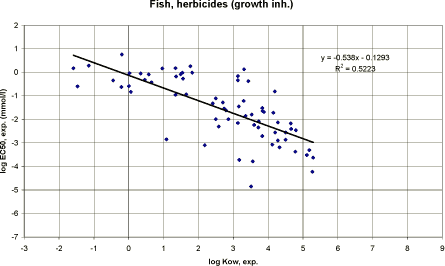
Figure 27 Korrelation mellem log Kow og eksperimentel EC50 for fisk ved anvendelse af herbicid data med væksthæmmende virkningsmekanisme (n=69). The resulting equations for acute fish toxicity using data on herbicides with a growth inhibition mode of action (cf. figure 27) were:
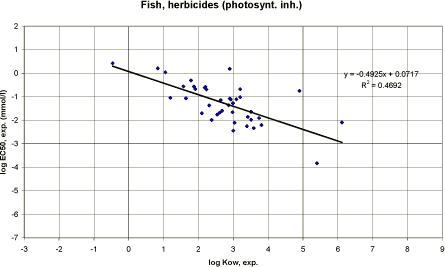
Figure 28 Korrelation mellem log Kow og eksperimentel EC50 for fisk ved anvendelse af data for herbicider med fotosyntesehæmmende (n=40). virkningsmekanisme. The resulting equations for acute fish toxicity using data on herbicides with a photosynthesis inhibition mode of action (cf. figure 28) were:
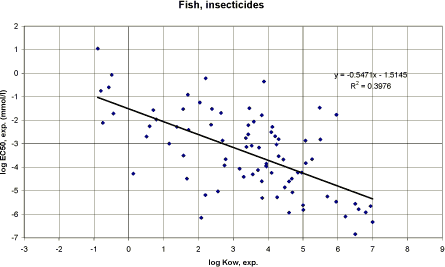
Compared to the result using fungicides, the estimations on fish acute toxicity using herbicide data were improved. The correlation coefficients for herbicides with a growth inhibition mode of action were slightly higher than for herbicides characterised with a photosynthesis inhibition mode of action. The two modes of action is based on action modes taking place in plants and would be expected to be meaningless to fish. However, some herbicides are toxic to fish and the reason may be a general toxic action or a specific toxic action to enzymatic systems in fish. Whatever the reason, log Kow data on herbicides seems to an acceptable variable to estimate the general acute toxicity to fish. For insecticides, all the data on experimental log Kow and acute toxicity are used and presented in figure 29. The data are then divided into insecticides with a cholinesterase inhibition mode of action and insecticides with a contact and systemic mode of action.
Figure 29 Korrelation mellem log Kow og eksperimentel EC50 for fisk ved anvendelse af insekticiddata (n=81). The equations for acute fish toxicity using insecticide data were:
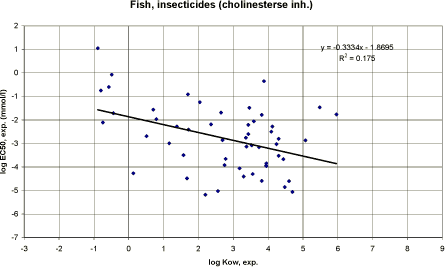
Figure 30 Korrelation mellem log Kow og eksperimentel EC50 for fisk ved anvendelse af insekticiddata for insekticider med cholinesterasehæmmende virkningsmekanisme (n=53). The equations for acute fish toxicity using data on insecticides with a cholinesterase inhibition mode of action were:
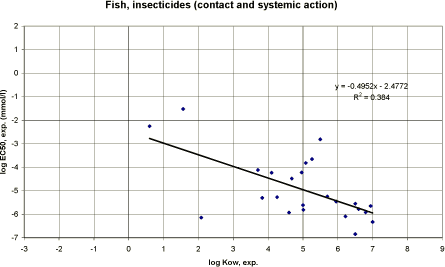
Figure 31 Korrelation mellem log Kow og eksperimentel EC50 for fisk ved anvendelse af data for insekticider med kontakt og systemisk virkningsmekanisme (n=24). The equations for acute fish toxicity using data on insecticides with a contact and systemic mode of action were:
Comparing the figures on fungicides, herbicides and insecticides, it can be observed that the data points occupy a lower position in the charts that indicate a higher toxicity of insecticides to fish. This is not surprising since for instance a cholinesterase inhibition mode of action should also affect fish. The data points are widely scattered which result in a low correlation coefficient. However, it should be remembered that several fish species, laboratories etc. are included and that it is the lowest experimental values found on acute toxicity that are used as effect data. These factors may result in the observed scattering of data points.
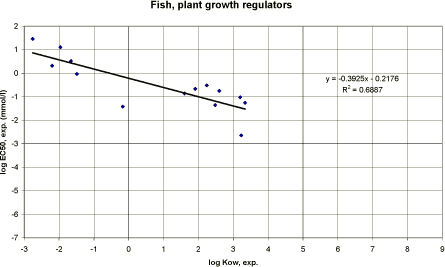
Figure 32 Korrelation mellem log Kow og eksperimentel EC50 for fisk ved anvendelse af data fra plantevækst regulatorer (n=14). For plant growth regulators, only few data sets were available (cf. figure 32). The equations for acute fish toxicity using plant growth regulator data were:
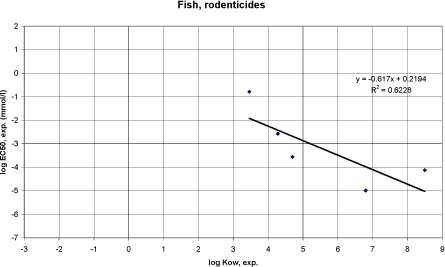
The correlation coefficient was high and the estimations on toxicity based on log Kow were acceptable for plant regulators. The data points are located in the upper end of the chart indicating lower toxicity than insecticides. It is not surprising since plant growth regulators usually affects meristematic tissues. The result could be compared with the results on rodenticides (cf. figure 33) where a high correlation coefficient was also observed. The equations for acute fish toxicity using rodenticide data were:
It should be noted that the regression equations on both plant regulators and rodenticides are based on few data sets and should be used with this in mind.
Figure 33 Korrelation mellem log Kow og eksperimentel EC50 for fisk med rottemidler (n=5). Daphnia For daphnia the same procedure as in fish was repeated using the same subdivision of pesticides.
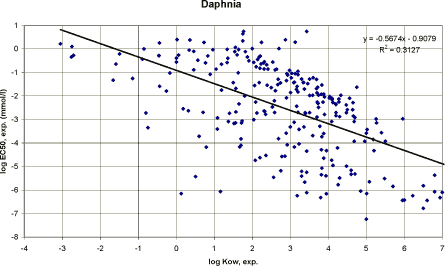
Figure 34 Korrelation mellem log Kow og eksperimentelle EC50-værdier for dafnier (n=255). Using all the selected pesticides and performing a regression analysis of the correlation between the experimental log Kow and the acute toxicity, the resulting equations for estimating acute daphnia toxicity were:
The reduced correlation compared with the Verhaar et al. QSARs may be the result of data from a broader variety of pesticides, data sources and/or study methodologies included in the applied values. The low correlation coefficient of 0.31 does not indicate a predictive value to be sufficient even for a screening procedure.
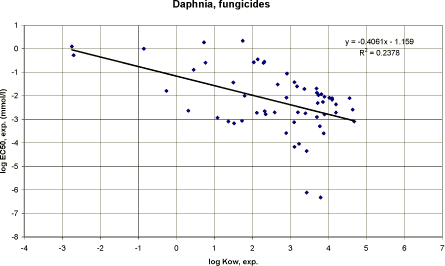
Figure 35 Korrelation mellem log Kow og eksperimentel EC50 for dafnier med data for fungicider (n=57). The resulting equations for acute daphnia toxicity using fungicide data were:
As with the fish data, the data points were widely dispersed and the correlation coefficient was low.
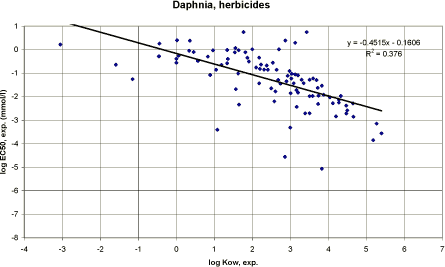
Figure 36 Korrelation mellem log Kow og eksperimentel EC50 for dafnier ved anvendelse af herbicid data (n=97). The resulting equations for acute daphnia toxicity using all available herbicide data (cf. figure 36) were:
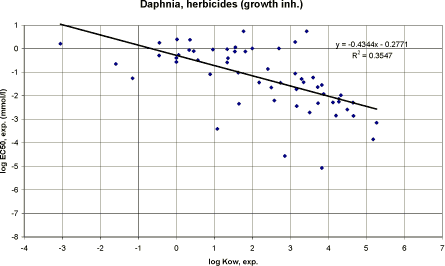
The correlation coefficients were low and with a low toxicity as indicated by the position on the chart (figure 36). The same comments on expected toxicity presented for fish above also applies to daphnia. The herbicide data were divided into herbicides with a growth inhibition mode of action (cf. figure 37) and herbicides with a photosynthesis inhibition mode of action (cf. figure 38). The resulting equations for acute daphnia toxicity using data on herbicides with a growth inhibition mode of action were:
Figure 37 Korrelation mellem log Kow og eksperimentel EC50 for dafnier ved anvendelse af data fra herbicider med væksthæmmende virkningsmekanisme.
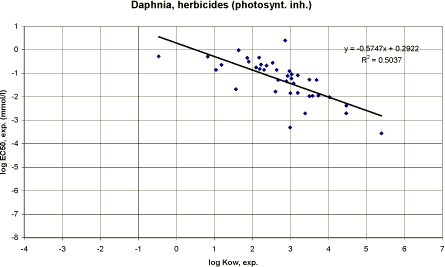
Figure 38 Korrelation mellem log Kow og eksperimentel EC50 for dafnier ved anvendelse af data fra herbicider med fotosyntesehæmmende virkningsmekanisme (n=39). The resulting equations for acute daphnia toxicity using data on herbicides with a photosynthesis inhibition mode of action were:
The correlation coefficient for data on herbicides with a photosynthesis inhibition mode of action was considerably higher than for the other data sets on herbicides. No explanation can be given. The position of the data points indicates relatively low toxicity of herbicides to daphnia that was not unexpected.
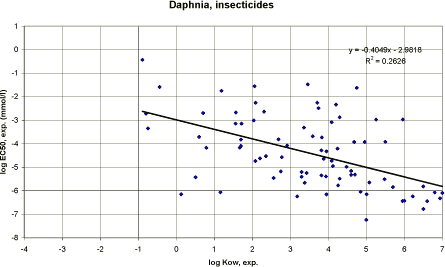
Figure 39 Korrelation mellem log Kow og eksperimentel EC50 for dafnier ved anvendelse af insekticiddata (n=79). The equations for acute daphnia toxicity using insecticide data were:
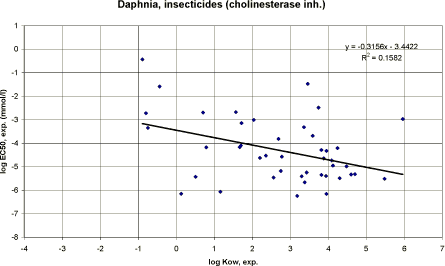
For insecticides, using all available data sets it could be observed by the position in the chart (figure 39) that insecticides were more toxic to daphnia than herbicides and fungicides as expected. The equations for acute daphnia toxicity using data on insecticides with a cholinesterase inhibition mode of action (cf. figure 40) were:
Figure 40 Korrelation mellem log Kow og eksperimentel EC50 for dafnier ved anvendelse af data for insekticider med cholinesterasehæmmende virkningsmekanisme (n=43).
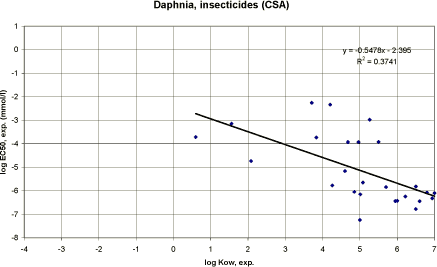
Figure 41 Korrelation mellem log Kow og eksperimentel EC50 for dafnier ved anvendelse af data for insekticider med kontakt og systemisk virkningsmekanisme (n=26). The equations for acute fish toxicity using data on insecticides with a contact and systemic mode of action were:
The data points from all insecticides were widely scattered. Dividing the data on insecticides into modes of action did not improve the correlation coefficients. Primarily data on Daphnia magna and a few data on Daphnia pulex were included. No other crustacean species were used. Data were based on OECD standard 48-hour tests. However, test conditions, media etc. may differ and may be part of an explanation. For plant growth regulators, only a few data sets were available. As indicated by figure 42 they were less toxic than the insecticides which was not unexpected due to their specific mode of action on plant meristematic tissues.
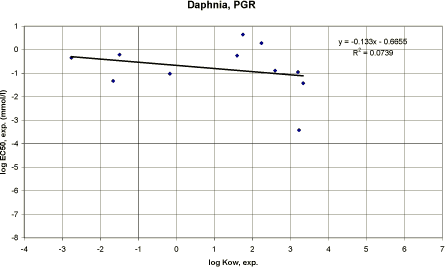
Figure 42 Korrelation mellem log Kow og eksperimentel EC50 for dafnier ved anvendelse af data fra plantevækst regulatorer (n=11). The equations for acute daphnia toxicity using plant growth regulator data were:
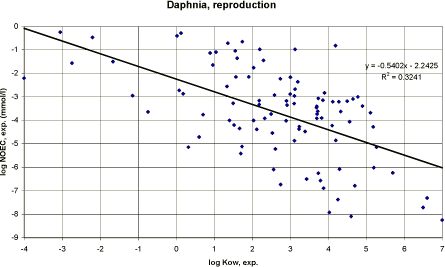
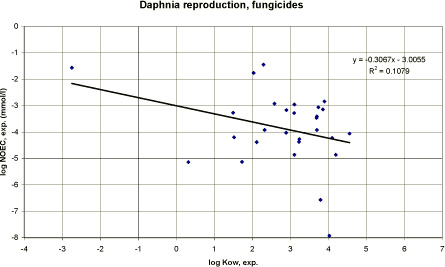
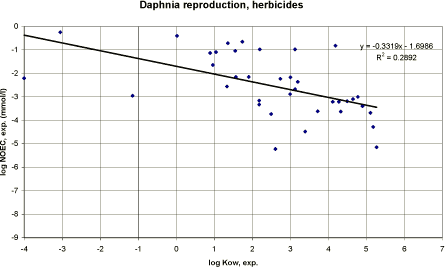
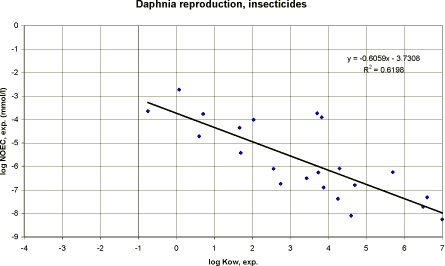
The correlation was very low and the data points few. The data indicate a low toxicity of plant growth regulators to daphnia. Another parameter than Kow should be searched for as descriptor. Daphnia reproduction For chronic toxicity, experimental 21-day NOEC data on Daphnia magna reproduction were used. However, sufficient data were not available to perform a division further than to the main groups of fungicides, herbicides and insecticides. Using all available pesticide data sets on daphnia reproduction resulted in figure 43.
Figure 43 Korrelation mellem eksperimentel log Kow og eksperimentelle værdier for dafniers NOEC (21 dage). Performing linear regression analyses between experimental log Kow and experimental NOEC values from daphnia reproduction tests resulted in the regression equations:
The correlation coefficients were close to the correlation observed when the QSAR from Verhaar et al. (1995) was used (cf. figure 20). In other words, the above-derived QSAR model may also be used for estimating the daphnia reproduction NOEC with the same precision as the recommended QSAR. The correlation coefficient was low. However, seeking for QSAR models to be used in general, low correlation coefficients may be accepted and the results used with precaution for indicative purposes only.
Figure 44 Korrelation mellem data for eksperimentel log Kow og eksperimentel dafnie NOEC (21 dage) fra svampemidler. The resulting equations for chronic daphnia toxicity using fungicide data were:
Figure 45 Korrelation mellem data for eksperimentel log Kow og eksperimentel dafnie NOEC (21 dage) for herbicider. The resulting equations for chronic daphnia toxicity using herbicide data were:
Figure 46 Korrelation mellem data for eksperimentel log Kow og eksperimentel dafnie NOEC (21 dage) for insekticider. The resulting equations for chronic daphnia toxicity using insecticide data were:
Data on rodenticides were insufficient for analysis to be performed. For estimating the chronic toxicity to daphnia using daphnia reproduction NOEC as end point and log Kow as descriptor, the resulting equations on fungicides and herbicides were meaningless. This may be the result of the designated substances' mode of action in contrast to insecticides where a toxic action is expected. The only derived equations with high correlation coefficients were data on insecticides. Although the data points were few a clear tendency was observed. However, more data should be included before a general use of the equation is recommendable. Algae The same procedure as for fish and daphnia is performed on acute algae tests. The data are from tests performed according to OECD test guidelines and the end point was inhibition EC50 values after 72 to 96 hours.
Figure 47 Korrelation mellem log Kow og eksperimentelle EC50 værdier for alger. Using all the selected pesticides and performing a regression analysis on the experimental log Kow and the acute toxicity data, the resulting equation for algae was:
The reduced correlation compared with the Van Leeuwen et al. QSARs may be the result of data from a broader variety of pesticides (Verhaar et al. n=10) and/or study methodologies included in the applied values. The low correlation coefficient of 0.12 does not indicate a predictive value to be sufficient even for a screening procedure. For algae, the QSAR from Verhaar et al. (1995) was expressed in mol/l where the results above were analysed using mg/l. Using mmol/l is presented in the figure below (figure 48). Transforming the toxicity data to mmol/l, the resulting equation for algae was:
Thus, only a minor improvement in the correlation coefficient is observed The data points are still widely dispersed and only a weak tendency evolved from the change.
Figure 48 Korrelation mellem log Kow og log eksperimentel EC50 (mmol/l).
Figure 49 Korrelation mellem log Kow og eksperimentel EC50 for alger med data for fungicider (n=48). The resulting equations for acute algae toxicity using fungicide data were:
Figure 50 Korrelation mellem log Kow og eksperimentel EC50 for alger med data for fungicider med ergosterolhæmmende virkningsmekanisme (n=17). The resulting equations for acute algae toxicity using fungicide data on fungicides with ergosterol inhibition mode of action were:
Figure 51 Korrelation mellem log Kow og eksperimentel EC50 for alger med data for fungicider med væksthæmmende virkningsmekanisme (n=24). The resulting equations for acute algae toxicity using fungicide data on fungicides with a growth inhibition mode of action were:
Based on fungicides, neither all available data nor a selection of data on fungicides with ergosterol inhibition mode of action resulted in any usable regression equations. The data points were scattered and no tendency could be observed.
Figure 52 Korrelation mellem log Kow og eksperimentel EC50 for alger ved anvendelse af herbiciddata (n=82). The resulting equations for acute algae toxicity using all available herbicide data were:
It was surprising that using herbicide data sets did not show any tendency. Results from different algae species are included. Algae species are known to differ considerably in sensitivity to chemicals. Another explanation could be that the general mode of action in herbicides does not apply to algae which normally is considered as aquatic micro-plants. A subdivision of data on herbicides with growth inhibition (cf. figure 53) and photosynthesis inhibition mode of action (cf. figure 54) was performed.
Figure 53 Korrelation mellem log Kow og EC50 for alger ved anvendelse af data fra herbicider med væksthæmmende virkningsmekanisme (n=51). The resulting equations for acute algae toxicity using data on herbicides with a growth inhibition mode of action were:
Figure 54 Korrelation mellem log Kow og EC50 for alger ved anvendelse af data for herbicider med fotosyntesehæmmende virkningsmekanisme (n=29). The resulting equations for acute algae toxicity using data on herbicides with a photosynthesis inhibition mode of action were:
The subdivision of herbicide data sets did not improve the correlation coefficients. No acceptable regression equations could be deducted. Regression analyses on experimental log Kow and insecticides (cf. figure 55) and selected insecticides with cholinesterase inhibition mode of action (cf. figure 56) were performed.
Figure 55 Korrelation mellem log Kow og eksperimentel EC50 for alger ved anvendelse af insekticiddata (n=34). The equations for acute algae toxicity using insecticide data were:
A tendency was observed and although the correlation coefficient was low the resulting regression equations may be used for indicative purposes. However, the number of data sets is small and more data should be included before further recommendation can be considered.
Figure 56 Korrelation mellem log Kow og eksperimentel EC50 for alger ved anvendelse af data for insekticider med cholinesterasehæmmende virkningsmekanisme (n=26). The equations for acute algae toxicity using data on insecticides with a cholinesterase inhibition mode of action were:
No result was gained by selecting data sets on insecticides with a cholinesterase inhibiting mode of action. It is not unexpected since the mode of action is irrelevant for algae. Using data on plant growth regulators, a positive result would be expected. The equations for acute algae toxicity using plant growth regulator data were:
A tendency was observed but the data too few to be conclusive. More data is needed before any recommendations can be made.
Figure 57 Korrelation mellem log Kow og eksperimentel EC50 for alger ved anvendelse af data for plantevækst regulatorer (n=8). 3.5.5 Discussion on estimated ecotoxicityBased on the results using the available recommended QSARs it could be observed that the estimated acute toxicity was generally underestimated. Using the experimental results from pesticides, improved results could be obtained for some organisms whereas for others (e.g. algae) no correlation could be observed using log Kow as descriptor. Dividing the data sets into primary functional areas (fungicides, herbicides, insecticides, plant growth regulators and rodenticides) according to the assumption that the manufacturers recommended the substance for the use areas where the largest effects would be expected, generally low correlations were observed. A further subdivision into the pesticides' mode of action resulted in improvements for some of the correlations and the opposite for others (cf. table 10). It is generally agreed that when measuring the effect of a chemical it is at the molecular level that the chemical has an impact. Therefore the QSARs should be developed based on effect concentrations expressed on a molar basis. Including the molecular weight in the calculations improved the correlations slightly (cf. table 10). However, for the pesticides where the variation in the molecular weight was relatively small (mean molecular weight of the studied pesticides and standard deviation was 299 and 103, respectively) the improvements by using mmol/l instead of mg/l were low. Table 10 Korrelationer mellem log Kow og effektkoncentrationer i mg/l eller mmol/l
PGR: Plant growth regulators. CSA: Contact and stomach action. Inh: Inhibitor The problems in reaching an acceptable correlation may be multiple. The toxicity values are from several species of fish, but primarily the lowest value has been used unless Pimephales promelas or Oncorhynchus my-kiss was present. Then they were preferred. The experimental Kow value may be incorrect if they are temperature or pH dependent. Generally, there is a large agreement with the experimental and estimated log Kow. However, discrepancies did occur and especially for ionisable substances the deviation could be large. The result may be to perform several QSARs according to more specific organism types, or according to chemical group e.g. from traditional chemical classification according to functional group. There is a high correlation between chemical functional groups and toxic mode of action. Another explanation could be that there is no direct relationship between log Kow and toxicity for specific acting substances. The exposure time is also determining for the effect of substances with a high log Kow. Data reliability To evaluate the predictive potential of QSARs, reliable biological and ecotoxicological databases must be assembled and computerised. These databases should be validated or reviewed as to data quality. Currently, such works are performed e.g. by the US-EPA in the database AQUIRE and the chemical industry ECETOC (ECETOC 1993). A procedure for data collection and interpretation for substances to be evaluated for classification as dangerous to the environment has been presented in Pedersen et al. (1995). Biological results may be numerically imprecise and are generally not generated for use in QSAR prediction. For instance, results from limit tests or results above water solubility or just designated “more than” cannot be used in QSARs. However, such data may be useful for demonstrating trends. But it must be kept in mind that individual results may not be quantitatively exact (Rispin 1981). Isomers Pesticides with one or more centres of asymmetry in the molecule represent a special problem in estimation of toxicity. For geometric isomers, the physico-chemical properties usually differ but optical isomers have identical physico-chemical properties, at least in solution. Such isomers may nevertheless differ greatly in their biological activity (Ariëns 1984). This makes ecotoxicity results based on racemic mixtures without know-ledge of the isomer ratio disputable, taking into account the fact that the individual isomers may differ essentially in their action.
|
||||||||||||||||||||||||||||||||||||||||||||||||||||||||||||||||||||||||||||||||||||||||||||||||||||||||||||||||||||||||||||||||||||||||||||||||||||||||||||||||||||||||||||||||||||||||||||||||||||||||||||||||||||||||||||||||||||||||||||||||||||||||||||||||||||||||||||||||||||||||||||||||||||||||||||||||||||||||||||||||||||||||||||||||||||||||||||||||||||||||||||||||||||||||||||||||||||||||||||||||||||||||||||||||||||||||||||||||||||||||||||||||||||||||||||||||||||||||||||||||||||||||||||||||||||||||||||||||||||||||||||||||||||||||||||||||||||||||||||||||||||||||||||||||||||||||||||||||||||||||||||||||||||||||||||||||||||||||||||||||||||||||||||||||||||||||||||||||||||||||||||||||||||||||||||||||||||||||||||||||||||||||||||||||||||||||||||||||||||||||||||||||||||||||||||||||||||||||||||||||||||||||||||||||||||||||||||||||||||||||||||||||||||||||||||||||||||||||||||||||||||||||||||||||||||||


