|
| Bottom | | Front page |
Key indicators 2004
Contents
Indicators as benchmarks
1. Gross domestic product per capita
2. Decoupling illustrated by environmental impacts for 4 factors (greenhouse gases, runoffs of nutrients into the sea, emissions of acidifying substances and emissions to air) in relation to
GDP
3. Genuine Savings
4. Employment analysed by age group
5. Average life expectancy (analysed between men and women)
6. Gross emissions of greenhouse gasses (analysed between industry, transport, households, agriculture, and waste)
7. Number of chemicals which have been classified
8. Area of natural habitats
9. Resource flows for 3 factors (energy consumption, drinking water consumption, waste) in relation to GDP
10. Assistance funds as a percentage of GNI, in total and analysed between development and environmental assistance, and assistance to neighbouring countries
11. The environmental profile of the energy sector, illustrated by energy consumption and emissions in relation to GDP
12. Number of ecolabelled products
13. Number of EMAS and ISO 14001 registered enterprises
A more detailed set of indicators, with 88 indicators for sustainable development, can be found at the Danish EPA website: www.mst.dk/indikator/bu/default.asp?sprogid=2
Indicators as benchmarks
This is the third time Denmark publishes indicators for sustainable development. The indicators for 2004 show that, in a number of areas, Denmark is on the right track with its work towards more sustainable
development. For example, the increasing rate of economic growth has been decoupled from energy consumption, and the number of products with ecolabels is rising. In other areas, developments continue
to present challenges. For example, emissions of greenhouse gases from the transport sector and the industrial sectors must still be reduced, and work to classify chemicals must be further intensified.
Annual updates will maintain focus
The original indicators were prepared up to the World Summit on Sustainable Development in Johannesburg in 2002. The indicators have been selected in order to reflect objectives and activities in
Denmark's National Strategy for Sustainable Development, "A shared future – balanced development". The annual updates of the indicators are an important element in ongoing reporting, and they show
trends in developments and results compared with the overall objectives and principles of the strategy. The results are used to make regular adjustments to objectives and initiatives in work for sustainable
development.
Set of indicators in two parts
This publication presents an overall set of key indicators which describes developments and results in relation to the Strategy's eight overall objectives and principles. This year, the set comprises 13
indicators.
There is a detailed set of indicators with 88 indicators, describing developments and results in relation to some of the Strategy objectives and activities for each action area. These are available on
www.mst.dk/indikator/bu/ default.asp?sprogid=2
Indicators are used internationally
Indicators are increasingly being used and developed as a tool for decision-makers and the general population at international, regional, and local levels. Some of the most important players at the
international level are: the OECD, the UN Commission on Sustainable Development (CSD), and the European Commission (Eurostat and the European Environment Agency).
Other important actors in the development of indicators for sustainable development include the World Bank, the World Resources Institute, the Worldwatch Institute, the Baltic 21 Institute for Sustainable
Industry, the Nordic Council of Ministers, and a number of NGOs.
The Danish set of indicators has been inspired by the international indicator set, which means it is possible to compare developments in Denmark with developments in other countries. However, the Danish
Government places great importance on Denmark having its own set of indicators linked to the Danish Strategy for Sustainable Development.
What are indicators for sustainable development?
The indicators for sustainable development contain information in a less detailed and often a more aggregate form than data and statistics. Well-known examples of indicators for developments in society are:
- Gross domestic product
- Rate of unemployment
As regards the environment, one indicator could be the application frequency, which can be used to describe the impact of pesticides on the environment. Indicators for sustainable development are wider in
scope than traditional indicators. For example, they focus on:
- Consumption
- Resources
- Decoupling the link between growth and environmental impacts
Trends 2003-2004
The Danish vision of sustainable development is based on eight objectives and principles:
- The welfare society must be developed and economic growth must be decoupled from environmental impacts
- There must be a safe and healthy environment for everyone, and we must maintain a high level of protection
- We must secure a high degree of biodiversity and protect ecosystems
- Resources must be used more efficiently
- We must take action at international level
- Environmental considerations must be taken into account in all sectors
- The market must support sustainable development
- Sustainable development is a shared responsibility and progress must be measured
The 13 key indicators in this publication have been selected to sketch out an overall picture of developments and results for each of the eight objectives. The eight objectives and developments in the
associated indicators are described very briefly below.
1. The welfare society must be developed and economic growth must be decoupled from environmental impacts
Danish economic development remains stable. From 1990 to 2003, GDP per
capita grew by approximately 24 per cent. This corresponds to an average rate of increase of approximately 1.7 per cent per year. Within a number of areas, the link between economic growth and
consumption of resources has been successfully decoupled, eg. for emissions of greenhouse gases and acidifying substances.
Society's "Genuine Savings" (ie. the value of economic, social and environmental resources) have been increasing since 1994, and amount to between 4 and 7 per cent of GDP. However, there was a drop
between 2002 and 2003 due to a smaller contribution from savings in human capital (because of a new method of calculation).
With regard to employment, over the past 10 years this has increased by almost 200,000 persons. It is important to maintain the growth in employment in order to underpin the Government's growth
strategy, but this can be difficult because, looking at the change in population in isolation, the workforce will fall in the years to come. Generally speaking, things are moving in the right direction with regard to
welfare developments, while at the same time not impacting the environment.
Overall, the decoupling between growth and environmental impacts is on track in a number of areas.
2. There must be a safe and healthy environment for everyone, and we must maintain a high level of protection
With regard to the health of Danes, both men and women are living for much longer
than they have previously. The average life expectancy of Danish men has gone up from
70.3 years in 1960 to 74.9 years in 2003, while on average in 1960 women lived for 74.1 years compared to 79.5 years in 2003.
Another aspect that illustrates the relationship between environment and health is Danish emissions of greenhouse gases. In 2002 the total emissions corresponded to slightly less than 1990 levels, after having peaked in 1996. Emissions from agriculture, households and the waste sector have fallen, while emissions from the transport and industrial sectors have increased.
Another important component in work carried out to ensure a healthy and safe environment is the classification of chemicals. The number of classified substances has more than doubled since 1993. At the
end of 2004, approximately 8,000 substances had been classified out of the total of 100,000 substances available on the European market; 1,000 more than last year.
These indicators show that work is taking place for a safe and healthy environment for all. However, great challenges remain, eg. to reduce the emissions of greenhouse gases from the transport and industrial
sectors, which are still far too high. A large proportion of the many thousand chemicals in society still need to be examined.
3. We must secure a high degree of biodiversity and protect the ecosystems
Since 1950, the forest area in Denmark has been stead
ily increasing. This harmonises well with the objective to increase the extent of Danish woodland areas so that forests cover 20-25 per cent of Denmark. The area of original forest has fallen, while the area of
deciduous forest is now once again rising, after having fallen for some time. The efforts to increase the area of the open natural habitats: meadow, dry grassland, and heath have not had any discernable
impact in the latest inventories. Meeting the objective of a high degree of biodiversity and protection of ecosystems will be a long and hard haul, and this must be continued.
4. Resources must be used more efficiently
Danish resource consumption compared with grown in GDP varies with regard to energy, drinking water and waste. Things are moving in the right direction for all three factors. The growth in waste arisings
since 1999 has corresponded to the growth in GDP. Consumption of drinking water fell considerably from 1993 to 2003 by about 30 per cent, while energy consumption has fallen relative to 1996, but with
a slight increase from 2001. There has been a relative decoupling
of energy and drinking water consumption, as well as waste arisings, from economic growth, and this indicates that resources are being exploited better.
5. We must take action at international level
During the period 1992 to 2003, Denmark contributed international assistance of approximately 1 per cent of its GNI every year, which is far more than the UN target of 0.7 per cent of GNI. In 2003,
Danish environment assistance amounted to about 0.07 per cent of GNI, and it has been rising since 1998. Therefore Denmark is meeting the UN international development target and contributing to the
objective of combating poverty globally. On the basis of these indicators, Denmark is making active international efforts.
6. Environmental considerations must be taken into account in all sectors
Despite economic growth in society, energy consumption has only increased marginally. The decoupling of energy consumption and emissions from economic growth is the result of a significant drop in
energy intensity.
The reduction in the relative CO2 emissions over the 1990s and up to the present is partly due to the use of natural gas and renewable energy. From 1990 to 2002, CO2 emissions fell by 86 per cent, and in 2002 emissions of NOx were 29 per cent lower than in 1990.
In the energy area, efforts to integrate environmental considerations have been successful, but in many other areas, Danish emissions of greenhouse gases still need to be reduced so that the average level of
emissions in the years 2008-2012 is 21 per cent lower than the annual emissions in 1990.
7. The market must support sustainable development
The number of ecolabelled products increased steadily from 1998 to 2004, both for the Nordic Swan label and the EU Flower label. In particular, the Flower is making good progress. In 1999, only two
products carried the Flower label, in 2004 this figure had risen to 210.
The increase shows that there is a market for ecolabelled products, and this may help support sustainable development.
8. Sustainable development is a shared responsibility and progress must be measured
Since 1994, the number of enterprises with certified environmental management systems in the form of EMAS and ISO 14001 has increased year by year. Denmark is one of the European countries with the
greatest number of EMAS registered enterprises in relation to the size of the population.
The positive development in the number of EMAS and ISO 14001 registered enterprises shows that it is possible to compete on the basis of environmental initiatives, and that we can promote work to make
sustainable development a shared responsibility.
1
Gross domestic product per capita
Source: Statistics Denmark
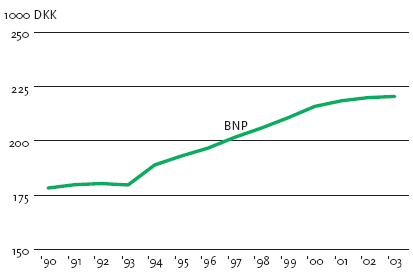
This indicator illustrates Denmark's economic development. The figure shows the gross domestic product at constant 1995 prices per capita during the period 1990 to 2003. The use of constant prices
means that account has been taken of changes in prices, which in turn means that these figures reflect the actual development of production in Denmark.
From 1990 to 1993, production per capita was approximately DKK 180,000. From 1990 to 2003, GDP per capita grew by approximately 24 per cent. This corresponds to an average rate of increase of
approximately 1.7 per cent per year. In 2003, GDP per capita was DKK 220,546.
Decoupling growth from resource consumption
It is expected that GDP will continue to rise. Therefore, a crucial objective is to decouple economic development from increasing pressure on resources. Within a number of areas, the link between economic
growth and increased pollution has been successfully decoupled. Even so, great challenges remain within other areas that are important to health, nature, and the environment. The increase in GDP per capita
indicates growing wealth. This improves the opportunities for ensuring sustainable development in future. For example, through greater savings and more investment in cleaner technology.
2
Decoupling illustrated by environmental impacts for 4 factors (greenhouse gases, runoffs of nutrients into the sea, emissions of acidifying substances and emissions to air) in relation to
GDP
Source: The National Environmental Research Institute, Denmark; Statistics Denmark
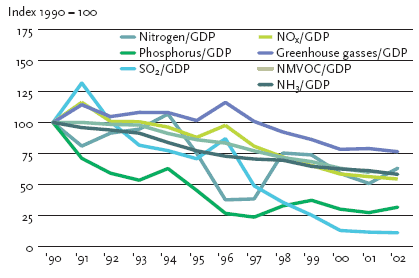
This indictor illustrates developments in relation to the objective of decoupling economic growth from impacts on the environment. The figure shows the development in emissions of greenhouse gases, runoffs
of nutrients into the sea (N and P), and emissions of acidifying substances (SO2 and NH3) as well as emissions to air (NOx and NMVOC) in relation to GDP.
Signs of decoupling economic growth from environmental impacts
Nitrogen and phosphorus additions have fallen since 1990. However, considerably increased water runoffs from 1997 to 1999 caused greater nutrient inputs during that period. Emissions of greenhouse
gases fell slightly during the period 1990 to 2002. Emissions of acidifying substances fell considerably, however, most significantly with regard to emissions of sulphur. At the same time, GDP has increased
steadily since 1993, indicating that economic growth and environmental impacts have been decoupled. Besides the emissions of NMVOC caused by humans, there are several other NMVOC sources.
Therefore, the total impact on the environment from NMVOC is greater than the impact illustrated in the figure.
Generally speaking, developments within selected parameters are headed in the right direction in relation to the objective of decoupling growth and environmental impacts.
3
Genuine Savings
Source: The Ministry of Finance
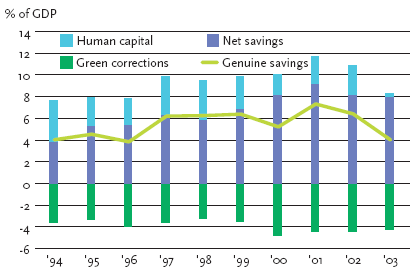
"Genuine Savings" is an economic indicator for developments in the total wealth of society. This means that the concept is used to determine the value of economic, social and environmental resources. The
"Genuine Savings" indicator covers the financial net savings (i.e. savings less depreciation) plus savings in terms of human capital (e.g. in the form of training at workplaces), less the use of natural resources
(oil and gas reserves) and the negative effects of emissions of greenhouse gases and a number of pollutants. All of these elements are assigned a monetary value. However, these "green corrections" only
incorporate the effects on nature and environment to which a monetary value can be assigned. This means that a number of effects are not included in the scope of this indicator.
The total wealth of society is increasing
"Genuine Savings" have been positive since 1994, and they have amounted to between 4 and 7 per cent of GDP each year. No calculations for this indicator can be made for before 1994. The main reason
that the green corrections increased in 2000 is primarily the higher price assigned to extraction of oil and gas from the North Sea due to the increases in the price of crude oil. This factor is, however, more or
less cancelled out by increasing economic net savings. The decrease in "Genuine Savings" from 2002 to 2003 is due to a drop in the contribution from savings in human capital as the method of calculating
the workforce statistics has been changed.
The objective is to maintain positive "Genuine Savings", so that the economic net savings and the savings in terms of human capital together exceed the value of the green corrections. The "Genuine Savings"
indicator is still being developed, and it must be supplemented by analyses of what constitutes critical impacts on health, nature, and the environment.
4
Employment analysed by age group
Source: The OECD, Employment Outlook
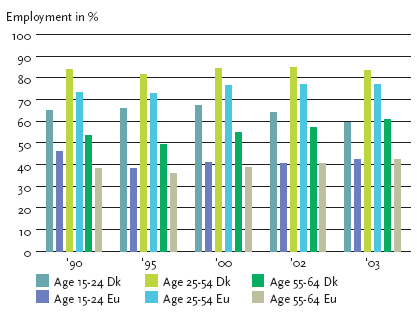
This indicator illustrates economic and social aspects of sustainable development. In an international context, Denmark is characterised by having a very high rate of
employment.
Over the past 10 years, employment has risen by almost 200,000. Increasing employment is important in order to ensure economic growth and a sustainable fiscal policy, which means Denmark has a
surplus on public finances that can cope with the increases in expenditure arising from an aging population without having to tighten economic policy. Increased employment is also an important contribution
towards realising the objectives of the Government's growth strategy.
More people at work to secure growth
In order to realise the Government's economic policy strategy, employment must rise by 60,000 from 2003 to 2010. At its meetings in Lisbon and Stockholm, the European Council established ambitious
targets for employment rates within the EU up until 2010. The targets are an employment rate close to 70 per cent of the population of working age, more than 60 per cent for women, and 50 per cent for
the 55 to 64 year-old age bracket. Denmark already meets these objectives, but has, as was mentioned above, established higher national objectives for even greater increases in the employment rate.
Therefore, a significant growth in employment is an ambitious goal. The challenge becomes even greater in view of the fact that demographic developments will, all other things being equal, reduce the size of
the workforce in the years to come.
5
Average life expectancy (analysed between men and women)
Source: Statistics Denmark
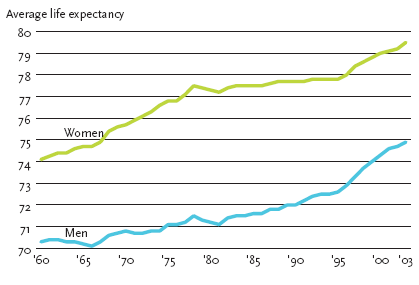
This indicator illustrates aspects of the state of health in Denmark. The average life expectancy of Danish men went up from 70.3 years in 1960 to 74.9 years in 2003. The average life expectancy of women
rose from 74.1 years in 1960 to 79.5 years in 2003. Men added 2 years to their average life expectancy from 1995 to 2003, while the corresponding increase for women was 1.4 years. Over the last eight
years, the average life expectancy has increased as much as it did during the preceding 21 years.
Both men and women are living considerably longer
The increase has been so great that in 2000, the average life expectancy of Danish men corresponded to the target figure for 2004. In 2000, women's life expectancy was as high as the 2002 target figure.
Only three other EU Member States have experienced greater increases in the average life expectancy since 1995.
6
Gross emissions of greenhouse gasses analysed between industry, transport, households, agriculture, and waste
Source: The National Environmental Research Institute, Denmark
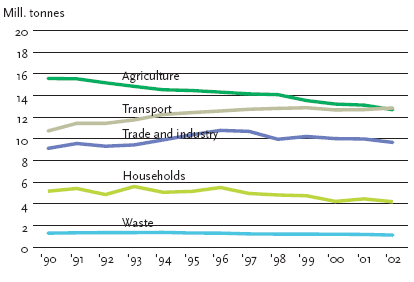
This indicator illustrates the emissions of greenhouse gases from Danish sectors. Denmark's base year under the Kyoto Protocol comprises the 1990 emissions of CO2, N2O, and CH4 as well the 1995
emissions of HFCs, PFCs, and SF6.
In 2002, total emissions corresponded to slightly less than 1990 levels, after having peaked in 1996. Emissions from the transport sector grew by 20 per cent. Emissions from agriculture fell by approximately
18 per cent, which is mainly due to the implementation of the Action Plans for the Aquatic Environment. These plans have served to reduce nitrogen emissions, thereby also reducing nitrous oxide emissions.
Emissions from industry have increased by 6 per cent, which is partly due to greater energy consumption, and partly due to the increasing use of HFCs as a refrigerant as an alternative to refrigerants which
deplete the ozone layer.
Differences between emissions of greenhouse gases from different sectors
Emissions from households fell by approximately 19 per cent, which is mainly due to more efficient energy consumption and the conversion of individual heating systems using oil to systems which use natural
gas, or to district heating. Emissions from the waste sector, which in this context extends
only to methane emissions from landfills, fell by around 14 per cent. This is mainly due to the 1997 ban on landfilling combustible waste as well as the increasing collection of methane from landfills for energy
purposes.
The objective is that the use of all greenhouse gases should be reduced in the most cost-effective manner possible. As the figure shows, there is a particular need to reduce emissions from the transport sector
and industry.
7
Number of chemicals which have been classified
Source: The National Environmental Research Institute, Denmark
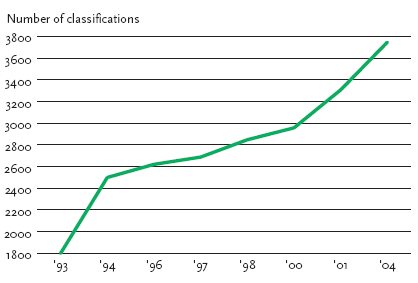
The figure illustrates developments in common EU classifications of substances and substance groups. Classification is an integral part of the overall work undertaken to assess and regulate chemical
substances. Common EU classification creates a basis for common risk management, including bans on the sale of substances and products which are carcinogenic, mutagenic, or hazardous to embryos. The
figure does not include substances which have been self-classified by manufacturers.
Classifications increase in steps
The figure shows that the number of classified substances and related substances has more than doubled since 1993. The substances and substance groups classified at the end of 2004 comprise 8,000
substances of the total of 100,000 substances available on the European market, either now or
in the past. The number of completed classifications is subject to sudden increases, as a large number of classifications are completed at the same time. In 2004, a total of 450 substances were classified. A
new, updated Danish list of these substances will be published in spring 2005. The work is still in progress.
The increased number of common EU classifications underpins the objective that the use of hazardous chemicals must be limited and even banned, if there are harmful effects on human and animal health or
on nature. However, there is still a long way to go with the many thousands of chemicals we use every day.
8
Area of natural habitats (deciduous forest, original forest)
Source: Nature and Environment – Selected Indicators 2001
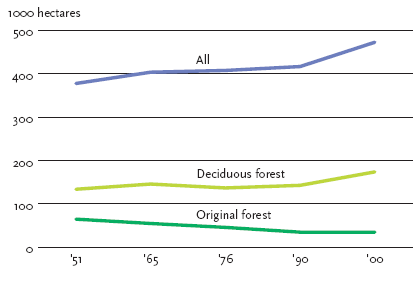
This indicator illustrates developments in relation to the objective of securing a high degree of biodiversity and protecting ecosystems. Figure 8a shows developments from 1950 to 2000 as regards the area
of original forest, deciduous forest, and total forest. Figure 8b shows the development during the period 1950 to 2000 for meadows, marshes, moors and dry grasslands. The data for the indicator is not
calculated in the same way any longer, and therefore it will not possible to show more recent figures until early 2005, when new calculations will be ready.
Original forests are under pressure
From 1950 to 2000, the total forest area increased steadily, whereas the area of deciduous forest only changed relatively slightly. We also see that the area of original forest has fallen. The difference
between the total area and the deciduous area mainly comprises imported conifers (particularly common spruce). Figure 8b shows that all three of the open natural habitats dwindled in extent during the period 1950 to 2000. Indeed, the
total area of the three types of natural habitat covered only half as much land in 2000 as it did in 1950.
8a
Area of natural habitats (meadow, dry grassland, moor, and marshland)
Source: Nature and Environment – Selected Indicators 2001
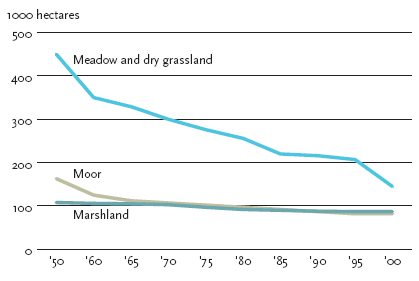
One objective is to increase the extent of Danish woodland areas so that forests cover 20-25 per cent of the area of Denmark. At the same time, the aim is to increase the area of deciduous forest and retain
the area of original forest. The latest inventories show that the area of deciduous forest is once again rising. It is also aimed to increase the area accounted for by the open natural habitats: meadows, dry
grasslands, and moors. This has not, however, had a discernible impact in the most recent calculations.
9
Resource flows for 3 factors (energy consumption, drinking water consumption, waste) in relation to GDP
Source: The National Environmental Research Institute, Denmark; the Danish Energy Authority; Geological Survey of Denmark and Greenland
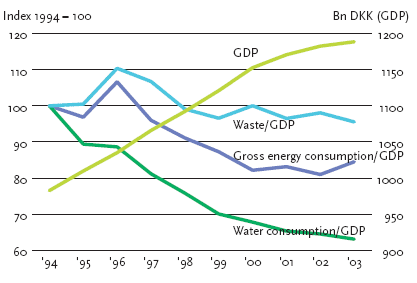
The figure shows the correlation between developments within selected consumption patterns, total waste volume, and economic growth. The aim is to illustrate whether resources can be used better.
Waste volumes fell during the period 1996 to 1999. This means that the waste intensity (waste generation in relation to GDP) also fell during the same period and it has since remained more or less stable.
Since 1999, the growth in waste arisings has generally corresponded to the growth in GDP. Following a dramatic increase from 1995-96, energy consumption has fallen, but with a slight rise from 2002. In
the period 1993 to 2003, consumption of drinking water fell significantly by about 30 per cent. At the same time, GDP grew steadily.
Resource consumption has been decoupled from growth in GDP
A relative decoupling of energy consumption has taken place, and an absolute decoupling of consumption of drinking water from economic growth during the period 1996 to 2003. The relative decoupling
between waste volumes and economic growth is primarily the result of a reduction in waste volumes from power plants and the building and construction sector. If these two sectors are excluded from the
calculations, the waste volume grew from 1997 to 1998.
10
Assistance funds as a percentage of GNI, in total and analysed between development and environmental assistance, and assistance to neighbouring countries
Source: The Ministry for Foreign Affairs and the Environmental Protection Agency
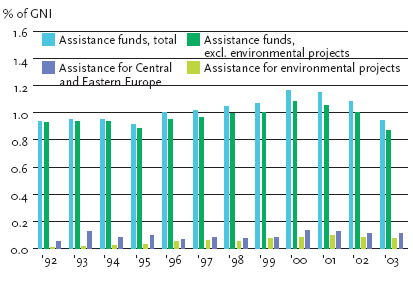
The indicator illustrates Denmark's international work within the assistance area and has been calculated in accordance with the rules applied by the OECD development committee, the DAC. Therefore, the
indicator shows development assistance as a percentage of GNI, as well as environmental projects in developing countries and other development assistance (total assistance excluding environmental
projects) as a percentage of GNI. Finally, the figure shows the total assistance to Central and Eastern Europe (including environmental assistance to Central and Eastern Europe) analysed by consumption as
a percentage of GNI.
Danish environmental assistance exceeds UN target
During the period 1992 to 2003, the rate of Danish international assistance far exceeded the UN target of 0.7 per cent of GNI. In 2003, environmental projects in developing countries accounted for about
0.07 per cent of GNI and thus maintained the same relative level they have had since 1999. In 2003 Denmark achieved the second highest international ODA percentage. Denmark's extensive international
assistance is based on combating poverty and promoting sustainable development and it underpins the UN international development targets for 2015.
11
The environmental profile of the energy sector, illustrated by energy consumption and emissions relative to GDP
Source: The Ministry for Foreign Affairs and the Environmental Protection Agency
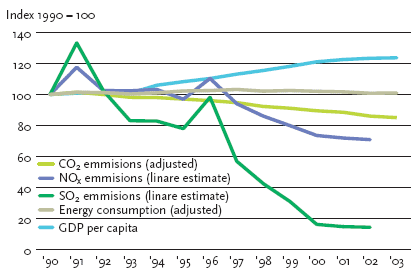
This indicator illustrates developments in relation to the objective of accounting for environmental considerations in all sectors. The indictor shows the emissions of greenhouse gases and acidifying substances
from the energy sector. The energy sector almost exclusively emits the greenhouse gas CO2, and this accounts for more than 45 per cent of Denmark's total emissions of greenhouse gases. In total, energy
consumption accounts for almost 80 per cent
of Danish emissions of greenhouse gases. The sector is also behind the most significant emissions of acidifying substances, e.g. SO2.
Economic growth without increasing energy consumption
Since 1990, adjusted gross energy consumption has grown only marginally. Economic growth has not caused a corresponding increase in energy consumption. This is due to a significant drop in energy
intensity (defined as the gross energy consumption per DKK million GDP). The adjusted CO2 emissions arising from energy use in 2003 have been established at 51.8 million tonnes, compared with 52.4
million tonnes in 2002, corresponding to a drop of 1.2 per cent. In relation to 1990, the reduction was 14.9 per cent. During the period 1990-2002, SO2 emissions from the energy sector fell by 86 per
cent, and in 2002, emissions of NOx from the energy sector were 29 per cent lower than in 1990. Among other things, the reduction in CO2 emissions during the 1990s was brought about by greater use of
natural gas and renewable energy. More efficient use of combined heat and power has also reduced CO2 emissions.
Reductions in Danish emissions of all greenhouse gases must continue so that the average level of emissions in the years 2008-2012 is 21 per cent lower than the annual emissions in 1990. Overall energy
consumption has increased by 6.7 per cent since 1990, while emissions have increased by just less than 3 per cent. The energy produced is used in a more efficient manner. SO2 emissions have been
decoupled from economic growth, particularly due to flue gas cleaning and less sulphurous fuels. The target for reducing SO2 emissions was reached in 1998.
12
Number of ecolabelled products
Source: Eco-labelling Denmark
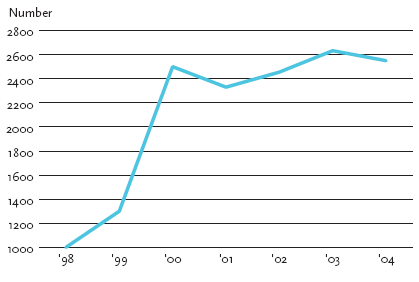
This indicator illustrates developments in the number of ecolabelled products on the market. The figures cover Swan-labelled and Flower-labelled products. A manufacturer can sell more than one product
under the same license, because, for instance, the same products are sold via different retailers. Some products under the same license can be very similar technically, but they may be used differently and
therefore have different trade names, for example paints for either walls or ceilings, and small or large batteries.
More products are carrying the Flower
The number of ecolabelled products increased steadily from 1998 to 2004. The most common ecolabel is the Swan label, but the Flower is making good progress. In 1999, only two products bore the
Flower, in 2000 seven, and in 2004 the Flower was on 10 per cent of the ecolabelled products on the market. The increase in the number of Flower-labelled products started accelerating in earnest with the
ecolabel campaign launched in 2001. With the large Flower campaign in October 2004, 210 products are now on the market. The fall in the number of products from 2000 to 2001 was due to a fall in
Swanlabel licenses for printing paper as a result of big manufacturers no longer finding such licenses worthwhile.
The general increase in the number of ecolabelled products available shows that there is a market for green products, and that the market can be used to support sustainable development.
13
Number of EMAS and ISO 14001 registered enterprises
Source: The Danish Environmental Protection Agency
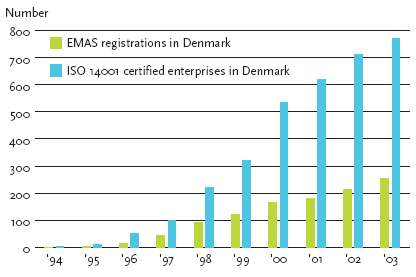
This indicator has been chosen to illustrate developments in the ability of enterprises to use their environmental efforts as a competitive parameter. The EMAS (Eco-Management and Audit Scheme) is the
common European scheme for environmental management and environmental auditing. ISO 14001, which replaced BS 7750 in 1996, is the international standard for environmental management. The figures
are cumulative and show the number of EMAS registered plants and ISO 14001 certified enterprises in Denmark. Many EMAS registered enterprises are also ISO 14001 certified.
More companies are introducing environmental management
Since 1994, the number of enterprises with environmental management has gone up every year. The number of enterprises with ISO 14001 went up from 712 in 2002 to 771 in 2003. In the same period,
the number of EMAS registered enterprises rose from 214 to 255.
The objective is to ensure that enterprises can increasingly use their environmental efforts to give them a competitive edge. Developments in the number of EMAS registered and ISO 14001 certified
enterprises are contributing
to this end. Denmark is among the European countries with the greatest number of EMAS registered enterprises compared to the size of the population. Developments in the number of EMAS and ISO
14001 enterprises show that it is possible to use environmental performance as a competitive parameter.
| Top | | Front page |
Version 1.0 May 2005, © Danish Environmental Protection Agency
|


