|
| Front page | | Contents | | Previous | | Next |
Key indicators 2004
1
Gross domestic product per capita
Source: Statistics Denmark
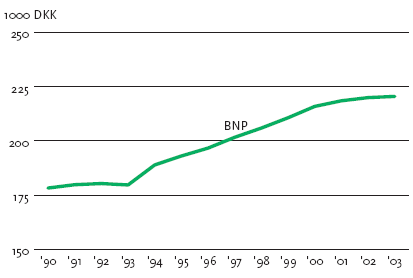
This indicator illustrates Denmark's economic development. The figure shows the gross domestic product at constant 1995 prices per capita during the period 1990 to 2003. The use of constant prices
means that account has been taken of changes in prices, which in turn means that these figures reflect the actual development of production in Denmark.
From 1990 to 1993, production per capita was approximately DKK 180,000. From 1990 to 2003, GDP per capita grew by approximately 24 per cent. This corresponds to an average rate of increase of
approximately 1.7 per cent per year. In 2003, GDP per capita was DKK 220,546.
Decoupling growth from resource consumption
It is expected that GDP will continue to rise. Therefore, a crucial objective is to decouple economic development from increasing pressure on resources. Within a number of areas, the link between economic
growth and increased pollution has been successfully decoupled. Even so, great challenges remain within other areas that are important to health, nature, and the environment. The increase in GDP per capita
indicates growing wealth. This improves the opportunities for ensuring sustainable development in future. For example, through greater savings and more investment in cleaner technology.
| Front page | | Contents | | Previous | | Next | | Top |
Version 1.0 May 2005, © Danish Environmental Protection Agency
|