|
| Front page | | Contents | | Previous | | Next |
Key indicators 2004
6
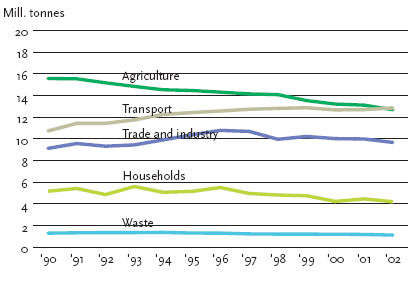
Gross emissions of greenhouse gasses analysed between industry, transport, households, agriculture, and waste
Source: The National Environmental Research Institute, Denmark

This indicator illustrates the emissions of greenhouse gases from Danish sectors. Denmark's base year under the Kyoto Protocol comprises the 1990 emissions of CO2, N2O, and CH4 as well the 1995
emissions of HFCs, PFCs, and SF6.
In 2002, total emissions corresponded to slightly less than 1990 levels, after having peaked in 1996. Emissions from the transport sector grew by 20 per cent. Emissions from agriculture fell by approximately
18 per cent, which is mainly due to the implementation of the Action Plans for the Aquatic Environment. These plans have served to reduce nitrogen emissions, thereby also reducing nitrous oxide emissions.
Emissions from industry have increased by 6 per cent, which is partly due to greater energy consumption, and partly due to the increasing use of HFCs as a refrigerant as an alternative to refrigerants which
deplete the ozone layer.
Differences between emissions of greenhouse gases from different sectors
Emissions from households fell by approximately 19 per cent, which is mainly due to more efficient energy consumption and the conversion of individual heating systems using oil to systems which use natural
gas, or to district heating. Emissions from the waste sector, which in this context extends
only to methane emissions from landfills, fell by around 14 per cent. This is mainly due to the 1997 ban on landfilling combustible waste as well as the increasing collection of methane from landfills for energy
purposes.
The objective is that the use of all greenhouse gases should be reduced in the most cost-effective manner possible. As the figure shows, there is a particular need to reduce emissions from the transport sector
and industry.
| Front page | | Contents | | Previous | | Next | | Top |
Version 1.0 May 2005, © Danish Environmental Protection Agency
|