|
| Front page | | Contents | | Previous | | Next |
Key indicators 2004
9
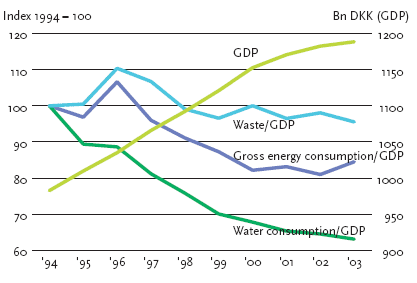
Resource flows for 3 factors (energy consumption, drinking water consumption, waste) in relation to GDP
Source: The National Environmental Research Institute, Denmark; the Danish Energy Authority; Geological Survey of Denmark and Greenland

The figure shows the correlation between developments within selected consumption patterns, total waste volume, and economic growth. The aim is to illustrate whether resources can be used better.
Waste volumes fell during the period 1996 to 1999. This means that the waste intensity (waste generation in relation to GDP) also fell during the same period and it has since remained more or less stable.
Since 1999, the growth in waste arisings has generally corresponded to the growth in GDP. Following a dramatic increase from 1995-96, energy consumption has fallen, but with a slight rise from 2002. In
the period 1993 to 2003, consumption of drinking water fell significantly by about 30 per cent. At the same time, GDP grew steadily.
Resource consumption has been decoupled from growth in GDP
A relative decoupling of energy consumption has taken place, and an absolute decoupling of consumption of drinking water from economic growth during the period 1996 to 2003. The relative decoupling
between waste volumes and economic growth is primarily the result of a reduction in waste volumes from power plants and the building and construction sector. If these two sectors are excluded from the
calculations, the waste volume grew from 1997 to 1998.
| Front page | | Contents | | Previous | | Next | | Top |
Version 1.0 May 2005, © Danish Environmental Protection Agency
|