|
| Front page | | Contents | | Back | | Printing instructions |
Survey of Estrogenic Activity in the Danish Aquatic Environment
| Wastewater treatment plants |
Pollution sources in the open land |
Aquatic environment |
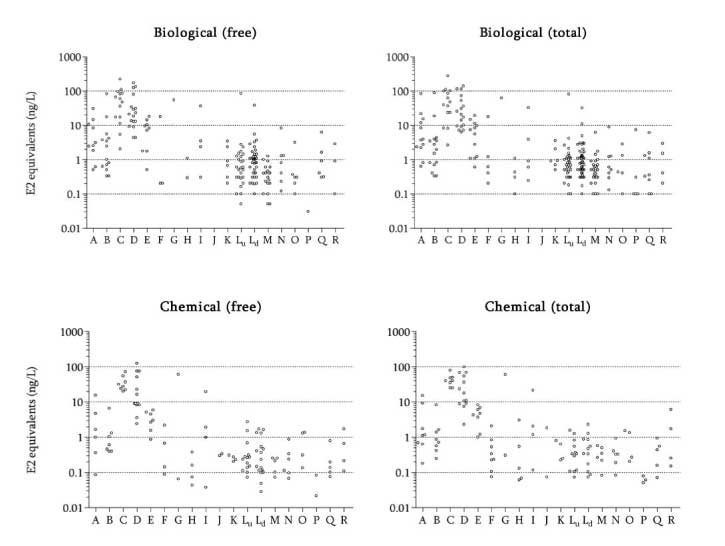
A. MBND/MBNDC*
B. MBN/MBNC*
C. MB/MBC*
D. M/MC*
E. Reed beds
F. Biological sand filters |
G. Effluents from isolated houses
H. Drains from manure treated fields
I. Drains from sludge amended fields
J. Separate stormwater runoff
K. Fish farms |
L. Streams/rivers, up/down WWTPs (Lu and Ld, respectively)
M. Streams/rivers, general
N. Streams/rivers in husbandry areas
O. Lakes in husbandry areas
P. Reference streams (background)
Q. Reference lakes (background)
R. Lakes, general |
* M - mechanical; B = Biological; N = Nitrification; D = Denitrification; C = Chemical
Figure 5.1 A-D Presentation of all bioassay and chemical results above the limit of detection for determination of the free and total concentration of estrogens.
| Front page | | Contents | | Back | | Printing instructions |
Version 1.0 Januar 2005, © Danish Environmental Protection Agency
|