|
| Front page | | Contents | | Back | | Printing instructions |
Survey of Estrogenic Activity in the Danish Aquatic Environment

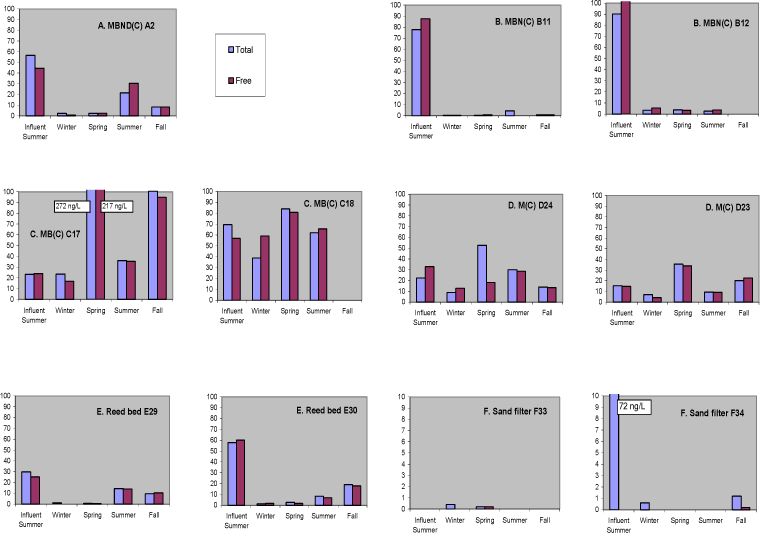
Figure 6.6 Bar diagrams of total and free estrogenic activity (ng E2 equiv./L) in WWTP samples with four effluent samples Taken over eight months. The influent sample was taken during the third sampling (summer) and is shown first in each panel (A-1 is not shown as no estrogenic activity was detected in any sample. The influent to F-33 was not possible to sample).
| Front page | | Contents | | Back | | Printing instructions |
Version 1.0 Januar 2005, © Danish Environmental Protection Agency
|