|
Survey of Estrogenic Activity in the Danish Aquatic Environment 7 State of the environment7.1 Overall results 7.1 Overall resultsThe overall results from the sampling in streams and lakes of different categories are shown in Table 7.1 and presented graphically in Figure 7.1. The division of the streams and lakes into sub-categories is explained in Section 2.2.3 but one additional comment should be given here. For the purpose of the overview tables (Table 7.1 and 7.2), the anticipated 'generally exposed' upstream samples from streams/rivers receiving WWTP effluents (Cat. L) have been added to the data from the generally exposed/affected streams/rivers category (Cat. M). The cases chosen were those where the discharge points were situated outside urban areas. The remaining upstream L-samples from WWTPs in urban areas have been given their own sub-category in Table 7.1 and 7.2, called Lu(U) (lower case "u" for upstream, upper case "U" for urban). It should be borne in mind when directly comparing the median levels between categories, that they are based only on the detected levels, which in the case of a significant number of non-detects will lead to conservative estimates of median values. E.g. if samples below detection limit were given the value zero in category M the median would shift towards 0.35 from presently 0.5 ng/L. The non-detects are, however, included in the graphical presentation of results in Figure 7.1. Table 7.1 Estrogenic activity of free and total estrogens in various sub-categories of the aquatic environment in Denmark.
* The results from one location - 84 and 80 ng/L for free and total estrogens, respectively - were discarded as artefacts.
Figure 7.1 Distribution of samples between ranges of total estrogenic activity in the categories M-P from the aquatic environment. Based on results from total estrogenic activity measured in the YES assay. Table 7.2 Free and total estrogenic activity in various sub-categories of the aquatic environment in Denmark.
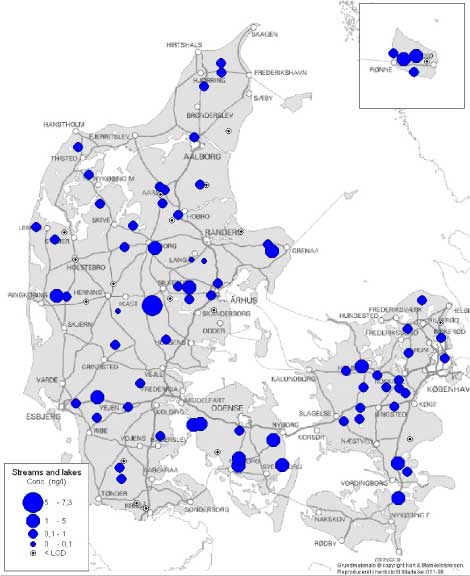
In all sub-categories of freshwater aquatic environments the median levels of total estrogenic activity as measured by the YEs assay are below or at 1 ng/L and, overall, in about one third of the samples the level is below the limit of detection. Reference streams have the lowest level of all categories while samples from reference lakes are found to exhibit estrogenic activity at or near the same level as that of presumably more affected lakes. The origin of the observed estrogenicity in the reference lakes (e.g. from phyto-estrogens) has not been investigated. The "hit rate" i.e. the number of samples with quantifiable estrogenicity compared to the total number of samples is slightly higher in categories N and O (streams and lakes in areas with high density of cattle/pigs) than in the other sub-categories. In the M, P, Q and R categories the number of samples without detectable estrogenic activity constitute from 25% to more than 50% of the samples. Thus, 'clean' samples are prominent in surface waters, and in particular in the P and R categories (reference streams and generally exposed lakes, respectively). The highest level of total estrogenicity detected is 8.2 and 8.8 ng/L for free and total estrogens, respectively. Both findings originate from the same sample from a stream on the island of Funen. It should be added, however, that the other sample taken in the same stream only showed an estrogenicity level of 0.4 ng/L (for both free and total estrogens). The chemical species found ot the aquatic environment was typically E1 and rarely E2. In one case EE2 was also found in the aquatic environment. The considerable EE2 concentration of 3.7 ng/L, for which no explanation can be given at present, was measured in a sample from a "generally exposed" lake (Cat. R). 7.2 Geographical distributionThe data on total estrogenic activity (YES assay) in all categories of streams and lakes and their geographical distribution throughout Denmark are illustrated in Figure 7.2. The data give no indications of systematic regional differences due to geological conditions or differences in land use at the macro-level, except maybe for a slight indication of generally higher estrogenicity levels in the streams and lakes of the island of Funen.
Figure 7.2 Overview of total estrogenic activity in Danish streams and lakes. For the locations where more than one sample have been taken, the mean concentration has been used for the map. Levels given in ng E2 equiv./L. 7.3 Seasonal/temporal variationThe seasonal variation of estrogenic activity in the aquatic environment is shown in Table 7.3 for the categories with detection of estrogenic activity in at least one sample. Samples were taken in "pairs" at each location i.e. either "winter-summer" or "spring-fall". Table 7.3 Number of samples displaying difference in free and total estrogenic activity during the season is shown with indication of time of highest level.
In general., no systematic pattern of seasonal variation is evident for the spring-fall samples, but in the winter-summer sample pairs the summer samples appear to display higher estrogenic activity. In 13 of the cases the difference between the two seasonal samples are below 0.5 ng/L, which, in consideration of the RSD of 29%, should be interpreted as a non-significant difference. The pattern for free estrogenic activity was almost similar. In the category for diffusely polluted streams (M) the data set is shown in Table 7.4 with mean and standard deviation calculated for two seasons. Table 7.4 Seasonal variation in YES assays estrogenic activity in samples from category M, generally exposed streams. M1 samples are Winter/spring and M2 are Summer/fall.
A tentative interpretation, given the fact that the total activities are equal in early and later samples, could be that the proportion of free estrogens are higher in the summer/fall samples than in winter/spring samples.
|
|||||||||||||||||||||||||||||||||||||||||||||||||||||||||||||||||||||||||||||||||||||||||||||||||||||||||||||||||||||||||||||||||||||||||||||||||||||||||||||||||||||||||||||||||||||||||||||||||||||||||||||||||||||||||||||||||||||||||||||||||||||||||||||||||||||||||||||||||||||