|
Environmental Project no. 980, 2005 Prioritisation within The Integrated Product PolicyContents1 Environmental impact of product groups
3 Danish LCA normalisation data for year 1999 4 New product groups for environmental labels
6 Detailed analysis of four specific areas
Annex A. Produktgruppernes navne på dansk PrefaceProject objectives and target groups Project objectives and target groupsThe main objectives of the project was to:
In addition, the project has:
The primary target group of the project is decision makers in ministries and business organisations that are going to prioritise and organise future product-oriented activities. The project furthermore provides data and tools applicable for everyone who performs lifecycle assessments of products produced and/or used in Denmark. Project organisationThe project has been carried out by a project group from:
Bo Weidema, 2.-0 LCA consultants, has acted as project manager. Niels Frees from the Danish LCA Centre has contributed to Chapter 7. An advisory expert group, with participation of
has, as part of the project, participated in an International Invitational Expert Seminar (Nielsen et al. 2003a), commented the model proposals from the working group in their specific areas of expertise, before their implementation, commented on the final model and the results of the preliminary prioritisations, and evaluated the project results in terms of the relevance and flexibility of the developed prioritisation model and the completeness of the delivered documentation. The project has been supervised by a reference group with participation of:
SummaryEnvironmental measures should first target food, housing, ships and electricityFood, housing, transport by ship, and electricity are the four product areas where environmental measures in Danish industry will provide most environmental improvement. Looking at the Danes' private consumption, priority areas are housing, food, tourism, clothes, personal hygiene and car driving. Public consumption generally has much less impact on the environment than private consumption, but nevertheless reach the top-10 when consumption groups are sorted according to total environmental impact. These are some of the conclusions from the project ”Prioritisation within the integrated product policy” in which a detailed method for making such prioritisations has been developed. The method is based on a combination of environmental statistics and the Danish national accounts, divided on 138 product groups. Background of the projectThe integrated product policy in Denmark has hitherto been organised as prioritised activities in selected industries and/or product areas. The basis for this prioritisation has been e.g. the results of the project "Environmental prioritisation of industrial products" (Hansen 1995a). As a first step towards an update of this, the Danish EPA initiated in 2001 a pre-project on a "Model for selection of future target areas in the Danish Program for Cleaner Products" (Schmidt et al. 2003). Also at EU level, the Commission has initiated a project (with the acronym EIPRO), which aims at identifying the products with the largest environmental improvement potentials. As a Danish contribution to this, the Danish Environmental Protection Agency has now commissioned an updated and more detailed method, which provides a well-documented decision basis for planning and selecting products for the future product-oriented activities. The method is based on a combination of environmental statistics and the Danish national accounts and is therefore easy to maintain. The method has been applied to provide prioritised lists of those product groups and industries where Danish environmental measures will give the largest environmental improvement, both for the products currently produced in Denmark (for domestic consumption or for export) and the products currently consumed in Denmark (domestically produced as well as imported). Furthermore, the project has provided a complete set of background-data for lifecycle assessment of products used and/or produced in Denmark. The intention is that these data should be part of the LCA database provided by the Danish LCA Centre. These background data can be used to fill gaps in LCAs where specific process data are missing, and will at the same time be able to serve as a sort of "backbone" in the Danish LCA-database. At the same time, the project's uncertainty analysis provides a basis for planning and prioritising future data collection for the LCA database. Project organisationThe project has been carried out from January 2003 to June 2004 by a project group under management of 2.-0 LCA consultants ApS with participation of CML (Leiden Universitet) and PRé Consultants (The Netherlands). An International seminar was hosted as part of the project. Proceedings has been separately published (Nielsen et al. 2003). Throughout the project, an associated advisory expert group has commented the method and model proposals of the project group and has assessed the project results. Main conclusionsDanish exports are responsible for approximately half of the environmental impacts caused by Danish industry (see Figure 1.2) in spite of this export contributing only half as much economic value as the Danes' own consumption (see Figure 1.1). Thus, the export is relatively environmentally intensive. Especially noticeable is the export of meat and ship transport. Food production is a major source of environmental impacts. Besides meat, we find dairy products and restaurant services among the 10 product groups with the largest environmental impact. Wholesale trade is also among the top-10 of environmental impact, mainly due to a large consumption of transport and packaging and to a lesser extent consumption of advertising and buildings. Of course, the environmental impact from wholesale trade contributes to the environmental impact of many different products, and therefore does not become visible unless ”Wholesale trade” is regarded as a ”product” in itself. This shows the importance of being able – as in this project – to analyse the environmental impacts from different perspectives, i.e. both:
Product groups with large environmental impactFrom the supply perspective, i.e. the supply from Danish production, product groups with large environmental impact are food, transport by ship and wholesale trade, as already mentioned. Furthermore we can mention dwellings, electricity and heat, and industrial cooling equipment (the only important Danish product in which ozone depleting substances is still used). In the consumption perspective, the project divides Danish consumption in 98 product groups, out of which dwelling use and heating, food, tourism, clothes, personal hygiene and car driving appear as the environmentally most important. Out of the public consumption groups it is ”General public services, public order and safety affairs” and the education sector, which has the largest environmental impact. ”General public services, public order and safety affairs” arrive among the top-10 of environmental impact mainly due to the toxic substance tributyltinoxide, which is used as anti-fouling agent on the navy ships, while also having a relatively high consumption of fuels, electricity, chartered flights and transport materiel. For the educational sector it is particularly buildings, heating and electricity that contribute to the environmental impacts. However, when comparing the environmental impact per used DKK, see Table 1.50, it becomes clear that public consumption has much smaller environmental impact intensity than private consumption. This is because public consumption includes a relatively high proportion of labour, which does not contribute with environmental impact. Depending on the impact category, one DKK used by public authorities has an environmental impact between 13% and 64% of that of one DKK used by a private Dane. A quantitative uncertainty assessment has been performed, and the prioritisation results are provided with confidence intervals. Generally, the difference between the product groups are so large that their overall position in the prioritisation (among the 10 most important, among the 20 most important etc.) is very stable, even for product groups where the environmental impact is determined with relatively large uncertainty. For those product groups that have been identified as most important, significant improvement options have been identified and ongoing activities have been reviewed. Environmental impact intensity of productsThe comparison of environmental impacts per DKK is especially relevant for the discussion on ”de-coupling” of welfare and environmental impact, i.e. how a reduction in environmental impact can be achieved without necessarily reducing the total level of consumption. Products with high environmental impact intensity, i.e. high environmental impact per DKK, in the Danes' shopping baskets include fireworks, car driving (especially abroad), many food products, pet food, and detergents. If we look at Danish production, it is still meat and other foods, as well as fertilisers, semi-manufactured aluminium etc., tobacco products, transport by ship, cement, bricks and tiles, industrial cooling equipment, parts for motor vehicles, trailers etc., and basic plastics, which have high environmental impact intensities. As can be seen, some of the product groups with high environmental impact intensity were also mentioned as having a large environmental impact in the overall picture, including car driving, foods, transport by ship, and industrial cooling equipment. Thus, these products are important, not only because they have a relatively large production volume, but also because the have a high environmental impact ”in their own right.” Products with low environmental impact intensity are particularly services, e.g. bookkeeping and auditing, insurance, social security, financial and legal services, education and research, kindergartens and crèches, home and day care services and retirement homes. It is obvious that the products with high environmental impact intensities, such as food and transport, cannot be directly substituted by these low impact intensity services, since they do not fulfil the same needs. However, the information on impact intensities can be used to point out the products for which it would be highly desirable to search for satisfactory substitutes, which may go beyond the mere substitution of products with identical properties. For example, the general consumer welfare would not necessarily be affected by a non-compensated reduction in the amount of (high-impact-intensity) meat consumed. This could point to possible, desirable changes in the general consumption pattern. At a more general level, the information on impact intensities points out that it is an environmentally beneficial strategy to increase the service content of the products – provided the customers are willing to pay for this – since the value added by human labour adds no environmental impact. MethodMethodologically, the project takes its starting point in the Danish national accounts of the economic flows between Danish enterprises and institutions, i.e. their mutual purchases and sales, imports and exports, and supply to final consumption. This is then combined with data from different environmental statistics, adjusted to the same level of detail as the industries and product groups of the national accounts. The project includes all substances that contribute significantly to the environmental impacts that are normally included in product life cycle assessments, i.e. global warming, ozone depletion, acidification, nutrient enrichment, photochemical ozone formation, ecotoxicity, human toxicity and nature occupation. By taking the economic flows between all enterprises as a starting point, the chosen method ensures a high degree of completeness – avoiding that processes with small contributions to many products, e.g. transport processes, are left out. The recording of environmental impacts per DKK has the additional advantage that it prevents a product group from being ”concealed” when it is disaggregated into several smaller product groups. The national accounts' division into product groups has not been made with the purpose of environmental analyses, and if the division is too coarse an important product group may ”hide” among other products with a lower environmental impact. For example, fireworks would probably not have shown up among the prioritised products if we had considered exclusively the total environmental impact of this rather small product group. Conversely, the educational sector only reaches the top-10 of environmental impact because it is a very aggregated product group. In it self, education has very low environmental impact intensity and would not have reached the lists if it had been subdivided into primary, secondary and higher education, and adult education etc. When we consider environmental impact intensity, a product group keeps its position in the prioritisation, also when the product group is disaggregated, and it does not move up when aggregated. Therefore, it is recommended first to consider a prioritisation according to impact intensity, and only in a second step to include considerations on the size of the product groups. Other sources of information (see also the reference list at the end of the report)EU commission's web-pages on the integrated product policy (IPP): http://www.europa.eu.int/comm/environment/ipp/home.htm Hansen E. (1995a). Miljøprioritering af industriprodukter. Copenhagen: Danish Environmental Protection Agency. (Environmental Project no. 281). Nielsen A M, Christiansen K, Weidema B P. (2003). Prioritisation of product groups and product areas in the integrated product policy. Proceedings of a seminar, Copenhagen, 2003-03-10. http://www.lca-net.com/files/seminarreport.pdf Schmidt K, Poulsen P B, Schmidt A. (2003). Model for selection of future target areas in the Danish Program for Cleaner Products. Copenhagen: Danish Environmental Protection Agency. (Environmental Project no. 797). Sammenfattende artikelMiljøindsats vigtigst for fødevarer, boliger, skibe og elFødevarer, boliger, skibe og elektricitet er de fire produktområder hvor en miljøindsats i dansk industri vil have størst betydning. Ser man på danskernes privatforbrug er boliger, fødevarer, turisme, tøj, personlig hygiejne og bilkørsel vigtige indsatsområder. Det offentlige forbrug er generelt meget mindre miljøbelastende end privatforbruget, men kommer dog alligevel op blandt top-10 når forbrugsgrupperne sorteres efter samlet miljøpåvirkning. Dette er nogle af konklusionerne fra projektet ”Prioritering indenfor den produktorienterede miljøpolitik” som har udviklet en detaljeret metode til at lave sådanne prioriteringer. Metoden er baseret på en kombination af miljøstatistikker og det danske nationalregnskab, opdelt på 138 produktgrupper. Projektets baggrund og formålDen produktorienterede miljøpolitik i Danmark har hidtil været tilrettelagt som prioriterede indsatser overfor udvalgte brancher og/eller produktområder. Grundlaget for denne prioritering har bl.a. været resultaterne fra projektet ”Miljøprioritering af industriprodukter” (Hansen 1995). Som et første skridt til en opdatering heraf tog Miljøstyrelsen i 2001 initiativ til et forprojekt om en "Model til udpegning af fremtidige indsatsområder inden for Program for renere produkter" (Schmidt et al. 2003). Også i EU har kommissionen, som led i den integrerede produktpolitik (IPP), igangsat et projekt (med akronymet EIPRO) der har til formål at identificere hvilke produkter der har de største potentialer for miljømæssige forbedringer. Som et dansk bidrag hertil har Miljøstyrelsen nu fået udarbejdet en opdateret og mere detaljeret metode der giver et veldokumenteret beslutningsgrundlag for at udvælge produkter til og tilrettelægge den fremtidige produktorienterede indsats. Metoden er baseret på en kombination af miljøstatistikker og det danske nationalregnskab og er dermed nem at vedligeholde. Metoden er blevet anvendt til at opstille prioriterede lister over de produktgrupper og brancher hvor en dansk indsats vil have størst mulig miljømæssig betydning, både for de produkter der aktuelt produceres i Danmark (til eget forbrug eller eksport) og de produkter der aktuelt forbruges i Danmark (egenproducerede såvel som importerede). Projektet har endvidere tilvejebragt et samlet sæt af baggrundsdata til brug for livscyklusvurderinger af produkter forbrugt og/eller produceret i Danmark. Det er tanken at disse data skal kunne indgå i den database, der administreres af det danske LCA Center. Disse baggrundsdata kan anvendes til at udfylde "huller" i en livscyklusvurdering (LCA), hvor der mangler mere specifikke proces-data, og vil derfor kunne udgøre en slags "rygrad" i den danske LCA-database. Projektets usikkerhedsanalyse udgør samtidigt et grundlag for at tilrettelægge og prioritere den fremtidige dataindsamling til LCA-databasen. Projektets gennemførelseProjektet er gennemført fra januar 2003 til juni 2004 af en projektgruppe under ledelse af 2.-0 LCA consultants ApS og med deltagelse af CML (Leiden Universitet) og PRé Consultants (Nederlandene). Som led i projektet er der afholdt et internationalt seminar som er selvstændigt rapporteret (Nielsen et al. 2003). En tilknyttet ekspertgruppe har løbende kommenteret projektgruppens forslag til metoder og modeller og vurderet projektets resultater. HovedkonklusionerDanmarks eksportvarer er ansvarlige for rundt regnet halvdelen af den miljøpåvirkning der forårsages af dansk landbrug og industri (se figur 1.2), på trods af at denne eksport kun udgør halvt så stor en økonomisk værdi som danskernes eget forbrug (se figur 1.1). Eksporten er altså forholdsvis ”miljøtung.” Især eksporten af kød og skibstransport er iøjnefaldende. Fødevarer er en væsentlig kilde til miljøpåvirkninger. Ud over kød er mejeriprodukter og serviceydelser fra restauranter blandt de 10 produktgrupper med størst miljøpåvirkning. En gros handel er også blandt miljøpåvirkningens top-10, hvilket især skyldes et stort forbrug af transport og emballage og i mindre grad forbrug af reklamer og bygninger. Miljøpåvirkningen fra en gros handel indgår naturligvis i mange forskellige produkters miljøpåvirkning, og bliver altså først synlig når man betragter ”en gros handel” som et ”produkt” i sig selv. Det samme gælder transport. Dette viser betydningen af – som i dette projekt - at kunne analysere miljøpåvirkningen fra forskellige perspektiver, dvs. både:
Produktgrupper med stor miljøpåvirkningSer vi på forsyningsperspektivet, dvs. danske virksomheder og institutioners leverancer til endeligt forbrug eller eksport, er fødevarer, skibstransport og en gros handel som nævnt produktgrupper med stor miljøpåvirkning. Derudover kan nævnes boliger, elektricitet og varme samt industrielle køleanlæg (det eneste væsentlige produkt hvortil der i Danmark stadig bruges ozonlagsnedbrydende stoffer). I forbrugsperspektivet opdeler projektet danskernes forbrug på 98 produktgrupper, hvoraf boligens brug og opvarmning, fødevarer, turisme, tøj, personlig hygiejne og bilkørsel viser sig som de miljømæssigt vigtigste. I det offentlige forbrug er det ”Forsvar, politi og retsvæsen” samt uddannelses-sektoren, der har den største miljøpåvirkning. Når ”Forsvar, politi og retsvæsen” kommer med blandt miljøpåvirkningens top-10 skyldes det især det toksiske stof tributyltinoxid, der anvendes som anti-begroningsmidlet på flådens skibe, men også et generelt stort forbrug af brændstof, el, charterflyvning og transportmateriel. For uddannelses-sektoren er det især bygninger, opvarmning og elektricitet der bidrager til miljøpåvirkningen. Hvis man sammenligner miljøpåvirkningen per forbrugt krone, se tabel 1.50, bliver det dog tydeligt at det offentlige forbrug påvirker miljøet meget mindre end privatforbruget. Dette skyldes at det offentlige forbrug indeholder relativt meget arbejdskraft, som ikke bidrager med miljøpåvirkning. Afhængig af hvilken miljøpåvirkningskategori man ser på, vil en krone brugt af det offentlige påvirke miljøet med mellem 13% og 64% af miljøpåvirkningen fra en krone brugt af den private dansker. Der er gennemført en kvantitativ usikkerhedsanalyse, og prioriteringsresultaterne er angives med usikkerhedsintervaller. Generelt er forskellen mellem produkt-grupperne så store at deres overordnede placering i prioriteringen (blandt de 10 vigtigste, blandt de 20 vigtigste, osv.) er meget stabil, selv for produktgrupper hvor miljøpåvirkningen er bestemt med relativt stor usikkerhed. For de vigtigste produktgrupper har projektet identificeret væsentlige forbedringsmuligheder og beskrevet allerede igangværende aktiviteter. Produkternes miljø-intensitetSammenligningen af miljøpåvirkningen per forbrugt krone er i øvrigt særligt relevant for diskussionen om ”afkobling” af velfærd og miljøpåvirkning, dvs. hvorledes man kan opnå en lavere miljøpåvirkning uden at det samlede forbrug nødvendigvis reduceres. Produkter med høj miljø-intensitet, dvs. høj miljøpåvirkning per krone, i danskernes indkøbskurv omfatter fyrværkeri, bilkørsel (især i udlandet), mange fødevarer, hunde- og katte-mad, samt vaskemidler. Ser vi på dansk produktion, er det stadig kød og andre fødevarer, men også kunstgødning, halvfabrikata af aluminium m.v., tobaksprodukter, skibstransport, cement, mursten og tegl, industrielle køleanlæg, dele til motorkøretøjer, trailere o.l., samt ubearbejdede polymerer (basisplast) som har høj miljøintensitet. Som det ses er der en del af produktgrupperne med høj miljø-intensitet der også blev nævnt som havende en stor miljøpåvirkning samlet set, herunder bilkørsel, fødevarer, skibstransport og industrielle køleanlæg. Disse produkter er altså vigtige ikke bare fordi de har et relativt stort produktionsvolumen, men også fordi de ”i sig selv” har en høj miljøpåvirkning. Produkter med lav miljø-intensitet er især tjenesteydelser, som f.eks. bogføring og revision, forsikringsydelser, sociale ydelser, finansielle ydelser, advokatbistand, uddannelse og forskning, børnehaver og vuggestuer, hjemmeservice, og ældrepleje. Det er indlysende at produkterne med høj miljø-intensitet, som f.eks. fødevarer og transport, ikke direkte kan substitueres af disse tjenesteydelser med lav miljø-intensitet, da de ikke opfylder de samme behov. Informationen om miljø-intensiteter kan imidlertid bruges til at udpege de produkter for hvilke det ville være særligt ønskeligt at lede efter tilfredsstillende alternativer, som meget vel kan gå videre end en ren substitution af produkter med identiske egenskaber. For eksempel vil den generelle forbrugervelfærd ikke nødvendigvis blive påvirket af en ikke-kompenseret reduktion i forbruget af kød (med høj miljø-intensitet). Dette kunne pege på mulige, ønskelige ændringer i det generelle forbrugsmønster. På et mere generelt niveau peger informationen om miljø-intensiteter på at det er en miljømæssigt interessant strategi at forøge produkternes service-indhold – forudsat at forbrugerne er villige til at betale for dette – eftersom en værdiforøgelse baseret på menneskelig arbejdskraft ikke forøger miljøpåvirkningen. MetodeProjektets metode tager udgangspunkt i det danske nationalregnskabs opgørelser over økonomiske strømme mellem de danske virksomheder og institutioner, dvs. deres indbyrdes køb og salg, import og eksport, samt leverancer til endeligt forbrug. Dette kombineres så med data fra forskellige miljøstatistikker, der tilpasses samme detaljeringsniveau som nationalregnskabets opdeling i brancher og produktgrupper. Projektet omfatter alle stoffer som bidrager væsentligt til de miljøpåvirkninger der normalt medtages i livscyklusvurderinger, dvs. drivhuseffekt, ozonlags-nedbrydning, forsuring, næringssaltbelastning, fotokemisk ozondannelse, økotoksicitet, human toksicitet og naturbeslaglæggelse. Ved at tage udgangspunkt i de økonomiske strømme mellem alle virksomheder sikrer projektets metode at opgørelsen af miljøpåvirkningerne bliver meget fuldstændig – det undgås at processer som indgår som små bidrag til mange produkter, som f.eks. transport-processer, bliver glemt. Opgørelsen af miljøpåvirkningen per forbrugt krone har i øvrigt også den fordel at den forhindrer at en produktgruppe kan blive ”glemt” fordi den er blevet opdelt i flere mindre produktgrupper. Nationalregnskabets inddeling i produktgrupper er jo ikke foretaget med henblik på miljøanalyser, og hvis inddelingen er for grov kan en vigtig produktgruppe ”gemme sig” blandt andre produkter med lavere miljøpåvirkning. F.eks. ville fyrværkeri næppe være dukket op hvis vi udelukkende havde set på denne relativt lille produkt-gruppes samlede miljøpåvirkning. Omvendt kommer uddannelses-sektoren kun med blandt miljøpåvirkningens top-10 fordi det er en meget aggregeret produktgruppe. I sig selv har uddannelse en meget lav miljø-intensitet og ville slet ikke komme med på listerne hvis den var underinddelt i folkeskole, videregående uddannelser, voksenundervisning osv. Når vi ser på miljøintensitet beholder en produktgruppe sin placering i prioriteringen også når produktgruppen disaggregeres, og den rykker ikke op når der aggregeres. Derfor anbefales det at prioriteringen tager udgangspunkt i produkternes miljø-intensitet og først derefter tager hensyn til produktgruppernes størrelse. Rapportens engelske navne på produktgrupperne er i bilag A oversat til dansk. Andre informationskilder ( se også referencelisten bagerst i rapporten)EU kommissionens web-sider om den integrerede produktpolitik (IPP): http://www.europa.eu.int/comm/environment/ipp/home.htm Hansen E. (1995a). Miljøprioritering af industriprodukter. København: Miljøstyrelsen (Miljøprojekt 281) Nielsen A M, Christiansen K, Weidema B P. (2003). Prioritisation of product groups and product areas in the integrated product policy. Proceedings of a seminar, Copenhagen, 2003-03-10. http://www.lca-net.com/files/seminarreport.pdf Schmidt K, Poulsen P B, Schmidt A. (2003). Model for selection of future target areas in the Danish Program for Cleaner Products. København: Miljøstyrelsen. (Miljøprojekt 797). 1 Environmental impact of product groups1.1 Environmental impact of Danish production and consumption 1.1 Environmental impact of Danish production and consumptionAs a decision basis for planning and selecting products for the future product-oriented activities, this chapter provides lists of the product groups and industries with the largest environmental impact potentials. The lists have been made with the method described in Chapter 2, combining environmental statistics and the national accounts. The assessment has been performed for the year 1999, since at the start of the project this was the most recent year for which comprehensive data were available. In the context of this report, environmental impact potentials are defined in terms of eight impact categories:
The methodology for assessing these impacts is described in Chapter 2.10. For ease of reading, we use in the remainder of this report the short-hand “environmental impact” instead of “environmental impact potential”, although it should be understood that all mentioning of impacts in this report relate to impact potentials, not actual impacts. The system boundaries for Danish production and consumption are drawn from a lifecycle perspective, i.e. including all upstream processes from the “cradle”, i.e. material extraction from nature, and downstream to the “grave”, i.e. waste treatment. To provide the most complete picture possible, this report applies several different perspectives on Danish production and consumption:
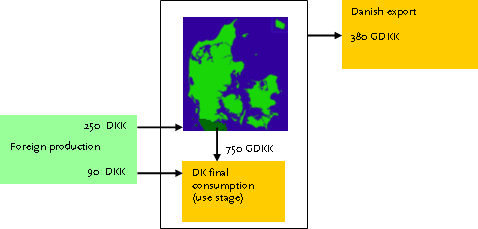
The lifecycles of each product group have generally been constructed by linking the upstream processes proportionally to the monetary value of the flows between the processes, as is traditionally done in economic input-output analysis and product life cycle assessment. This implies the assumption that a change in demand for a product will lead to a proportional change in production volume in the entire supply chain. To take into account that not all industries can change their production volume in response to a change in demand (for example, because of the quotas on milk production, a change in the output of milk from the dairies will not be able to influence the amount of milk produced in agriculture, and therefore not the environmental impacts from agriculture either), we analysed all industries systematically for long-term production constraints, i.e. constraints that influence investment decisions, like the one mentioned for dairy farms. For the most important constrained industries we have divided the industry in a constrained and a non-constrained part, transferred the constrained supplies to the alternative non-constrained industry and added the constrained outputs as separate products in new final consumption group, typically named “industry name (constrained)”. Since a constrained production is still relevant for non-market-based environmental measures, a constrained product takes part in the same way as any other product in the prioritisation in the supply and process perspectives. More detail on the treatment of constrained industries can be found in Chapter 2.9. A quantitative uncertainty assessment of the results has been performed and is reported in Chapter 1.5. Confidence intervals are provided on the prioritisation results in Chapter 1.4.1. Generally, the difference between the product groups are so large that their overall position in the prioritisation (among the 10 most important, among the 20 most important etc.) is very stable, even for product groups where the environmental impact is determined with relatively large uncertainty. In monetary terms, Danish consumption amounted in year 1999 to 840 GDKK (840*109 DKK) not including product taxes. Out of this, 90 GDKK was products directly imported for final consumption, while 750 GDKK was from domestic production. The domestic production also had an import, amounting to 250 GDKK (not including re-export), but also an export, with a total value of 380 GDKK. These product flows are illustrated in Figure 1.1. It is noteworthy that imports and exports practically outweigh each other, and amounts to less than half of the Danish consumption.
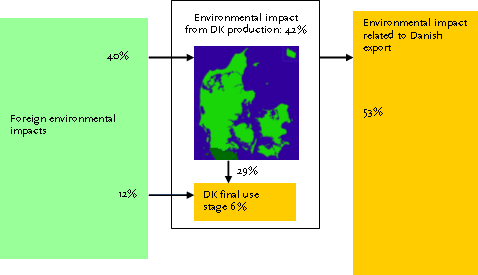
Figure 1.1. The flows of products related to Danish production and consumption, in monetary terms (Data based on the National Accounting matrices for year 1999 as modified in this project, see Chapter 2). A similar picture can be drawn for the environmental impacts related to these product flows, see Figure 1.2. The flows are shown as percentages of the total environmental impact from Danish production and consumption, expressed as an average of the eight environmental impact categories, i.e. where all environmental impact categories are weighted equally, see Chapter 2.10.4. For a more detailed picture, please refer to the similar figures for each impact category in Chapter 1.4. Seen from the supply side, the total environmental impacts (100%) can be split into those related to Danish activities (42% from Danish production and 6% from the final use stage) while the remaining 52% are environmental impacts abroad related to the products imported to Denmark (12% directly for final use and 40% for the products used by Danish industries).
Figure 1.2. The environmental impact potential related to Danish production and consumption, in percentage of the total. Seen from the consumption side, the same 100% can be split into that which is related to Danish consumption (12%+29%+6% = 47%) and the 53% related to the products exported. Comparing Figure 1.1 and Figure 1.2, it is clear that Danish foreign relations are proportionally much more environmentally important than their monetary flows indicate. In other words, both imported products and products produced for export in general cause more environmental impact than products produced in Denmark for the Danish market. Figures similar to Figure 1.1 and Figure 1.2 could be made for each single product group, thus providing information on how environmental impact is related to import and export of that commodity. This could be useful e.g. when discussing how emission quota can best be designed and administrated. 1.2 Product groups with largest environmental impactsThis sub-chapter provides the overall results of the developed prioritisation method, as applied to Danish production and consumption. For details on the methodology, please see Chapter 2, and for details for each impact category, please see Chapter 1.4. 1.2.1 Product groups within Danish productionFirst, we apply the supply or net production perspective, i.e. we look at the product groups supplied by Danish industries going either to final consumption or export. This is a “cradle to gate” perspective, where the gate is the point where the product leaves the Danish industry. For example for pork and pork products, it includes all processes (and their environmental impacts) upstream of and including the meat processing industry, but not the wholesale and retail sale and the final use in the households (or in industries abroad for exported products). Wholesale trade and retail sale are included as separate services. Within this perspective, the product groups with the largest environmental impacts are shown in the list below (the export percentage is shown in brackets, except for product groups where the production is not demand-driven, due to constraints on production volume or emissions, see also Chapter 2.9):
Together, these 10 products groups (out of a total of 138) account for 45% of the total environmental impact from Danish production and consumption. Pork and pork products rank high on all impact categories; see Chapter 1.4.1. This is partly due to the large share of pork production in the Danish economy (1.3% of the total production value), but also due to a high impact per monetary value for many of the impact categories; see Chapter 1.4.2. Dwellings, i.e. the management of residential buildings, also rank high on all impact categories; see Chapter 1.4.1. This is mainly due to the large share of this industry in the Danish economy (more than 5% of the total production value). Transport by ship ranks high on all impact categories, except nature occupation; see Chapter 1.4.1. This is partly due to the large share of shipping in the Danish economy (close to 3% of the total production value), but also due to a relatively high impact per monetary value (see Chapter 1.4.2), especially for the impact category ecotoxicity (due to the antifouling agent tributyltinoxide (TBTO)), but also for acidification (due to emissions of SO2 and NOx). The latter is in spite of a specific 75% reduction in the value attached to these emissions from shipping due to the lower expose expected from emissions at sea (see Chapter 2.10.1). As can be further seen in Chapter 1.4.1:
Industrial cooling equipment has been included on the list mainly because its net production alone accounts for 17% of the total ozone depletion potential related to Danish production and consumption. In chapter 1.7, we discuss the possible implications, in terms of improvement options for the above product groups. 1.2.2 Product groups within Danish consumptionNext, we apply the consumption perspective, i.e. we look at the product groups from either foreign or Danish industries going to final consumption in Denmark, both private and public. This is a complete “cradle to grave” perspective on these product groups. This implies that wholesale, retail sale and the use stage are included for each product, unless specifically excluded. For example, a product group is specifically called “meat purchase” to denote that cooking is not included (since it is reported separately as “cooking in household”), while “Dwellings and heating” include all use stage emissions from the dwellings. The following product groups within Danish consumption (both private and public) have been identified as the ones with the largest environmental impacts:
Together, these 10 products groups (out of a total of 98) account for 57% of the total environmental impact from Danish consumption, and 25% of the total impact from Danish production and consumption. Dwellings (with or without inclusion of heating), meat purchase, tourist expenditures, clothing and catering rank high on all impact categories; see Chapter 1.4.1. General public services, public order and safety affairs, Personal hygiene and Education and research rank high on all impact categories except nature occupation. Heating and electricity are important contributors to this, while sewage treatment is also important for personal hygiene and buildings play an important role for education and research. The public consumption group “General public services, public order and safety affairs” has its main input from the above-mentioned public industry “Defence, justice, public security and foreign affairs.” As can be further seen in Chapter 1.4.1:
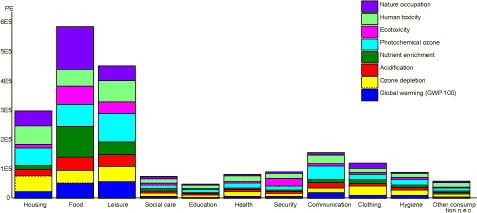
In chapter 1.7, we discuss the possible implications, in terms of improvement options for the above product groups. 1.2.3 Inherent limitations of product group aggregationWhen identifying the most important product groups, as in the preceding sections, it is unavoidable that the result is influenced by how the product groups are defined, and especially their level of aggregation. A highly aggregated product group is more likely to show up among the top 10, and by disaggregating it into a number of smaller product groups, it can be made to disappear from the top 10. For example, education and research only reaches the top-10 of environmental impact because it is a very aggregated product group. In it self, education has very low environmental impact intensity (see chapter 1.4.2) and would not have reached the top 10 if it had been divided into primary, secondary and higher education, and adult education etc. To counter this inherent arbitrariness in the ranking, several complementary approaches can be applied: One option is to apply a functional approach, where the division between product groups is based on what needs the different products fulfil. Since this approach breaks down the entire consumption top-down, it becomes impossible to hide important product groups. A first step of this approach is applied in Chapter 1.2.4. The linking of products in the use stage, described in Chapter 2.7.2, is also a part of this approach. Another way of avoiding arbitrariness is to rank the product groups according to their environmental impact intensity, i.e. their impact per monetary value, as is done in Chapter 1.3. A product with a large impact per economic value will then appear on the top 10 also when disaggregated. In this approach, the only way an important product can disappear from the top 10 is if it is aggregated with another product with a low environmental impact. This means that it is still possible that very inhomogeneous product groups (in terms of impact intensity) can conceal products with large impact intensities. However, this problem can be solved by appropriate disaggregation. Thus, to limit the arbitrariness in the ranking, it is recommended first to apply a ranking according to impact intensity (as in Chapter 1.3), then to disaggregate the most inhomogeneous product groups (already done for the results presented in Chapter 1.3, see also Chapters 2.6 and 2.7), and finally to supplement this with a ranking that also takes into account the volume of the product groups, first in terms of need groups (see Chapter 1.2.4) and secondly in a disaggregated analysis (as in Chapters 1.2.1, 1.2.2). Another advantage of the ranking according to impact intensity is its ability to answer questions related to sustainable consumption, such as: “Given a specific level of consumption in monetary terms, which products should be chosen to reduce the overall impact the most, and what products should be deselected?” The first part of the question focuses on the product groups with the least impacts per monetary unit, i.e. the opposite focus compared to the top 10 ranking. By combining the impact intensities with consumption trends, it is also possible to calculate the environmental impact of the marginal consumer spending. These issues are treated in Chapters 1.4.2 and 1.4.3. 1.2.4 Danish consumption divided according to product functions (need groups)Product groups or groups of final consumption can be divided according to product functions, i.e. relating to the satisfaction of specific human needs. There are several suggestions on how to classify human needs. Within the field of psychology, Maslow (1954) and more recently Max-Neef (1992) have proposed sets of basic human needs. Sen (1998) and Nussbaum (1998) propose to characterize basic needs as necessary “capabilities to function.” Segal (1998) noted that this concept can be quite contestable across cultures, and how degree of satisfaction for many of the need categories would be difficult or impossible to assess in practice. He proposed instead a more physically-grounded, less psychologically descriptive need framework, focusing on a subset of the basic human needs, which he termed “core economic needs”. Advantages of this approach are that its applicability has been demonstrated in practical empirical work and that it provides a stronger linkage between consumption and affluence and its basis in products. We have applied a slight modification of Segal's set of core economic needs, in order to adequately cover all consumption groups in the NAMEA. We have expanded Segal's concept of child care to social care in general and the concept of economic security to security in general, added hygiene and leisure as need groups, and redefined the need for transportation into a need for communication, while splitting out part of car driving on food purchase and leisure. The resulting 10 need groups are (with share of total economic expenditure in brackets):
An additional group of “Other consumption not elsewhere classified” accounts for the remaining 7%. This group covers mainly “infrastructure” expenditures, such as interest etc. on financial investments, and economic affairs and services. It is interesting to note from Figure 1.3 that the environmental impact is concentrated on a few need groups and does not follow the economic expenditure. This means that the need groups differ significantly in impact intensity, as is also shown in Table 1.1.
Figure 1.3. Environmental impact per need group in Danish consumption. Table 1.1. Need groups in Danish consumption, ranked according to environmental impact intensity. Impacts are shown in person-equivalents (PE), i.e. the total environmental impact caused by the production and consumption of an average Dane in 1999 (see Chapter 2.10.3).
Note that the sum of the environmental impacts in Table 1.1 amounts to 44% of the impacts from the Danish production and consumption, compared to the 47% in Figure 1.2. The difference is due to constrained productions within the Danish industries, which are not included in the demand-driven environmental impact in Table 1.1 (see also Chapter 2.9). In chapter 1.7, we discuss the improvement options for the most important need groups. 1.2.5 Largest environmental impacts per DKKThe following product groups supplied by Danish industry (for domestic final consumption or for export) have been identified as the ones with the largest environmental impact per DKK:
Meat and meat products covers beef, pork and chicken meat and thus also represents the alternative supply for the constrained production of fish, seafood and fish products. Agricultural products in general covers the products directly bought on farms for final consumption (including export). These product groups rank high per DKK on all impact categories, except ozone depletion and human toxicity; see Chapter 1.4.2. As can further be seen in Chapter 1.4.2:
The following product groups within Danish consumption have been identified as the ones with the largest environmental impact per DKK:
Fireworks rank high per DKK on all impact categories, except nutrient enrichment and nature occupation; see Chapter 1.4.2. Car driving abroad ranks high per DKK on all impact categories, except ecotoxicity and nature occupation; see Chapter 1.4.2. Car driving in Denmark is not included in the list because it is more expensive than car driving abroad, which make it come out lower per DKK. Meat purchase rank high per DKK on all impact categories, except ozone depletion, photochemical ozone and human toxicity; see Chapter 1.4.2. Non-durable household goods n.e.c. (not elsewhere classified) ranks high on all impact categories except global warming, nutrient enrichment and nature occupation; see Chapter 1.4.2. The product group is very diverse, covering items such as labels, polishes, minor textile items, wrapping paper, brooms and brushes, carbondioxide cartridges and pesticides. It is one of the product groups that would be recommendable to subdivide for a more detailed analysis. As can further be seen in Chapter 1.4.2:
It is interesting to note that six of the ten listed product groups within Danish consumption relate exclusively to imported products. This reflects the relatively large environmental impact intensity of foreign production; see also Chapter 2.8. If we focus exclusively on domestically produced product groups within Danish consumption, the ones with the largest environmental impact per DKK are (besides fireworks, meat, non-durable household goods and potatoes):
As can be seen in Chapter 1.4.2:
Toilet flush ranks high per DKK on nutrient enrichment and ecotoxicity; see Chapter 1.4.2. The ecotoxicity can be traced back to emissions of copper, zinc and cadmium from corrosion of galvanised products. The share of this corrosion that is attributed to toilet flush is relatively small (15%), but because toilet flush is a relatively cheap activity, it still comes out high per DKK. In chapter 1.7, we discuss the possible implications, in terms of improvement options, for the above product groups. It is noteworthy that many of the product groups appearing in the lists in Chapters 1.2.1 and 1.2.2 (large overall improvement potentials) also appear here with large improvement potentials per DKK. This implies that these product groups are not only of interest due to their size, but also “in their own right”. At the other end of the scale, we find the products with low environmental impact intensity, which appear particularly to be services, e.g. bookkeeping and auditing, insurance, social security, financial and legal services, education and research, kindergartens and crèches, home and day care services and retirement homes; see Chapter 1.4.2. It is obvious that the products with high environmental impact intensities, such as food and transport, cannot be directly substituted by these low impact intensity services, since they do not fulfil the same needs. Likewise, even though transport by air has a lower environmental impact intensity than transport by ship, an item transported by air still involves more environmental impact than when transported by ship, simply because transport by air is more costly. However, the information on impact intensities can be used to point out the products for which it would be highly desirable to search for satisfactory substitutes, which may go beyond the mere substitution of products with identical functional properties. For example, the alternative to transport by ship is not necessarily another form of transport, but could also be a relocation of the production. Similarly, the general consumer welfare would not necessarily be affected by a non-compensated reduction in the amount of (high-impact-intensity) meat consumed. This could point to possible, desirable changes in the general consumption pattern. At a more general level, the information on impact intensities points out that it is an environmentally beneficial strategy to increase the service content of the products – provided the customers are willing to pay for this – since the value added by human labour adds no environmental impact. 1.3 Processes with largest environmental impactsIt is also possible to analyse the results across all product groups, to identify processes that have large contributions to the overall environmental impact without necessarily being suppliers of final consumption goods. For results per impact category, please see Chapter 1.4.4. The processes with the largest contributions to the environmental impacts from Danish production and consumption have been identified as:
It should be noted that while Danish processes (DK) are true gate-to-gate processes, the foreign (ROW – Rest-Of-World) processes are terminated cradle-to-gate supply chains. As can be seen in Chapter 1.4.4:
Further, Danish production of industrial cooling equipment accounts for 29% of the total ozone depletion potential related to Danish production and consumption. This may be compared to the 17% noted in Chapter 1.2.1, which is for the net production only, i.e. the industrial cooling equipment entering into final consumption, which in this case is entirely export. The difference (12%) is the amount used by Danish industry itself. 1.4 Results per impact category1.4.1 Environmental impact of Danish production and consumptionIn this sub-chapter, we look at each environmental impact category separately, providing both the overall picture (in the Figures) and ranked data tables showing the most important product groups. The tables include all product groups with a result of more than 10% of the top-ranking product group, or at least 15 product groups. 1.4.1.1 Global warming
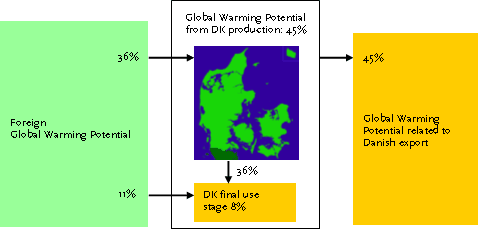
Figure 1.4. The Global Warming Potential (GWP) related to Danish production and consumption, in percentage of the total, of which the GWP from Danish activities amount to 53%. The GWP related to Danish consumption is 11%+36%+8% = 55%, while 45% is related to Danish export. Table 1.2. Product groups within Danish net production with the largest Global Warming Potential (GWP), in person-equivalents (PE) and % of total GWP from Danish production and consumption.
1) The value shown represents the total impact from Danish electricity and heat minus the values shown for “Electricity (unconstrained)” and “District heat (unconstrained)” Table 1.3. Product groups within Danish consumption with the largest Global Warming Potential (GWP), in person-equivalents (PE) and % of total GWP from Danish production and consumption.
1.4.1.2 Ozone depletion
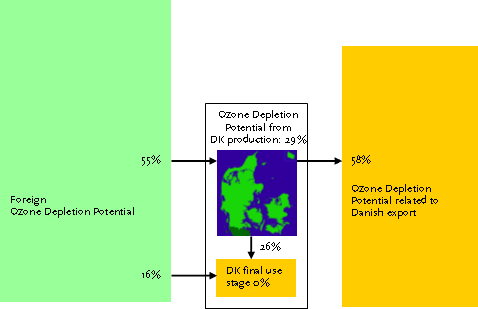
Figure 1.5. The Ozone Depletion Potential (ODP) related to Danish production and consumption, in percentage of the total, of which the ODP from Danish activities amount to 29%. The ODP related to Danish consumption is 16%+26% = 42%, while 58% is related to Danish export. Table 1.4. Product groups within Danish net production with the largest Ozone Depletion Potential (ODP), in person-equivalents (PE) and % of total ODP from Danish production and consumption.
Table 1.5. Product groups within Danish consumption with the largest Ozone Depletion Potential (ODP), in person-equivalents (PE) and % of total ODP from Danish production and consumption.
1.4.1.3 Acidification
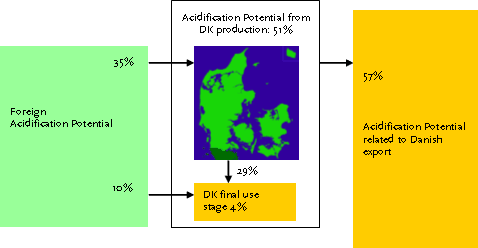
Figure 1.6. The Acidification Potential (AP) related to Danish production and consumption, in percentage of the total, of which the AP from Danish activities amount to 55%. The AP related to Danish consumption is 10%+29%+4% = 43%, while 57% is related to Danish export. Table 1.6. Product groups within Danish net production with the largest Acidification Potential (AP), in person-equivalents (PE) and % of total AP from Danish production and consumption.
1) The value shown represents the total impact from Danish electricity and heat minus the values for “Electricity (unconstrained)” and “District heat (unconstrained)” Table 1.7. Product groups within Danish consumption with the largest Acidification Potential (AP), in person-equivalents (PE) and % of total AP from Danish production and consumption.
1.4.1.4 Nutrient enrichment
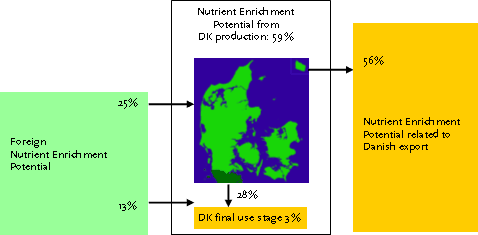
Figure 1.7. The Nutrient Enrichment Potential (NEP) related to Danish production and consumption, in percentage of the total, of which the NEP from Danish activities amount to 62%. The NEP related to Danish consumption is 13%+28%+3% = 44%, while 56% is related to Danish export. Table 1.8. Product groups within Danish net production with the largest Nutrient Enrichment Potential (NEP), in person-equivalents (PE) and % of total NEP from Danish production and consumption.
1) The value shown represents the total impact from Danish electricity and heat minus the values for “Electricity (unconstrained)” and “District heat (unconstrained)” Table 1.9. Product groups within Danish consumption with the largest Nutrient Enrichment Potential (NEP), in person-equivalents (PE) and % of total NEP from Danish production and consumption.
1.4.1.5 Photochemical ozone creation
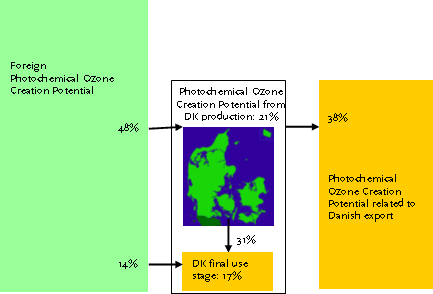
Figure 1.8. The Photochemical Ozone Creation Potential (POCP) related to Danish production and consumption, in percentage of the total, of which the POCP from Danish activities amount to 38%. The POCP related to Danish consumption is 14%+31%+17% = 62%, while 38% is related to Danish export. Table 1.10. Product groups within Danish net production with the largest Photochemical Ozone Creation Potential (POCP), in person-equivalents (PE) and % of total POCP from Danish production and consumption.
1) The value shown represents the total impact from Danish electricity and heat minus the values for “Electricity (unconstrained)” and “District heat (unconstrained)” Table 1.11. Product groups within Danish consumption with the largest Photochemical Ozone Creation Potential (POCP), in person-equivalents (PE) and % of total POCP from Danish production and consumption.
1.4.1.6 Ecotoxicity
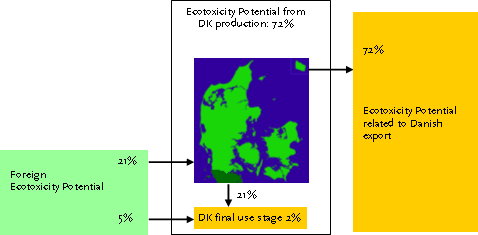
Figure 1.9. The Ecotoxicity Potential (ETP) related to Danish production and consumption, in percentage of the total, of which the ETP from Danish activities amount to 74%. The ETP related to Danish consumption is 5%+21%+2% = 28%, while 72% is related to Danish export. Table 1.12. Product groups within Danish net production with the largest Ecotoxicity Potential (ETP), in person-equivalents (PE) and % of total ETP from Danish production and consumption.
Table 1.13. Product groups within Danish consumption with the largest Ecotoxicity Potential (ETP), in person-equivalents (PE) and % of total ETP from Danish production and consumption.
1.4.1.7 Human toxicity
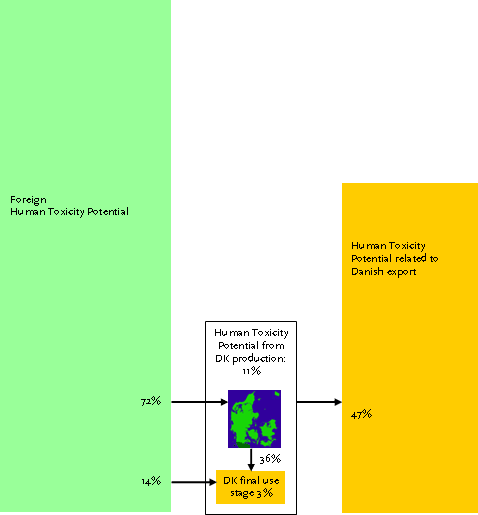
Figure 1.10. The Human Toxicity Potential (HTP) related to Danish production and consumption, in percentage of the total, of which the HTP from Danish activities amount to 14%. The HTP related to Danish consumption is 14%+36%+3% = 53%, while 47% is related to Danish export. Table 1.14. Product groups within Danish net production with the largest Human Toxicity Potential (HTP), in person-equivalents (PE) and % of total HTP from Danish production and consumption.
1) The value shown represents the total impact from Danish electricity and heat minus the values for “Electricity (unconstrained)” and “District heat (unconstrained)” Table 1.15. Product groups within Danish consumption with the largest Human Toxicity Potential (HTP), in person-equivalents (PE) and % of total HTP from Danish production and consumption.
1.4.1.8 Nature occupation
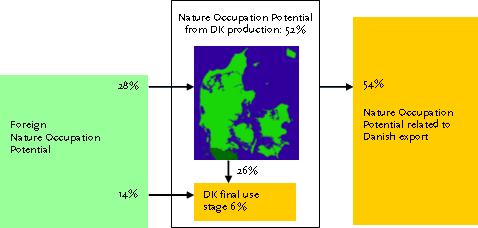
Figure 1.11. The Nature Occupation Potential (NOP) related to Danish production and consumption, in percentage of the total, of which the NOP from Danish activities amount to 58%. The NOP related to Danish consumption is 14%+26%+6% = 46%, while 54% is related to Danish export. Table 1.16. Product groups within Danish net production with the largest Nature Occupation Potential (NOP), in person-equivalents (PE) and % of total NOP from Danish production and consumption.
Table 1.17. Product groups within Danish consumption with the largest Nature Occupation Potential (NOP), in person-equivalents (PE) and % of total NOP from Danish production and consumption.
1.4.2 Environmental impact intensitiesIn this sub-chapter, we look at what product groups have the largest environmental impact intensity, i.e. environmental impact per DKK, still for each environmental impact category separately. We also look at the product groups with the smallest impact intensity, i.e. with the least environmental impact per DKK. This information is especially relevant when discussing “de-coupling”, i.e. how a reduction in environmental impact can be achieved without necessarily reducing the total level of consumption. All product groups with a result of more than 10% of the top-ranking and 10 times the bottom-ranking product group are included in the tables, except when closer than a factor two to the average product, and never less than 15 product groups. 1.4.2.1 Global warming intensities within Danish productionTable 1.18. Product groups within Danish production with the largest Global Warming intensity, in person-equivalents per monetary unit (PE/kDKK) and relative to an average product from Danish production.
Table 1.19. Product groups within Danish production with the smallest Global Warming intensity, in person-equivalents per monetary unit (PE/kDKK) and relative to an average product from Danish production.
1.4.2.2 Global warming intensities within Danish consumptionTable 1.20. Product groups within Danish consumption with the largest Global Warming intensity, in person-equivalents per monetary unit (PE/kDKK) and relative to an average product within Danish consumption.
Table 1.21. Product groups within Danish consumption with the smallest Global Warming intensity, in person-equivalents per monetary unit (PE/kDKK) and relative to an average product within Danish consumption.
1.4.2.3 Ozone depletion intensities within Danish productionTable 1.22. Product groups within Danish production with the largest Ozone Depletion intensity, in person-equivalents per monetary unit (PE/kDKK) and relative to an average product from Danish production.
Table 1.23. Product groups within Danish production with the smallest Ozone Depletion intensity, in person-equivalents per monetary unit (PE/kDKK) and relative to an average product from Danish production.
1.4.2.4 Ozone depletion intensities within Danish consumptionTable 1.24. Product groups within Danish consumption with the largest Ozone Depletion intensity, in person-equivalents per monetary unit (PE/kDKK) and relative to an average product within Danish consumption.
Table 1.25. Product groups within Danish consumption with the smallest Ozone Depletion intensity, in person-equivalents per monetary unit (PE/kDKK) and relative to an average product within Danish consumption.
1.4.2.5 Acidification intensities within Danish productionTable 1.26. Product groups within Danish production with the largest Acidification intensity, in person-equivalents per monetary unit (PE/kDKK) and relative to an average product from Danish production.
Table 1.27. Product groups within Danish production with the smallest Acidfication intensity, in person-equivalents per monetary unit (PE/kDKK) and relative to an average product from Danish production.
1.4.2.6 Acidification intensities within Danish consumptionTable 1.28. Product groups within Danish consumption with the largest Acidification intensity, in person-equivalents per monetary unit (PE/kDKK) and relative to an average product within Danish consumption.
Table 1.29. Product groups within Danish consumption with the smallest Acidification intensity, in person-equivalents per monetary unit (PE/kDKK) and relative to an average product within Danish consumption.
1.4.2.7 Nutrient enrichment intensities within Danish productionTable 1.30. Product groups within Danish production with the largest Nutrient Enrichment intensity, in person-equivalents per monetary unit (PE/kDKK) and relative to an average product from Danish production.
Table 1.31. Product groups within Danish production with the smallest Nutrient Enrichment intensity, in person-equivalents per monetary unit (PE/kDKK) and relative to an average product from Danish production.
1.4.2.8 Nutrient enrichment intensities within Danish consumptionTable 1.32. Product groups within Danish consumption with the largest Nutrient Enrichment intensity, in person-equivalents per monetary unit (PE/kDKK) and relative to an average product within Danish consumption.
Table 1.33. Product groups within Danish consumption with the smallest Nutrient Enrichment intensity, in person-equivalents per monetary unit (PE/kDKK) and relative to an average product within Danish consumption.
1.4.2.9 Photochemical ozone intensities within Danish productionTable 1.34. Product groups within Danish production with the largest Photochemical Ozone intensity, in person-equivalents per monetary unit (PE/kDKK) and relative to an average product from Danish production.
Table 1.35. Product groups within Danish production with the smallest Photochemical Ozone intensity, in person-equivalents per monetary unit (PE/kDKK) and relative to an average product from Danish production.
1.4.2.10 Photochemical ozone intensities within Danish consumptionTable 1.36. Product groups within Danish consumption with the largest Photochemical Ozone intensity, in person-equivalents per monetary unit (PE/kDKK) and relative to an average product within Danish consumption.
Table 1.37. Product groups within Danish consumption with the smallest Photochemical Ozone intensity, in person-equivalents per monetary unit (PE/kDKK) and relative to an average product within Danish consumption.
1.4.2.11 Ecotoxicity intensities within Danish productionTable 1.38. Product groups within Danish production with the largest Ecotoxicity intensity, in person-equivalents per monetary unit (PE/kDKK) and relative to an average product from Danish production.
Table 1.39. Product groups within Danish production with the smallest Ecotoxicity intensity, in person-equivalents per monetary unit (PE/kDKK) and relative to an average product from Danish production.
1.4.2.12 Ecotoxicity intensities within Danish consumptionTable 1.40. Product groups within Danish consumption with the largest Ecotoxicity intensity, in person-equivalents per monetary unit (PE/kDKK) and relative to an average product within Danish consumption.
Table 1.41. Product groups within Danish consumption with the smallest Ecotoxicity intensity, in person-equivalents per monetary unit (PE/kDKK) and relative to an average product within Danish consumption.
1.4.2.13 Human toxicity intensities within Danish productionTable 1.42. Product groups within Danish production with the largest Human Toxicity intensity, in person-equivalents per monetary unit (PE/kDKK) and relative to an average product from Danish production.
Table 1.43. Product groups within Danish production with the smallest Human Toxicity intensity, in person-equivalents per monetary unit (PE/kDKK) and relative to an average product from Danish production.
1.4.2.14 Human toxicity intensities within Danish consumptionTable 1.44. Product groups within Danish consumption with the largest Human Toxicity intensity, in person-equivalents per monetary unit (PE/kDKK) and relative to an average product within Danish consumption.
Table 1.45. Product groups within Danish consumption with the smallest Human Toxicity intensity, in person-equivalents per monetary unit (PE/kDKK) and relative to an average product within Danish consumption.
1.4.2.15 Nature occupation intensities within Danish productionTable 1.46. Product groups within Danish production with the largest Nature Occupation intensity, in person-equivalents per monetary unit (PE/kDKK) and relative to an average product from Danish production.
Table 1.47. Product groups within Danish production with the smallest Nature Occupation intensity, in person-equivalents per monetary unit (PE/kDKK) and relative to an average product from Danish production.
1.4.2.16 Nature occupation intensities within Danish consumptionTable 1.48. Product groups within Danish consumption with the largest Nature Occupation intensity, in person-equivalents per monetary unit (PE/kDKK) and relative to an average product within Danish consumption.
Table 1.49. Product groups within Danish consumption with the smallest Nature Occupation intensity, in person-equivalents per monetary unit (PE/kDKK) and relative to an average product within Danish consumption.
1.4.3 Impact of average and marginal consumptionIn the preceding sub-chapter on the environmental impact intensity of products, we already introduced, for the purpose of comparison, the concept of the environmental impact intensity of an average consumed product. This concept can be broken down into the impact intensity of the average consumer spending, and the impact intensity of the average public spending. These values can be found in Table 1.50. The values can be derived from the normalisation reference (see Chapter 2.10.3) as the share of each impact category related to Danish consumption (split out on private and public consumption) divided by the value of the total annual Danish consumption including product-related taxes (which is 644 GDKK for private consumption and 312 for GDKK public consumption). Note that share of each impact category related to Danish consumption in Table 1.50 does not necessarily add up to the percentage calculated in the figure text of each Figure in Chapter 1.4.1, since the values in Table 1.50 only relates to the part of the environmental impact that can be influenced by demand changes (see also Chapter 2.9). Table 1.50. The environmental impact of the average Danish consumption
An interesting comparison of impact intensities of private and public consumption can be made from Table 1.50. It can be seen that one DKK used by public authorities has an environmental impact between 13% and 64% of that of one DKK used by a private Dane, depending on the impact category. Popularly speaking, we may thus pay our tax with a smile, at least seen from an environmental perspective. When applying the data on impact intensity for comparisons, e.g. in the context of “de-coupling”, it is in fact not the environmental impact of the average spending which is of interest, but rather the environmental impact of the marginal spending, i.e. the impact of the last or an additional DKK spent. The composition of the marginal spending can be derived by studying the change in consumption either as the entire economy grows (as shown in Weidema 2003, Figure 3.2) or as the spending of individual consumers grow. The latter approach will give a better estimate, since the change in consumption over time for the entire economy may be influenced by many other trends in consumption patterns than that relating to increased spending. Data on the consumption patterns of consumers with different income levels are available from Statistics Denmark, which should allow determination of the change in spending with increasing income. It has not been possible within the limits of this project to determine the composition of the marginal spending in this preferred way, but once such a composition is specified, it is straightforward to calculate the environmental impact of the marginal spending by combining the composition of the spending with the emission intensities per industry provided by the database from this project (see Chapter 7). 1.4.4 Processes with large contributions to each impact categoryWe have also analysed the results for each environmental impact category across all product groups, to identify the processes that have large contributions without necessarily being suppliers of final consumption goods. These processes are shown in tables 1.51 to 1.58. The tables include all processes with a result of more than 10% of the top-ranking process, or at least 15 processes. Note that while Danish (DK) processes are true gate-to-gate processes, the foreign (ROW) processes are terminated cradle-to-gate supply chains. Table 1.51. Processes within Danish production and consumption with the largest Global Warming Potential (GWP), in person-equivalents (PE) and % of total GWP from Danish production and consumption.
1) The value shown represents the total impact from Danish electricity and heat minus the values shown for “Electricity (unconstrained)” and “District heat (unconstrained)” Table 1.52. Processes within Danish production and consumption with the largest Ozone Depletion Potential (ODP), in person-equivalents (PE) and % of total ODP from Danish production and consumption
Table 1.53. Processes within Danish production and consumption with the largest Acidification Potential (AP), in person-equivalents (PE) and % of total AP from Danish production and consumption.
1) The value shown represents the total impact from Danish electricity and heat minus the values shown for “Electricity (unconstrained)” and “District heat (unconstrained)” Table 1.54. Processes within Danish production and consumption with the largest Nutrient Enrichment Potential (NEP), in person-equivalents (PE) and % of total NEP from Danish production and consumption.
Table 1.55. Processes within Danish production and consumption with the largest Photochemical Ozone Creation Potential (POCP), in person-equivalents (PE) and % of total POCP from Danish production and consumption.
Table 1.56. Processes within Danish production and consumption with the largest Ecotoxicity Potential (ETP), in person-equivalents (PE) and % of total ETP from Danish production and consumption.
Table 1.57. Processes within Danish production and consumption with the largest Human toxicity Potential (HTP), in person-equivalents (PE) and % of total HTP from Danish production and consumption.
Table 1.58. Processes within Danish production and consumption with the largest Nature Occupation Potential (NOP), in person-equivalents (PE) and % of total NOP from Danish production and consumption.
1.5 Uncertainty of the resultsThis sub-chapter explains the results of the uncertainty analysis performed. More detail on the actual procedures applied for uncertainty analysis is provided in Chapter 2.11. 1.5.1 Confidence intervalsApproximate 95% confidence intervals are given with the ranking results in Tables 1.2 to 1.15 (95% confidence interval given by 2 divided by the mean value). The confidence intervals are expressed as a percentage so as to give an indication of the relative uncertainty of the product group totals. This relative uncertainty can best be explained graphically, as in Figure 1.12, which is a graphical representation of the data in Table 1.15. It shows the most likely value and the range in which 90% of the data sample falls. The higher the % uncertainty in Table 1.15, the greater the range spanned by the 90% confidence interval in Figure 1.12.
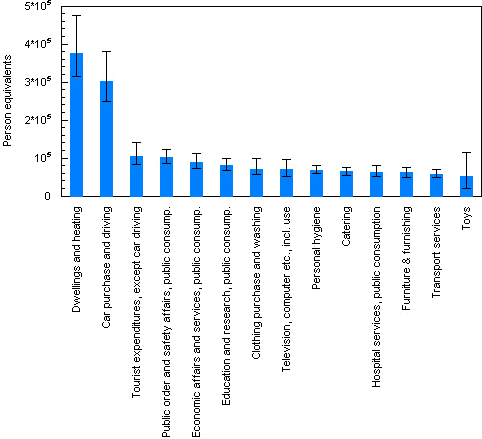
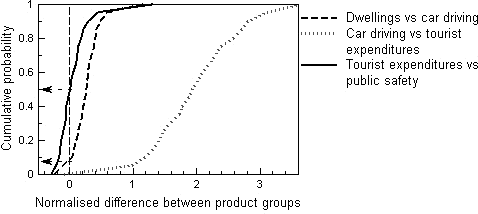
Figure 1.12. Top fourteen product groups within Danish consumption contributing to the human toxicity potential (all private consumption in Denmark, unless otherwise noted). The bars give the median value, while the whiskers show the 90% confidence intervals. The "whiskers" in Figure 1.12 show the degree of overlap between the product group totals, and is thus an indication of the reliability of the ranking. For example, there is a fair degree of overlap in the confidence intervals of "Dwellings and heating" and "Car purchase and driving", although the former is shown to contribute 30% more to human toxicity potential than the latter. The degree of overlap can be quantified by taking the normalised difference between the two product groups and plotting the resulting cumulative probability; see Figure 1.13. The point at which the normalised difference curve cuts the x = zero line gives the cumulative probability that "Car purchase and driving" always has a higher human toxicity potential than "Dwellings and heating" (approximately 10% in Figure 1.13). Conversely, this means that for 90% of the cases, the shown ranking will occur.
Figure 1.13. Cumulative probability curves of a pair-wise comparison of top four product groups shown in Figure 1.12 Looking further down the ranking list in Table 1.15, the difference between "Car purchase and driving" and "Tourist expenditure" is predicted with a high degree of confidence (no overlap in their 90% confidence intervals in Figure 1.12), which is confirmed in Figure 1.13 by the fact that the normalised difference between these two product groups lies almost completely above the zero line (99% confidence). However, the subsequent product groups shown in Table 1.15 do not differ substantially from each other in their median values. Even with fairly low uncertainty values, the small differences between the mean values of these product groups implies that it can not be stated with confidence whether one group can always be predicted to have a higher contribution to human toxicity than another. This is shown by the zero line having a y-intercept of 0.5 in Figure 1.13, i.e. about equal probability of one being higher than the other. It should be noted when interpreting the confidence intervals in the Tables 1.2-1.15 that these account only for empirical variability in the data on economic flows and emissions (see section 2.11). Uncertainty in the final use stage (both economic and emissions data) is not included in the analysis, and neither is the uncertainty of the impact assessment factors used to calculate the impact potentials. Including these later steps would be likely to reduce the uncertainty further, since the aggregation involved has the effect of "levelling out" the high uncertainties in some of the economic and emissions data, without adding to the overall uncertainty. The confidence intervals reported in the tables are calculated for the particular product group, normalised by an average product group. This normalisation step is carried out because it removes the distorting effect of uncertain elements common to all the product groups. However, the effect of this is limited in this analysis (there is very little difference between the actual confidence interval of the product group alone and the confidence interval of the ratio). If the uncertainty of impact assessment had been included, the normalisation step would be of larger importance, since it would introduce a large amount of uncertainty common to all product groups. Generally, the difference between the product groups are so large that their overall position in the prioritisation (among the 10 most important, among the 20 most important etc.) is very stable, even for product groups where the environmental impact is determined with relatively large uncertainty. 1.5.2 Causes of the highest variations in the resultsIn addition to giving an indication of the reliability of the observed ranking, the uncertainty analysis provides information as to where the highest variations are occurring, and thus where efforts can best be focussed to reduce the uncertainty. Unfortunately, the very large number of data inputs in the model and the consequent very high computer memory requirement, has made it impossible for us to apply a complete correlation analysis, as would typically be the case in an uncertainty importance analysis. Instead, we have done this manually, by identifying which product groups are calculated to have high variation and then moving backwards through the calculations to identify those data on emissions and economic flows contributing to that particular product group that have disproportionately high variation. The causes for these high input variations were then investigated. For example, in Figure 1.12, "Toys" stand out as having a particularly wide confidence interval. With a coefficient of variance of 0.53, "Toys, DK private consumption" has the highest variance of all product groups with respect to human toxicity potential. Looking back one level into the calculation, it can be seen that "Toys" is the most uncertain product group in both "human toxicity water" and "human toxicity soil". Looking further back at the individual emissions, mercury emissions to soil and water both show up with high variance for "Toys". Notably, the uncertainty in mercury emissions for "Toys" is higher than for most other mercury emissions, because the data on economic flows for “Toys” is also relatively uncertain due to the large number of diverse products included in this group. However, other emissions contributing to human toxicity are shown to have higher uncertainty than mercury (e.g. Cu to air at a coefficient of variance of 0.79), but these do not show up with high relative uncertainty for the product group "Toys". This indicates that a product group with high mercury emissions is causing the high uncertainty in this product group. On the side of economic data, a number of product groups with high variability contribute substantially to "Toys", notably "Industrial machinery", with a coefficient of variance of 0.86 for its supply to "Toys, gold and silver articles etc.". In general, what is dominating the overall uncertainty depends on the particular impact category and the particular product group. For certain impact categories one emission can be clearly seen to dominate the uncertainty. For example, the higher than expected uncertainty values for global warming are primarily a result of a very high uncertainty estimate for nitrous oxide emissions. This explains why various farming and food related product groups account for all but three of the top thirty product groups showing the highest uncertainty on global warming. However, identifying one emission with a far higher uncertainty than the other emissions is not always sufficient to explain the dominant source of uncertainty, as e.g. for acidification. Here, even though ammonia emissions are estimated with far higher uncertainty than the other emissions contributing to acidification, sulphur dioxide emissions are the most significant source of uncertainty for the product group with the highest acidification uncertainty (“Car driving for holidays abroad”). This is because in an uncertainty importance analysis, the magnitude of the emission is as important at its uncertainty. For photochemical ozone formation, the uncertainty estimates for non-methane VOC are somewhat higher than the other emissions contributing to this impact category, although this is less marked than for global warming and acidification. Nonetheless, it is sufficient for non-methane VOCs to account for "Hairdressing etc. in DK, private consumption" showing up as the product group with the highest photochemical ozone formation uncertainty. For ecotoxicity, human toxicity and nutrient enrichment, many highly uncertain emissions contribute. For these impacts the overall uncertainty is therefore more a function of which product groups have high emissions of a particular emission type, rather than the uncertainty of predicting that emission. It is also difficult to generalise the relative uncertainty importance of the economic data versus the emissions data. In certain cases, such as the high acidification uncertainty predicted for "Car driving for holidays abroad", it is clearly the economic data that dominates. This is because the emission type showing up with the highest uncertainty importance (in this case sulphur dioxide) has a relatively low emission data uncertainty. However, where the overall uncertainty of the product groups is dominated by a substance with high emission uncertainty estimates, the relative importance of the emission data uncertainty and the economic data uncertainty is more difficult to gauge without further analysis. 1.5.3 Uncertainty from looking at one single yearBesides the quantitative uncertainty analysis reported above, we have also investigated to what extent the results of the prioritisation is influenced by the fact that we have used data for one specific year only (year 1999). If one industry had an unusual low output in year 1999, this could mean that its impact would be underestimated, and vice versa an unusual high output could mean an overestimate of its impact in a life cycle perspective. This would be especially true for products with a lifetime beyond one year, where large variations in consumption could occur. We therefore analysed the production volume in fixed prices in the period 1990-1999, to see if 1999 was an untypical year for any particular industry. Here we define untypical as a deviation of more than 12% over the average of the last 3 years). Using this definition, we found that following industries with particularly high outputs in 1999 (with percentages above the average of the last 3 years in brackets):
In the few cases were these industries appear on the lists of highly prioritised industries in chapters 1.2 to 1.4 a decrease in output of 18-22% would only imply moving one step down on the lists. Even the highest variation in output (for office machinery and computers) would not move the position of this industry notably. This is due to the fairly large differences between the top-ranking industries, in terms of environmental impacts. We thus conclude that the prioritisation has not been notably influenced by the possible overestimation of the environmental impact from these industries due to an untypical high output in year 1999. Industries with particularly low outputs in 1999 were (with percentages below the average of the last 3 years in brackets):
As for the industries with untypical high outputs in 1999, these small percentage variations are not enough to influence the prioritisation notably. We similarly analysed the Danish consumption in fixed prices in the period 1990-1999, and found only few consumption groups that were atypically high in 1999, notably insurance, computers and renting of machinery and equipment. As above, the variations were not of a size that could influence the prioritisation. We did not find any product groups with a particularly low level of consumption in 1999. 1.6 Comparison with results of previous similar studiesOther previous studies with similar objectives, i.e. to identify the most important product groups from an environmental perspective, include Hansen (1995a) and Dall et al. (2002) for Denmark, Finnveden et al. (2001) for Sweden, Nijdam & Wilting (2003) for the Netherlands, Nemry et al. (2002) for Belgium, and Labouze et al. (2003) for EU. The Swedish and Dutch study use the same general methodology as our study (IO-analysis) while the remaining studies use a bottom-up process based analysis. Due to the environmental indicators used (energy consumption and resource loss) the product groups that are ranked high by Hansen (1995a) are those with either large energy consumption or which are destroyed or dissipated during use. This includes the main energy carriers, transport activities (represented by the vehicles including their use phases), fertilizers, animal feeds, meat and dairy products, and building materials. These items are also ranked high by our study (see Chapter 1.2.1), although under slightly different names, for example we regard electricity and heating as the products to be ranked, while Hansen (1995a) ranks the energy carriers including their use phase. The focus on resource loss implies that Hansen (1995a) ranks some products high for which a large part of the material volume is dissipated, such as detergents, newspaper, beer and furniture. Such products do not appear as high in our prioritisation. Dall et al. (2002) have a consumption perspective and include only private consumption. The study focuses mainly on energy consumption and concludes that food, car driving, and housing are the most important product groups, which confirms our findings. Also clothing and personal hygiene appear high in energy consumption. The aggregation of product groups, as well as the differences in methodology, makes it difficult to perform further comparisons at a more detailed level. The product groups that are ranked high by Finnveden et al. (2001) for the emissions of CO2, SO2 and NOx, are electricity and heat, food, dwellings, transport activities, and hotels and restaurants, which are also ranked high by our study. The fact that retail trade and public services, such as waste handling and recreational activities, also come out high in the Swedish study is probably due to the specific infrastructure of the Swedish economy. Finnveden et al. (2001) also rank the product groups according to emission intensity, and here we find transport by ship at the top of the list, similar to our results. Also construction materials, fish & seafood, metals and agricultural products are ranked high on impact intensity by both Finnveden et al. (2001) and our study (Chapter 1.2.5). When considering the ranking by CO2 and SO2, it is also not surprising to find electricity and heat among the important products (see our Tables 1.18 and 1.26). It is less expected that transport by air and road appear among the products with high impact intensity. However, air transport would be the next item to be included if the list in Table 1.18 had been expanded, and also freight transport by road is in the same order of magnitude. Swedish pulp and paper industry also appears to have a relatively high impact intensity. The corresponding Danish industry has a completely different product composition (more finished products), which explains its lower impact intensity. Tourist expenditures and car driving (private fuel use) does not appear in the Swedish ranking, since these product groups were not included in the Swedish data. Nijdam & Wilting (2003) use a number of environmental indicators, including global warming, acidification, nutrient enrichment and photochemical ozone. For global warming they find the most important consumption groups to be food (30%), followed by leisure (22%, mainly due to transport for holidays), and housing (17%; mainly for heating and electricity), confirming our main findings (see Chapter 1.2.2). The study applies the same general methodology as our study (IO-analysis) and their detailed reporting of consumption data and environmental impact intensities should therefore allow a more complete comparison between Dutch and Danish consumption, which is, however, not possible within the limitations of the current study. Nemry et al. (2002) and Labouze et al. (2003) find dwellings and transport to be the most important product areas, which confirms our finding in spite of a completely different methodological approach (bottom-up process analysis). This points to these two product areas as being of such size that they are likely to appear in any priority list, despite differences in methodology and data basis to derive these lists. Nemry et al. (2002) do not include food products in their ranking, while Labouze et al. find food products to be the largest source of eutrophication (due to fertilizer application) and a large source of global warming and photochemical oxidation (due to enteric fermentation and manure management). Nemry et al. (2002) furthermore point to packaging and electrical appliances as important products, while Labouze at al. (2003) find textiles among the largest sources of acidification and photochemical oxidation. This may be seen as corresponding to the importance assigned to wholesale trade (partly due to packaging use), electricity, and clothing in our study. Due to the differences in methodology, correspondence between the results would not be expected at a more detailed level. 1.7 Implications of the results for important product groups1.7.1 IntroductionIn this sub-chapter, we discuss the improvement options for the product groups identified in Chapters 1.2 and 1.3 as having high environmental impacts. This should not be seen as an exhaustive treatment of all current activities and improvement options, but rather as tentative indications on constructive ways to apply the results of the prioritisation. To be relevant for product-oriented environmental policy, a product group must have both high total impact and high impact intensity. Surprisingly, this is the case for most of the top-10 product groups in Chapters 1.2 and 1.3. Notable exceptions are “Education and research” which, as already mentioned, has a high level of aggregation that places it high in total impacts in spite of a low impact intensity (and thus with an inherently lower relevance for specific policy interventions) and tobacco products and fireworks that have high environmental impact intensity, but a low volume that make them less relevant for a policy intervention, although pointing to these two product groups being under-priced compared to their environmental externalities (which are not even completely covered by the impact categories applied in this study, which does not include such issues as noise and the health impacts from passive smoking). The top-10 product groups in Chapters 1.2 and 1.3 account for a surprisingly large share of the total environmental impacts from Danish production and consumption. In the supply perspective, ranked according to total impacts, the top-10 product groups (out of a total of 138) account for 45% of the total environmental impact from Danish production and consumption. In the consumption perspective, ranked according to total impacts, the top-10 products groups (out of a total of 98) account for 57% of the total environmental impact from Danish consumption, and 25% of the total impact from Danish production and consumption. This implies that the product-oriented environmental policy may reach large improvements by focussing on this rather small number of product groups. Generally, there are large improvement potentials for all the priority product groups, generally falling within the following categories:
In one of the more thorough, recent studies in cleaner technology options, Phylipsen et al. (2002) also concluded that there is still significant potential to reduce the environmental impact by “traditional” material technologies, such as more efficient material production, material-efficient product design and material recycling. 1.7.2 FoodBoth in absolute terms and in terms of impact intensity, food appears as the most important need group. Also from the production perspective, a major share of the total environmental impacts is related to food products. Both from the consumption and net production perspectives, pork meat is the most important food item. In the lifecycle of pork, pig farming is the most important process, with nature occupation (from fodder production) and nutrient enrichment (mainly from nitrogen compounds in the form of nitrate to water and ammonia to air) as the most important impact categories. To reduce the land (and thus nature) area appropriated for pig production, it is necessary to apply technologies for fodder production that demand less area, i.e. have a higher yield per land area. The main components of animal feed are protein and carbohydrates. Protein production today is largely based on soybeans and other legumes while grains are the most important sources of carbohydrates. Reductions in area use for both protein and carbohydrate crops can be achieved by selection of crops, crop varieties and growing conditions with high protein and/or carbohydrate yields per hectare. Given the large variation in these parameters, this appears the most straightforward improvement option. Options that utilise non-agricultural protein and carbohydrate sources may be relevant for specific purposes (such as fish fodder), and as a possible long-term relief. It is possible to produce protein independent of arable land, by microbial conversion of natural gas, a process normally occurring under deep-sea conditions. A Norwegian company, Norferm, has developed an industrial chain imitating this natural conversion process (www.norferm.no). The reaction also requires ammonia, oxygen and some minerals. The product has high protein content and a balanced amino acid composition, which makes it suitable in feed for fish, pigs and chicken, and in human food. Although carbohydrate production does not have similar opportunities to become completely independent of land use, it is possible to produce carbohydrate feeds from cellulose by a process involving low-temperature thermal treatment and enzymatic hydrolysis (a different process than the microbial degradation of cellulose in ruminants, but with the same result). Reduction or separation of lignin and tannin in the cellulose raw materials is necessary, since these substances reduce digestibility. With this process, straw and forest products can be used as raw materials for carbohydrate feeds, thus relieving some of the pressure on agricultural land. Currently, the cellulose-based process it too expensive, but research is ongoing to improve the process efficiency (Palonen et al. 2004). Another option in the same line of thought is the direct use of forestry by-products, such as leaf protein, as food and feed sources (Speedy & Pugliese 1991). With nitrogen often being the limiting factor for agricultural yields, there is a natural incentive to economize with this resource and thus to avoid emissions. Nevertheless, it has been pointed out that there are still significant improvement potentials and also many available technologies that are not yet fully implemented (Skov- og Naturstyrelsen 2003). Imported meat also appears as one of the most important food products in terms of environmental impacts, with the same impact categories being important as for domestic pig production, namely nature occupation and nutrient enrichment. This points to the same kind of improvement options, although it is obviously not possible to influence foreign producers of meat by direct incentives, leaving supplier requirements as the most relevant way to reduce these impacts. In Denmark, production of beef meat mainly takes place at the dairy farms, which also appear as important contributors to the total environmental impacts related to food products. Here as well, the most important impact categories are nature occupation and nutrient enrichment, thus pointing to the same kind of improvement options as for pig farms. Dairy farms are constrained by production quota, which implies that these farms can best be influenced through incentives directly targeted at the farms, or through labelling initiatives. Other important product groups within the need group “food” are:
For these product groups, it is still nature occupation and nutrient enrichment that are the most important impact categories, although both the energy related impacts and ecotoxicity (from pesticide use) are relatively more important for these products than for the pure meat products. Measures aimed at reducing food spillage throughout the value chain will obviously also reduce the demand for primary production. In the food industries, cleaner technologies for resource savings and waste minimisation traditionally focus on better housekeeping options e.g. more efficient use of raw materials and improved waste segregation. Especially efficient blood handling and recovery and minimised water use in eviscerating have been applied. Nevertheless, improvement potentials are still assessed as being high. Also in dairy industries, further possibilities for product recovery exist, while in brewing most options are assessed to be already implemented (EurEco et al. 1998). Car driving for shopping is also among the large contributors to the overall environmental impact from the need group “food”. Obvious improvement options are alternative distribution systems for groceries, e.g. direct delivery. For other improvement options for car driving, see Chapter 1.7.9. Imported vegetables and fruit, both fresh and processed, do not reach the top-10 lists of environmental impact, but are still among the more important items within the need group food. For these products, nature occupation plays a less important role, while nutrient enrichment is still important, and both the energy related impacts and ecotoxicity (from pesticide use) appear among the important impact categories. Several other agricultural products appear high on the lists of high environmental impact intensity (Chapters 1.2.5 and 1.4.2). For all of these products, the picture is the same as above: For meat products (including eggs), nutrient enrichment and nature occupation dominate, while for other food products, pesticides play a relatively more important role. In Denmark, pesticide use has been the topic of action plans aiming at reduced use. Potentials for further reduction in pesticide use are assessed in Christensen & Huusom (2003). 1.7.3 HousingAs a need group, housing appears as having the third largest environmental impact after food and leisure (see Figure 1.3 in Chapter 1.2.4). The main part of the impacts comes from the construction, repair and maintenance of the dwellings, except for the energy related impact categories where heating has a substantial contribution. The most direct way of reducing the environmental impacts from heating are savings in consumption, for which substantial potentials exist, both by improvements in construction and in user behaviour, as demonstrated by large variations in heat consumption per m² dwelling (Hans Bjerregård Rådgivning ApS 2001). Substitution of the heat source towards more renewable energy sources is also an obvious possibility. The actual construction, repair and maintenance processes also involve some energy use, but the main impacts relate to the materials and equipment used, notably wood products, basic non-ferrous metals, plastics, cement, bricks and tiles. A building is a very complex product, and improvement options will often require coordination between large numbers of actors. Realising this, buildings were one of the first areas where the Danish Environmental Protection Agency initiated a product panel (see www.byggepanel.dk). Both the panel and a recent status report (Øhlenschlæger 2003) point to the need for more knowledge dissemination, and stronger and more far-sighted regulatory incentives. Imported wood products and textiles receive a high ranking on ozone depletion (see Table 1.52 in Chapter 1.4.4), which is mainly due to fumigants (methyl bromide) and solvent use (methyl chloroform), respectively. These uses are generally being phased out as a result of the Montreal protocol. Basic non-ferrous metals are treated separately in Chapter 1.7.4. The most important emissions in relation to plastics are the VOC emissions occurring from liquid resin mixtures prior to their full polymerisation. Several VOC emission reduction options exist, both preventive (modifying process equipment and conditions) and end-of-pipe (combustion). The environmental impact from cement, bricks and tiles are mainly due to energy-related emissions of CO2 and SO2. Recycling is the most obvious option for reducing energy use for bricks and tiles. For cement, a low-energy alternative based on magnesite has been developed by an Australian company, Tec Eco, (www.tececo.com). Furniture and furnishing is also included in the need group “Housing.” The main environmental impacts of his product group are due to the components of imported wood, textiles and basic non-ferrous metals, all mentioned above. 1.7.4 Basic non-ferrous metalsThe basic non-ferrous metals industry, generally outside of Denmark, appears as having high impacts in the impact category “human toxicity.” This is mainly due to emissions of mercury to soil, mainly from primary extraction, smelting, casting and primary processing of aluminium, zinc, copper, gold and silver. Mercury has been the subject of an international study (UNEP 2002) and UNEP is presently initiating and implementing a mercury programme (www.chem.unep.ch/mercury/). The most obvious way of reducing the mercury releases from the basic metals industries is to increase the recycling of these metals, thus completely avoiding the primary processes. This would also reduce other emissions. The substitution of metals by e.g. new composites will have the same effect. The major non-industrial technique for gold extraction in South America (especially the Amazon), China, Southeast Asia and some African countries is mercury amalgamation, since it requires little start-up investment and very little technical know-how. Alternative extraction methods exist, but banning the use of mercury has not proven successful. Instead, UNEP (2002) recommends preventive measures such as educating the miners and their families about hazards, and putting in place facilities where the miners can take concentrated ores for the final refining process. We are not aware that anyone has considered product-oriented measures, such as a certification scheme allowing the processing technology to be traced, but the accounting systems applied in the processing of precious metals could be copied to the raw material extraction with major reductions in exposures and losses. 1.7.5 Transport by shipTransport by ship is an environmentally important part of the Danish production, both in absolute terms and in terms of impact intensity. The most important impact categories are ecotoxicity (mainly due to the antifouling agent tributyltinoxide (TBTO)) and acidification (due to emissions of SO2 and NOx), while the other impact categories, except nature occupation, are also of importance. The issue of TBTO is well recognized and in Denmark a ban was already enforced from 1991 for ships below 25 meters. The 2001 International convention on the control of harmful anti-fouling systems on ships (IMO 2001) requires that by January 2003, all ships shall not apply or re-apply organotin compounds in anti-fouling systems, and by January 2008, such compounds shall either be removed from the hulls or protected by a coating that prevents leaching. Although this convention does not come into force before a certain number of countries have ratified it, the EU has decided to put the convention into force already on their own territory (CEC 2002a). Alternatives to TBTO are currently being developed (for Danish research see Højenvang 2002, Madsen et al. 2003, Allermann et al. 2004) and the European paint manufacturers have created a web-site informing on TBT-free alternatives. The emissions of SO2 and NOx from marine fuels are larger than those from comparable amounts of fuels used in land transport. For SO2, the emissions from ships in European waters in 2010 will correspond to 75 % of the total emissions from the EU land-based sources (CEC 2002b). This is due to the lack of comparable regulation on marine fuels and engines. The European Commission has adopted a strategy to reduce emissions from seagoing ships (CEC 2002b). The main aim of the strategy is to reduce the impact of ship emissions on local air quality and acidification through the reduction of the sulphur contents of marine fuels used in the EU (2002c). For NOx and SO2, there are sufficient improvement options in the availability of cleaner fuels and advanced emission-control technologies already required and upcoming for heavy-duty diesel trucks and buses. In fact, engine manufacturers state “it is essential that engine emission standards be implemented to allow technologies to transfer in an orderly manner from on-highway applications, to nonroad applications, and then to marine applications” (French 2001). For all energy-related impact categories as well as ozone depletion, international requirements for pollution prevention are contained in Annex VI of the MARPOL convention (international convention for the prevention of pollution from ships). It contains requirements for NOx and VOC emissions, sulphur content of fuel, fuel oil quality, emissions of ozone depleting substances (although HCFCs will be allowed until 2002), ship incinerators and International Air Pollution Certificates. Annex VI is not yet in effect internationally, but the target date for implementation is 2004. In an extensive study on reduction options for greenhouse gas emissions, Skjølsvik et al. (2000) identified reduction of speed in general as the single measure that results in highest reduction of CO2 emissions. In general, improved fleet planning could yield more reduction than improved hull and propulsion designs, which also have a longer implementation time due to the long lifetime of ships. Emissions from ships in harbours have been investigated for Danish harbours by Oxbøl & Wismann (2003) and for the EU by Whall et al. (2002). The shares of total ship emissions are generally below 6%. Oxbøl & Wismann (2003) note that pumping of liquid goods cause 59% of the harbour emissions of SO2 and 36% of the harbour emissions of NOx, and recommend increasing the use of land-based power supply. The above considerations also apply to the operation of navy ships, classified under the public industry “Defence, justice, public security and foreign affairs,” which feeds into the public consumption group “General public services, public order and safety affairs.” Besides the production and maintenance of the transport equipment (ships and boats), refining of petroleum products is the most important upstream process feeding into transport by ship (and other forms of transport, see also Chapter 1.7.9). Variations in refinery emissions deduced from the data reported in Frischknecht (1996) point to significant improvement options. The degree of heat recovery and co-generation is especially important. The refinery BREF (EC 2001) list production techniques and has a special focus on abatement techniques for air emissions. 1.7.6 Wholesale tradeWholesale trade has a relatively large environmental impact, mainly due to a large consumption of transport and packaging, and to a lesser extent consumption of advertising and buildings. Improvements are thus mainly dependent on improvements in, and more efficient utilisation of, these upstream supplies, i.e. especially choice of transport and packaging solutions, and choice of suppliers with lower environmental impacts. Regarding transport, special attention should be given to reduce road transport, e.g. by shifting to rail transport, and to choose suppliers of ship transport with less environmental impact. Regarding packaging, special attention should be given to reduction in or substitution of metal and paper packaging. Both these material categories are also in focus of the EU directives on waste and packaging, and re-use and recycling targets are enforced. A recent study (Petersen and Jørgensen 2004) shows that collection of waste package at source e.g. factory, office or household, together with municipal waste, gives the best results. 1.7.7 ElectricityThe dominating environmental impacts from electricity production are global warming and acidification. Regulation of these environmental impacts needs to be directly targeted at the electricity producers, except where it is possible to create separate markets for environmentally preferable power, as e.g. Københavns Energi has done for photovoltaic-based electricity. There is already significant regulation of the electricity industry, including quotas on CO2, SO2 and NOx. Increased focus on CO2 emissions is likely to favour the competitiveness of wind power, which is perceived as an important part of a sustainable power supply (Eltra 2004, MVTU 2003). Photovoltaic cells are another development area with a promising environmental profile, although farther from being economically competitive (PA Energy 2004). 1.7.8 Industrial cooling equipmentThe main reason that industrial cooling equipment is singled out as a product group is that it is practically solely responsible for the contribution to ozone depletion from Danish activities, or for 29% of the total ozone depletion potential related to Danish production and consumption (the remaining 71% is due to foreign activities related to imports to Denmark). In our base year, 1999, the substances HCFC-141b and HCFC-22 were both used, while in 2002, the use of HCFC-22 has been discontinued, resulting in an approximate halving of the total consumption compared to the years before that (Poulsen 2004). We do not have any information to reveal which applications of industrial cooling equipment the HCFCs are actually used in, which means that it is distributed evenly per DKK over the buyers of industrial cooling equipment. For this reason, we are also unable to say whether it is correct that the Danish production of motor vehicle trailers appears as one of the more environmentally intensive product groups, which is for a large part due to the consumption of industrial cooling equipment in this industry. 1.7.9 AutomobilesBoth in absolute terms and in terms of impact intensity, car purchase and driving is an environmentally important part of the Danish private consumption. The emissions from fuel combustion during driving are dominating the energy-related impact categories, especially photochemical ozone formation due to the VOC emissions. The vehicle production itself also contributes significantly to the overall impacts, both due to its chemicals use (VOC emissions), energy use (especially electricity) and materials use (aluminium and steel). The most direct improvements option is to focus on reducing the need for car driving (Banister & Marshall 2000), through physical planning that reduce attractiveness of car driving (Paulley & Pedler 2000, Hartoft-Nielsen 2001a, 2001b, 2002, Christensen 2001), mobility management (Rambøll Nyvig A/S 2002, Grell & Kjerulf 1999, VTPI (2004); see also http://www.epommweb.org), and improving the distribution of retail goods. The emissions from car driving may be substantially reduced through improved fuel efficiency. The EU Commission has negotiated a voluntary agreement with the European, Japanese and Korean vehicle producers to achieve an average CO2 emission of 140 g/km by 2008 for all new cars sold in the EU, a reduction of 25% compared to 1995. A recent EU Directive (1999/94/EC) requires comprehensive labelling for all new cars providing information on carbon dioxide emissions and fuel economy. Weight reduction is one of the most practical ways to increase the fuel economy of vehicles, and is thus complementary to the efforts to reduce chemical, electricity and materials use in vehicle production (Fox & Cramer 1997). 1.7.10 LeisureLeisure is the second most important need group according to figure 1.3 (Chapter 1.2.4). A large share of the impact is due to car driving, both in Denmark and on holiday abroad. Leisure accounts for the largest share of car driving. Car driving has been dealt with separately in Chapter 1.7.9. As an important improvement option, mobility management could be applied by leisure service providers. For inspiration, it may be noted that the Swiss Federal Office for Spatial Development has initiated a leisure traffic programme (www.are.admin.ch/are/en/verkehr/freizeitverkehr/). Another large share of the impacts in the need group “leisure” is due to tourist expenditures by Danes travelling abroad. These expenditures relate to goods and services purchased while travelling abroad. Food, transport and accommodation account for the most important impacts. Significant coordinated improvements are only realistic for package tours that include one or more of these items. Current green tourism initiatives such as the Tour Operators Initiative (www.toinitiative.org) and the European VISIT initiative (www.yourvisit.info) focus mainly on the accommodation site and have no requirements in the food area and only minor focus on transport / mobility management. Separately from these, NETS, the Network for Soft Mobility in European Tourism (www.soft-mobility.com), focus specifically on the transport aspects. Thus, there is an apparent need for more coordinated efforts that integrate all environmental aspects of tourism, including the important role of food. Although less important in terms of overall size within the need area “leisure”, pet foods have high environmental impact intensity (see Chapter 1.2.5). In terms of environmental impacts and improvement options, pet foods are very similar to human foods (see Chapter 1.7.2). Also recreational items n.e.c. have a high impact intensity for ecotoxicity (mainly due to copper in lost fishing gear), ozone depletion and photochemical ozone (mainly from plastics production for Christmas decorations and similar items). A complete substitution of copper in fishing gear should be possible. Ozone depleting substances are generally being phased out due to the Montreal protocol. VOC emission reduction options for plastics were mentioned already under housing (Chapter 1.7.3). Fireworks also have high impact intensity, mainly due to copper and VOC emissions during use. The only realistic improvement option appears to be a reduction in consumption. 1.7.11 ClothingClothing is the fifth most important need group and has a relatively high impact intensity (see Chapter 1.2.4). The largest part of the impacts is caused by emissions from the foreign textile and clothing industries. The most important impacts are ozone depletion and photochemical ozone, mainly due to solvent use and the production of synthetic fibres. The ozone depleting methyl chloroform is being phased out as a result of the Montreal protocol. Improvement options have been extensively dealt with by Smith (1994), Eastern Research Group (1996), EurEco et al. (1998), and Laursen et al. (1997). A major obstacle appears to be the highly fragmented nature of the industry, which makes incentives for life cycle thinking hard to implement. Better information exchange systems appear to be an important part of any improvement programme. Detergents have high impact intensity (see Chapter 1.2.5), which is again mainly caused by solvent use and VOC's in surfactants. Several VOC emission reduction options exist, both preventive (substitution, modifying process equipment and conditions) and end-of-pipe (combustion). 1.7.12 HygieneHygiene is the sixth most important need group and has relatively high impact intensity (see Chapter 1.2.4). The most important contributions come from detergents and other chemical products (see Chapter 1.7.11), and energy use for hot water and sewage treatment (removal and disposal). Energy use for sewage treatment is also the main reason for toilet flush having high impact intensity (see Chapter 1.2.5), although the toilet paper and the nitrogen and phosphorous content in the flush is also of importance. For energy use there is large variation in impacts depending on the heat source, and thus much room for improvement through substitution of heat sources, especially the use of photovoltaic energy. For toilet paper, criteria for environmental labelling exist. 1.7.13 Education and researchEducation and research only reaches the top-10 of environmental impact in Danish consumption because it is a very aggregated product group. In itself, education has very low environmental impact intensity (see chapter 1.4.2) and would not have reached the top 10 if it had been divided into primary, secondary and higher education, and adult education etc. Nevertheless, since it is a relatively homogeneous product group, it may still be relevant to look for improvement potentials that may be implemented with small effort for the entire product group. However, a closer analysis reveals that the impacts come from many different sources, with no source particularly dominating, although buildings, heating, electricity and paper use are the largest contributors. Thus, improvements would require implementation of rather extensive environmental management systems, which may be out of proportion to the importance of the area. However, implementing such systems particularly in this field will have an additional educational effect, which may make it worthwhile in itself. 2 Methodology2.1 Introduction 2.1 IntroductionThe main objective of the project was to establish and apply a method for prioritising product areas and product groups where Danish measures will give the largest improvement for the environment. The method is based on environmentally extended Input-Output tables, also known as NAMEAs (National accounting matrices including environmental accounts). This chapter outlines the methodology applied, and the critical methodological decisions made during the project. 2.2 National accounting input-output tables (IO-tables)Input-output tables (or short: IO-tables) give an overview of the trade in national economies. The IO-tables are based on the reports on bought and sold products, which the national statistical bureau (in Denmark: Statistics Denmark) receives from the individual industries. IO-tables report the monetary value of the products sold and bought within each sector of the economy. For illustration of the principles, Table 2.1 shows a simplified IO-table for Denmark with 6 production industries. The full IO-table for Denmark has 130 industries and 107 different types of final use and is published every year by Statistics Denmark. Table 2.1: A simplified input-output table for Denmark, 1975 (Lihn Jørgensen, 1982). All figures in 1*109 DKK.
The rows show the total sales from each supply sector (divided in domestic production and import). The columns show the value of the input to each demand sector (the same domestic production sectors as in the rows, plus some categories for final use). For example, Table 2.1 shows that Danish agriculture in 1975 sold goods worth 24 billion DKK in total. The majority of these goods were bought by Danish industry, which purchased an amount worth 15.7 billion DKK. Of the remaining sales, 3.0 billion DKK were purchased by Danish colleagues within the agricultural sector, and products worth 3.1 billion DKK were exported. Since the production in one sector is based on inputs produced in all other sectors, and these again buy from all other sectors and so on, the IO-table can also be viewed as a very complete product life cycle for all products in the national economy. This is illustrated in Figure 2.1.
Figure 2.1: The direct demand for an industry product and the related, indirect demands for inputs from all industries. Figure based on Treloar (1998). In Figure 2.1, starting from the purchase of a product worth 1 DKK from industry, the lines can be followed backwards (to the right in the figure) as it affects all other production sectors, which again affect all other sectors, etc. Using IO-tables as a starting point for analysing interrelationships in an economy and the importance of different product groups is known as Input-Output Analysis (IOA). When the IO-tables are supplemented with environmental data for each sector (resource consumption and emissions per DKK produced by each industry), the total environmental exchanges can be calculated for those products from each sector that go into final use, i.e. the data that we need for prioritisation between product groups. The name “Environmental IOA” is used when the IOA is applied to environmental issues, as in this project. As a “top-down” approach it allows a complete allocation of all activities to all products. IOA has the advantage of being complete with regard to inclusion of all relevant activities related to a product. On the other hand, the IOA cannot deal with very specific questions, since it relies on a grouping of activities in a limited number of industries. This makes it difficult to use for detailed studies, such as environmental product life cycle assessment (LCA), except for very homogenous industries. Also, the necessary environmental statistics are not always available, which means that for some environmental exchanges, adequate information may be missing. Instead, LCA has traditionally been performed as a “bottom-up” process analysis, based on linking the specific processes in a supply chain. A significant advantage of such process analysis is exactly its capability for detail. However, a major problem in process-based LCA is the likelihood that important parts of the product systems are left out of the analysis, simply because it is a very difficult task to follow the entire supply chain in detail (Lenzen 2001). Combining process-based LCA and IOA in what has become known as “hybrid analysis” can yield a result that has the advantages of both methods (i.e. both detail and completeness). For a project that is to prioritise among all product groups in an economy, the IOA approach is inherently better suited than LCA, but the results may still be improved by adding further detail via LCA-data as suggested in Chapter 2.6. IO-tables supplemented by environmental data are also known as NAMEAs (National accounting matrices including environmental accounts). NAMEAs can be produced when environmental data are available for the same industries as in the IO-tables. A Danish NAMEA is published annually by Statistics Denmark. The most recent NAMEA available, at the time of this project, was for the year 1999 (Danmarks Statistik 2003a), which was therefore chosen as basis year for our further work. 2.3 Limitations of IO-tables for environmental analysisTo use IO-tables or NAMEAs as a basis for environmental analysis involves a number of limitations, some which are inherent to the methodology, and some have to do with data availability. Most of these limitations may be overcome by adjusting and expanding the NAMEAs, as we have sought to do in this project. In terms of data availability, the main limitation of the official Danish NAMEA is the coverage of environmental exchanges, which is limited to specific air emissions. We have added more environmental exchanges, aiming for the same degree of completeness as in the normalisation reference for Denmark provided by the Danish LCA methodology EDIP (Hauschild & Wenzel 1998, Stranddorf et al. 2001). This is described in detail in Chapter 2.5. An important limitation is the assumption of homogeneity of the industries, i.e. that all products from an industry are assigned the same environmental impact per DKK. The higher the level of aggregation of industries, and the more diverse the industry in question, the more erroneous this assumption will be. This is the main reason for attempting to subdivide such industries, as described in Chapter 2.6. Some of the accounting conventions applied in the national accounts are also less appropriate for environmental IOA, and need therefore to be corrected, as described in Chapters 2.4, 2.6 and 2.7. An important assumption of traditional IOA is that imported products are produced in the same way as the similar domestic products, although it is well-known that emission factors (e.g. CO2/DKK) can vary significantly from country to country due to differences in geographic and administrative conditions, industries composition, applied technology, management systems and sizes of production units. For example, in a traditional Input-Output analysis, the Danish textile industry's purchase of cotton will be treated as if the cotton was produced by Danish agriculture. The import assumption is especially problematic in very open economies with large imports and exports, such as the Danish. A possible solution to the import assumption is to link the Danish IO-table to foreign IO-tables, thus obtaining a more realistic picture. This solution is discussed in more detail in Chapter 2.8. Further, using monetary IO-tables to represent physical flows of commodities between industries implies an assumption of proportionality of monetary and physical flows. For example, 100 DKK electricity bought by the fertiliser industry is assumed to lead to equal amounts of electricity supplied as 100 DKK spent on electricity by travel agencies. However, electricity prices vary considerably amongst industries, thus violating the proportionality assumption. The associated uncertainty can in principle be overcome by replacing the monetary entries in all basic IO-tables with entries in physical units. However, such physical IO-tables are not produced on a regular basis in Denmark. Only for energy related air emissions, the NAMEA relates to physical flows of specific fuels based on the Danish energy matrices, which are provided in both economic and physical units. In connection to the subdivision of industries, described in Chapter 2.6, we have sought to isolate physical product flows related to other specific emissions, such as ozone depleting substances from refrigeration. Finally, using retrospective IO-tables to answer prospective questions like the one we pose with this project: “What environmental measures will give the largest reductions in environmental impacts?”, may lead to wrong results, since some of the processes included in the IO-table may not be able to change in response to market-based environmental measures. This problem can be overcome by adjusting the input-output relations to reflect the actual prospective market reactions, as described in Chapter 2.9. 2.4 Including unclassified importsIn the Danish IO-table, a number of imported items are not distributed over the 130 industries, due to lack of information, and would therefore not enter into the analysis. We have therefore made our own distribution of these imports:
2.4.1 Tourism expendituresIn the IO-table, tourism expenditure is not classified by industry, in contrast to most other imports. The obvious reason for this is that the standard basis for the Danish IO-table does not provide any information on what products are bought by Danes travelling abroad. In recent years there has been several initiatives to make up for this deficit by creating Tourism Satellite Accounts (TSA), notably the convergence process of Eurostat, OECD and the World Tourism Organisation which led to a generally accepted framework in the context of the Statistical Commission of the United Nations (CEC et al. 2000). However, only few European countries have so far published such satellite accounts. Out of the countries that have a major share of Danish tourism, only Norway has published such an account (Evensen 1999). Furthermore, even when such accounts were available, they would not distinguish between visitors from Denmark and other visitors. At the moment Statistics Denmark have no plans to make a Danish TSA. Due to this lack of specific data (except for Norway), we have been forced to make some general assumptions on how the tourism expenditure is distributed over industries. These general assumptions, shown in Table 2.2, have been derived in the following way:
Table 2.2. Estimated distribution on industries of the expenditure of Danes travelling abroad (DK tourism imports)
1) The distribution is in proportion to the share in Danish private consumption, but much smaller (1/9) for business travellers. The emissions from tourism enter the calculation via the consumption of the listed items. The only exception is the emissions from fuel combustion from car driving, which are not included in the data for fuel purchase. Therefore, we have separately added the emissions from car driving abroad, see Chapter 2.5.12. 2.5 Adding more environmental exchangesTo enable a more complete environmental assessment of product groups, we have extended the coverage of the official Danish NAMEA to more environmental exchanges. The aim has been to include all exchanges that contribute significantly (more than 1.5%) to the normalisation reference for Denmark provided by the Danish LCA methodology EDIP. This normalisation reference is an inventory of the total Danish emissions contributing to the EDIP impact categories, i.e. the impact categories used in LCA studies (see also Chapter 2.10). The original EDIP normalisation reference for 1990 (Hauschild & Wenzel 1998) was updated to 1994 by Stranddorf et al. (2001). The latter was not published at the time of this project, but was available to us as a manuscript. Table 2.3 provides an overview of the substances contributing to the 1994 normalisation reference. All the substances mentioned in Table 2.3 have been included in the expanded NAMEA, except for the following four substances:
Table 2.3. Substances contributing to the 1994 normalisation reference (from Stranddorf et al. 2001)
a) gw = global warming, od = ozone depletion, ac = acidification, ne = nutrient enrichment, po = photchemical ozone formation, etwc = ecotoxicity water chronic, etwa = cotoxicity water acute, etsc = cotoxicity soil chronic, hta = human toxicity air, htw = human toxicity water, hts = human toxicity soil 2.5.1 Validating the completeness of the toxicity assessmentThe normalisation data for toxicity from EDIP (Hauschild & Wenzel 1998, Stranddorf et al. 2001) does not claim to cover all important toxic substances. To assess the completeness reached by this approach, we used the toxic release data from the U.S. Toxic Release Inventory (TRI), which covers a larger number of substances (see Suh 2003b for an assessment of the TRI coverage). The TRI 1998 data was scored using the available EDIP characterisation factors (Olsen 2003) to see whether some substances would appear as important, additional to the substances covered by the EDIP normalisation reference. We identified an error in the published EDIP ecotoxicity characterisation factors for Malathion, which has now been corrected. This procedure does not in itself provide a complete validation, since:
Nevertheless, with the current data availability, this procedure is found to be the most adequate way to validate the completeness of the EDIP normalisation data for use in this project. The results of the EDIP scoring of the TRI 1998 data can be seen in Tables 2.4-2.9. Table 2.4. Top 10 TRI 1998 emissions contributing to the total EDIP score for human toxicity via air.
Of the top 10 TRI substances contributing to more than 98% of the total EDIP score for human toxicity via air (Table 2.4), four substances are not included in the expanded NAMEA from this project. These substances (1,3-butadiene [3], n-butyl alcohol [4], formaldehyde [5] and benzene) are all volatile organic compounds. In principle, they are (or should be) already covered in the NAMEA category NMVOC. However, their human toxicity potentials (and the photochemical ozone creation potential for 1,3-butadiene) are much larger per kg than for the average NMVOC according to the Danish normalisation reference (Stranddorf et al. 2001). We would therefore recommend the separate inclusion of these substances in the Danish NAMEA. However, there are no adequate overall Danish statistics on emissions of these substances. It would be possible to include n-butyl alcohol and formaldehyde in the Danish NAMEA by applying emission factors from the FIRE data system (EPA 2000) or more simply by using emission factors derived from the U.S. TRI database for the equivalent industries. Specifically for 1,3-butadiene, emission factors can be found in EPA (1996). Due to time constraints, we have not used these procedures to include the said substances in the NAMEA in the current project. However, a closer analysis reveals that the major source of 1,3-Butadiene and formaldehyde is exhaust emissions from gasoline- and diesel-powered vehicles. In fact, Drivsholm et al. (2002) show that 1,3-Butadiene, formaldehyde and benzene account for 89% of the NMVOC impact potential for human toxicity via air from diesel trucks. The resulting EDIP characterisation factor for NMVOC's from diesel is 1.12*107 m³/g (Drivsholm et al. 2002), which is three orders of magnitude larger than the characterisation factor applied for the average NMVOC in the Danish normalisation reference (Stranddorf et al. 2001). Since 42 % of all NMVOC's come from transport (Drivsholm et al. 2002, Annex B), this points to the NMVOC characterisation factor applied for the normalisation reference being too low. We therefore recommend that a revised characterisation factor be calculated for the normalisation reference, which would lead to a larger contribution of NMVOC's to the human toxicity potential via air, compared to the 14% in the current EDIP normalisation reference (Stranddorf et al. 2001). Table 2.5. Top 10 TRI 1998 emissions contributing to the total EDIP score for human toxicity via water
The EDIP score for human toxicity via water (Table 2.5), is dominated by mercury emissions. All other substances are dwarfed in comparison. Nevertheless, out of the top 10 TRI substances, we find again two VOC's: hexane and benzene. Also three heavy metals (zinc, thallium and antimony), which are not included in the expanded NAMEA from this project, show up. Recently, the Danish EPA has published an assessment of these “second rank” heavy metals (Kjølholt et al. 2003), so some data are available if it was judged desirable to include these in the NAMEA. In the present project this has not been done. Table 2.6. Top 10 TRI 1998 emissions contributing to the total EDIP score for human toxicity via soil
The EDIP score for human toxicity via soil (Table 2.6) is dominated [6] by arsenic emissions to soil. In the Danish normalisation reference for 1994, arsenic in sludge amounted to 8% of the total, while mercury and arsenic emissions to air were dominating (Mercury and arsenic to air comes in as no. 11 and 22 in the TRI 1998 emissions). For this reason, only these two air emissions were included. The result is that only one of the top 10 TRI substances (Hg to soil) is included in the expanded NAMEA from this project. The difference in results is mainly due to the very different industry composition between Denmark and USA (Denmark does not have any primary metal extraction and manufacture, nor any production of vinyl chloride and chlorine). However, it cannot be excluded that soil emissions were underreported in the data used for the Danish normalisation reference. We would therefore recommend revisiting the decision not to include heavy metal emissions to soil in the Danish NAMEA (data is to some extent available from mass flow analyses), although the most important improvement would be to include the mentioned emissions (heavy metals to soil, vinyl chloride and chlorine to air) in the data used for imported products (e.g. based on the TRI data). The VOC's (here benzene and propionaldehyde) have already been mentioned above under the other two human toxicity scores, and the recommendation is here again to include these as separate substances or to recalculate the average NMVOC effect factor applied in the normalisation. Table 2.7. Top 10 TRI 1998 emissions contributing to the total EDIP score for ecotoxicity water, chronic
Table 2.8. Top 10 TRI 1998 emissions contributing to the total EDIP score for ecotoxicity water, acute
Table 2.9. Top 10 TRI 1998 emissions contributing to the total EDIP score for ecotoxicity soil, chronic
The ecotoxicity scores in the expanded NAMEA are all dominated by TBTO, an antifouling agent that is underreported in the TRI data. Besides this, heavy metals are the main contributors to the Danish ecotoxicity scores, with the exception of soil ecotoxicity, where pesticides play a dominating role [7]. Again, the VOC's (here hexane, toluene, formaldehyde and xylene) contribute to the EDIP score of the TRI emissions, especially to ecotoxicity water, chronic. Other major contributions to ecotoxicity that were not initially included in the expanded NAMEA of this project are: PAH emissions to water and zinc and hydrogen cyanide to air. Zinc emissions to air are readily available in the dataset provided by Pedersen (2003) and have therefore been added to the expanded NAMEA in this project. For the two other substances, it would be possible to apply emission factors derived from the U.S. TRI database, but this has not been done in this project. Hydrogen cyanide is mainly emitted from biomass incineration, but emission factors are not readily available. PAH emissions to water are mainly believed to come from road runoff and occasional fuel spillage, but no Danish statistics are available. Fuel purchase could be used as key for distribution over industries. Denmark is the globally leading producing country for malathion, which implies that these emissions would be included if a complete life cycle perspective on Danish products were applied, i.e. including the use stage of exported products. Of all malathion used, 2/3 is applied to cotton crops, implying that it is mainly part of the life cycle of textiles. We have therefore included this application specifically. We have also assessed the importance of detergents, which are not recorded in the TRI data, but based on the data in Hauschild & Wenzel (1998) and Stranddorf et al. (2001) we have found that the contribution to the overall ecotoxicity is insignificant. In conclusion:
The identified data gaps will affect the results of the current project in the following way:
A summary of the above recommendations is to:
2.5.2 Data sources for the emissions included in the extended NAMEAEmissions were estimated using a variety of sources, shown in table 2.10. Some data were further processed, as explained in the following sub-chapters. Table 2.10. List of emissions covered by the expanded NAMEA and their main sources.
2.5.3 Emissions in the official Danish NAMEAThe official Danish NAMEA (Danmarks Statistik 2003a) covers both energy related emissions and non-energy related emissions of CO2, SO2, NOx, NH3, NMVOC, CO, CH4, and N2O. The accounting conventions for emissions are not always the same as those typically applied in LCA, for example CO2 emissions are included from cement manufacture and from biomass combustion, even though there is no credit included for CO2 uptake during concrete hardening and during plant growth. To avoid introducing alternative arbitrary conventions and unnecessary adjustments, we have generally not adjusted the data, also because the effects of these conventions on the prioritisation are relatively small. However, when the data are used for other purposes than strategic prioritisation, these conventions may lead to an unwanted bias, of which the user should be aware and take the appropriate measures to adjust for. In one specific case we have adjusted the emissions reported in the official Danish NAMEA: Emission of NMVOC from Danish forestry has been deleted. These emissions (14190 Mg) were mainly due to coniferous forests and gave forest products a very prominent position in the prioritisation. However, if the alternative to coniferous forest is a natural forest with a high degree of oak-trees, the NMVOC emissions could be in the same order of magnitude (Fenhann 1999). Therefore, cultivation of forests has no net impact on the NMVOC emission. In parallel, it could be argued that other area-occupying activities are in fact suppressing the emission of natural NMVOC (and other emissions from natural woodlands, which is the alternative climax vegetation) and should therefore be assigned this effect as a negative emission. However, the knowledge on NMVOC emissions from agricultural plant growth is still sparse, which would make such corrections highly speculative. Most emissions in the official Danish NAMEA are allocated to the 130 industries of the IO-table or to final use. However, five sources of emissions are reported as undistributed:
Most of the undistributed emissions from production industries are negligible and we have therefore not taken them into account. We have allocated the undistributed VOC-emissions to beer brewing, based on Illerup et al. (2002). For the undistributed emissions from distribution of fossil energy we have allocated the methane to manufacture and production of gas (industry 402000) and the non-methane VOC with 3/4 for fuel distribution and 1/4 for gas distribution, based on rough estimates of the involved quantities of fuel and gas and the corresponding CORINAIR emission factors (EEA 2003). For wastewater treatment and dumps, the undistributed emissions concern methane, which is a result of previous landfilling of biomass, an activity that no longer takes place. These emissions have therefore been left out. Emissions from nature are considered background emissions, and thus not included. For the undistributed emissions of solvents, we have used the amounts reported in Illerup et al. (2002) for fat extraction and car maintenance. We have distributed the remaining amount on the basis of a solvent mass flow analysis using the data from the Danish physical supply-use table (Danmarks Statistik 2003b). The mass flow analysis covers the commodities mentioned in Table 2.11. Solvents included in imported products have also been accounted for, mainly in wood preservation agents. Table 2.11. Solvents covered by mass flow analysis
The total amount of these commodities is approx. 46 Gg. Subtracting 7 Gg used in pharmaceuticals (assumed to be metabolised or combusted), the remaining 39 Gg are traced either to final use (household & public use), use in industry or incorporation in products from the industries “Mfr. of detergents and other chemical products” and “Mfr. of paints, printing ink and mastics”. The solvent-containing products of these two industries are again traced either to final use (household & public use) or use in industry, applying the estimated emission factors given in Table 2.12 and taking into account that part of the solvents (approx. 4.5 Gg) are exported (mainly in products from the paint industry). Since the amounts for fat extraction and car maintenance make up 1 and 4.5 Gg, respectively, the total amount accounted for in this way is 40 Gg, which is close to the 38.538 Gg undistributed emissions reported in the emission matrices of Statistics Denmark (Danmarks Statistik 2003a). Some of the industrially applied solvents are collected and combusted and may account for the difference. In view of the uncertainty on the data, we have chosen to distribute the entire 40 Gg on the industries and final use. In fact, the estimated emission factors in Table 2.12 are lower than many of the default values recommended for national emission inventories, which implies that the total value of 40 Gg for Denmark may be underestimated. The distribution resulting from our mass flow analysis is shown in Table 2.13. Table 2.12. Approximate average emission factors (solvent contents) for product groups. Own unverified estimates.
Table 2.13. Resulting distribution of solvent emissions.
2.5.4 Internal work file from SSF-project (Pedersen 2003)Courtesy of the project “Miljøvurdering af danskernes forbrugsmønster” financed by Statens Samfundsvidenskabelige Forskningsråd (SSF) we have applied data from their internal work file (Pedersen 2003) providing estimates of the emissions of polyaromatic hydrocarbons and heavy metals to air for each of the 130 industries for the year 1998. We scaled the data to year 1999 by taking into account for each industry the differences in production volumes between the two years. 2.5.5 Internal work file from lcafood.dk (Dalgaard & Halberg 2004)Courtesy of the project “Livscyklusvurdering af basislevnedsmidler” we have applied data from their internal work file (Dalgaard & Halberg 2004) providing data on methane and nitrogen emissions and phosphorous balances for Danish agriculture, split on 29 farm types. The nitrogen emissions and phosphorous balances are calculated on the basis of a detailed farm model described at www.lcafood.dk. The total phosphorous emission for Denmark is estimated from an average value of 0.5 kg PO43- per hectare, and this total amount is then distributed over the 29 farm types in proportion to their phosphorous surplus. 2.5.6 Point sources for N and P (Laursen et al. 2000)Point sources of N and P are provided by Laursen et al. (2000), which has separate chapters on aquaculture and a detailed annex listing names of individual industrial plants, allowing identification and complete allocation to the 130 industries (incl. waste water treatment facilities). The emissions from households in agricultural areas are allocated to four household activities according to Wrisberg et al. (2001) (see Table 2.14). Table 2.14. Sources of N and P in household waste water
2.5.7 Mass flow analysesIn the late 1990'es, the Danish Environmental Protection Agency commissioned a series of mass-flow analysis of heavy metals in the Danish production and consumption. These publications have been used to estimate emissions of heavy metals to water. In general, we have disregarded emissions that are not due to current activities, but are caused by releases from older stock, such as emissions of mercury from thermometers in private use (since mercury thermometers are no longer sold for private use). Emissions of cadmium to water come mainly from anodic protection rods. We have distributed this emission on marine activities (oil extraction, fishery, transport by ship and harbours) with 15% to fishery and ships (0.05 Mg to each) and the rest to oil extraction and harbours (0.25 Mg to each) based on Drivsholm et al. (2000, p. 63). Other sources of emission of cadmium to water are sewage treatment, primarily from corrosion of galvanised products, such as road signs and roof gutters. Drivsholm et al. (2000) do not specify what products are galvanised. This could in principle be traced via the use of zinc in the supply-use table, but has not been done in this project. Emissions of mercury in wastewater are not included under sewage treatment, but allocated to the industries causing the emission, which are medical activities (dentists), extraction of crude petroleum, manufacture of refined petroleum products and hospital thermometers (Skårup et al. 2003). Emission from thermometers in private use has been excluded as well as emissions from laboratory equipment, since the emissions reported by Skårup et al. (2003) are mainly caused by old equipment, not current products. Emission of zinc to water comes from road transport as well as sewage treatment, mainly from corrosion of galvanised products. Galvanised products could in principle be traced via the use of zinc in the supply-use table, but this has not been done in this project. The total emission to water has been estimated based on Stranddorf et al (2001). The distribution of this onto industries is based on Hansen (1995b). Emissions of lead to wastewater come mainly from run-off from lead on roofs (Lassen et al. 2003). Other sources includes paint on historical buildings and from sandblasting on steel bridges, transportation, extraction of crude oil, paint used in fishery and wear on brakes. Emissions of lead from private and industrial fishing gear is not included, as well as emissions from cables left at the sea floor, since the availability of metallic lead to biota is very low (Strandorff et al. 2001, p. 176). Copper emissions to water are mainly due to antifouling paints used on ships (Lassen et al 1996). This emission is distributed based on the maintenance costs reported in the supply-use table (Danmarks Statistik 2003b) with 80% to shipping, 10% to defence (the navy) and 10% to fishery. Another important source is fishing gear, which is distributed with 40% to fishery and 60% to private use (Recreation), also based on the supply-use table. Other sources of emission of copper to water are ink, printed circuit boards, copper sulphate from surface treatment of communication equipment, sandblasting of ships, buildings (run-off from cupper roofs as well as copper pipes), sewage removal and transportation. We have not included emissions from copperware due to the low amount (0.1-1 Mg). Emissions of tributyltinoxide (TBTO) are reported by Lassen et al. (1997). Danish ships cause a total of 10.2-13.3 Mg TBTO emissions. In the normalisation reference by Stranddorf et al. (2001) only emissions to Danish waters are included, while we include all emissions caused by Danish ships, in accordance with the principles of national accounting. The emissions have been split 80% on water transport, 10% on defence (navy) and 10% on fishery, based on maintenance costs reported in the supply-use table (Danmarks Statistik 2003b). 2.5.8 Ozone depleting substances (ODP)More than 95% of the ozone depletion potential in Denmark in 1999 was caused by HCFC's (Poulsen 2001). HCFC's are applied in insulation foam and as cooling agents in refrigeration systems, mainly for industrial use. Emissions have not been determined, but emission potentials based on consumption statistics are applied instead. The distribution of industrial refrigeration and freezing systems have been analysed by using the supply-use table (Danmarks Statistik 2003b). To improve the allocation, a separate “Industrial cooling equipment” industry was separated out from the general industry “Other general purpose machinery”, and all HCFC use allocated to this new industry. In this way, the use/emission is attributed to the industries buying industrial refrigeration and freezing systems and thus to their products. 2.5.9 Particles (PM10)The original data from NERI (2003) for year 2000 (year 1999 data not available) are distributed on five groups:
We have further distributed the emissions data for road transport and other mobile sources based on the 1999 consumption of diesel in all industries and for private cars, and the consumption of fuel-oil in the shipping industry (industry code 610000). We further distributed the emissions from combustion in manufacturing industry and in non-industrial combustion plants based on the remaining 1999 energy consumption in GJ (excluding gas, due to the negligible emission factor for particles from gas combustion) for all industries and for the public sector and private consumption, respectively. 2.5.10 PesticidesFor pesticides it is not possible to find a reliable estimate of the emission to the environment. Instead pesticides are measured as the amount of active ingredient applied. An estimate of this is found in statistics of the Danish Environmental Protection Agency (DEPA 2000), who monitors the consumption of pesticides in agriculture, horticulture and other uses, and publishes the results on a yearly basis. For uses outside agriculture, it was possible to distribute the amount of herbicides and insecticides on industries by using information in the supply/use-table (Danmarks Statistik 2003b). For insecticides, we excluded 2 Mg classified under "Unspecified commodities" in the supply/use-table. For fungicides, no information was available about the distribution outside agriculture. By default, this amount was therefore distributed between horticulture (industry 11209) and agricultural services (industry 14000) in same proportions as for herbicides. 2.5.11 Land use (AIS)Land use is measured as an area occupied in a certain time (m²yr). For agriculture, the data from lcafood.dk are used (Dalgaard & Halberg 2004). For areas outside agriculture, we applied data from AIS 100 – Arealanvendelses-kortet, produced at the National Environmental Research Institute (Madsen 2003), derived from satellite photos, the Danish Address and Road-database and different surveys. One of these is the so-called TOP10-data, which for 1999 only covered 3 regions in Denmark (Ringkøbing Amt, Frederiksborg and Bornholms Amt), and thus underestimate the land use for activities, which are not common in these regions, such as recreational areas and horticulture. For later years, TOP10-data cover Denmark entirely. Road area was allocated to the main road transport activities based on their vehicle fuel consumption (76% private cars, 15% freight transport by road, 7% wholesale trade, 2% taxi and coach services). 2.5.12 Missing use stage emissionsUse stage emissions are generally included in the sources mentioned in the previous sub-chapters. However, a few additions or corrections have been made: The emissions from combustion of vehicle fuels for final use are generally allocated to private car driving. However, a part of the emissions are due to combustion in lawn-mowers and other motor-tools for gardening. The main emissions for these tools were estimated from Bak et al. (2003), while the minor emissions were estimated from the vehicle emissions using the assumption that gardening machines have the same percentage of other emissions as they do of CO2-emissions (1%). The resulting emissions were then subtracted from the vehicle fuel emissions before these were distributed over the different purposes of private car driving (see Chapter 2.7) and instead allocated to "Tools and equipment for house and garden." Land use is not attributed to gardening machines, nor has the fuel input (i.e. precombustion emissions) been allocated to the final use group "Tools and equipment for house and garden." We have added emissions from fuel use to "Car driving for holiday abroad," based on the emissions from Danish private car driving (same emissions per DKK spent on petroleum products, using buyer's prices, i.e. incl. product taxes and VAT). This estimate is reasonable, since the buyer's price of petrol varies only slightly between the countries most obvious for the Danes' car-holidays (Vejdirektoratet 2004). We investigated the data from the Dutch prioritisation project (Goedkoop et al. 2003) for sources of emissions that were not covered by the data from Statistics Denmark and NERI. The following four items were added to the Danish NAMEA:
using the emission factors given in table 2.15. The data for private cars were extrapolated to other road traffic using the same data as for land use (see Chapter 2.5.11). Data on the number of km driven in Denmark was found in Danmarks Statistik (2002), whereas data on amount of fireworks, tobacco and candles used in Denmark was found in the supply-use tables. The contributions are small compared to the overall emissions, except for Cu to water, where fireworks contribute a total of 72 Mg (compared to a Danish total emission of 170 t). This value is not confirmed from other sources and is highly uncertain. In proportion to the total Danish emissions, wear on vehicle tyres and belts contributes mostly to Zn emissions to water (20 t out of a Danish total emission of 123 t), tobacco combustion contributes mostly to particulate emissions (0.7% of the Danish total), and candle combustion contributes most to CO emissions (1.8% of the Danish total). Table 2.15. Emission factors for minor sources (based on Goedkoop et al. 2003)
2.6 Adjusting the level of aggregation of industriesThe classification of the Danish production is described in Plovsing and Dalgaard (1997). This follows the EU statistical classification of activities and products (NACE, CPA and PRODCOM), which is fully harmonised with the similar international ISIC and CPC classifications (i.e. an aggregation of categories in one system matches a category in the other system). We have made the following modifications in order to target regulatory meaningful product groups:
2.7 Adjusting the level of aggregation of consumptionThe classification of the Danish consumption is described in Plovsing & Dalgaard (1997). We aggregated some final uses for which the distinction does not have any environmental relevance:
2.7.1 Accounting for investments and FISIMThe Danish input-output tables (Plovsing & Dalgaard 1997) follow the traditional convention of including investments in capital goods as a final use, rather than as an intermediate consumption. For input-output analysis, this implies that the investments are not linked as an input to the other items of final use, as is typical in the practice of life cycle assessment. To include the investments as intermediate consumption, the investment of each industry (recorded under final use) must be redistributed to the industries supplying the investment goods. We have performed this correction, based on the investment matrices of Statistics Denmark (Danmarks Statistik 2003c), which provide investment data aggregated on 57 supplying industries. We further disaggregated this to the level of the 130 industries of the IO table, based on an internal work file from statistics Denmark. In this process, negative investments were regarded as changes in stock and thus eliminated. An exception to the described procedure is “agricultural breeding stock” and “net acquisition of valuables”, which are not capital goods in the traditional sense, but should rather be seen as items of changes in stock, i.e. as a net storage of value in the same industry that supplies the investment good. The Danish input-output tables (Plovsing & Dalgaard 1997) also follow the traditional convention of including financial intermediation services indirectly measured (FISIM), i.e. bankers' net interest, as a final use rather than as an intermediate product of the financial industry. For input-output analysis, this implies that this income of the financial industry is not linked to the other items of final use, as is typical in the practice of life cycle assessment. To include financial intermediation services as an intermediate consumption, we have redistributed the FISIM expenditure (recorded under final use) to the financial industries supplying the loans. This redistribution is done in proportion to the non-FISIM spending of each industry and private consumers (group 9950 “Financial services n.e.c.”) on each of the financial industries 651000 and 652000. 2.7.2 Combining products in the use stageWe rearranged some of the groups of final consumption in order to obtain results that resemble LCA results, i.e. groups that better reflect the functions of the different products in their combined use in the households:
2.8 Improving the modelling for imported productsIn traditional Input-Output Analysis, the standard procedure is to apply to the foreign industries the same emission factors (environmental exchange per DKK) as for the corresponding Danish industry. This assumption was applied in an initial analysis, and showed that the imports to Denmark resulted in an average environmental impact of a size approximately 1/3 of the environmental impact from the Danish production and use stages. As Denmark has very little raw material extraction and primary processing, it is to be expected that applying Danish emission factors to foreign production will result in an underestimation of the actual environmental impact. This expectation was confirmed in a later analysis, where emission factors from USA was used for the foreign industries. This resulted in an average environmental impact of a similar size as the environmental impact from the Danish production and use stages, i.e. three times the original result. Obviously, this value varies from impact category to impact category, and the above values should be seen only as rough average indications. The simplest improvement that can be made is to apply emission factors that are more representative for the foreign industries. Such emission factors can be obtained from foreign NAMEAs or other sources. For this purpose, we obtained NAMEAs for the following countries and country groups:
Due to the limited time available to us, we first analysed the NAMEAs to see which set of emission factors would be most appropriate to apply as a default for all foreign industries. In the process of comparing emission factors between the different NAMEAs, we discovered some very large emission factors in some of the GTAP-based NAMEAs, which were found to originate in a mis-allocation of the original emissions data from the EDGAR emissions database. For this reason, we decided to refrain from using the GTAP-based NAMEAs. Another reason for not applying the GTAP-based data was our investigation into the causes of uncertainty (see also Chapter 2.11), which show that a high level of industry-aggregation, as in the GTAP-based NAMEAs, implies a larger uncertainty than transferring less aggregated data between countries, i.e. using data from a “wrong” country. The NAMEAs from the six European countries are at very different level of aggregation (between 50 and 200 industries) and including very different numbers of emissions (generally less than in the Danish NAMEA, and restricted to air emissions). For this reason, it was decided to use the US-American table (Suh 2003) as a starting point for developing a default for all foreign industries. Contributing to this decision was the relatively low level of aggregation of the US table (493 industries), the high number of emissions available (more than in the Danish NAMEA) and the relatively high completeness of the US-American economy in terms of industries covered (due to the size of the country, practically all kind of industries are found within the country). Since 70% of the products imported to Denmark come from other European countries, we proceeded to analyse the US NAMEA with the aim of identifying the necessary adjustments to make the data suitable as a proxy also for European industries exporting to Denmark. As a starting point, we compared the emission factors from the US NAMEA (as provided by Suh 2003) to the emission factors from the closest corresponding Danish industries, using the conversion factor 7.25 between DKK99 and USD98, assuming a default 4% annual reduction in emission factors. In general, we found the original US data to provide a reasonable proxy for imports to Denmark, while in some instances we found it necessary to make adjustments to the US data. The adjustments made were:
Ideally, our corrections should be verified by national emission experts, but failing this, we believe the above procedure is better than no correction. Ideally, we should have used emission factors from as many countries as possible, to make the comparisons (and corrections) as valid as possible. Clearly, the use of the Danish emission factors alone is clearly a minimum procedure due to the lack of time for a more elaborate procedure. The resulting “US NAMEA with Europe-adjusted emission factors” was then used to calculate the “cradle-to-wholesale” emissions per product from each industry (see Chapter 2.13 for a description of the standard LCA calculation routines). The resulting 493 products were then aggregated to the industry levels of the Danish NAMEA. These aggregated default “cradle-to-wholesale” emissions for products imported to Denmark are included in the database from the project (see chapter 7). When linking Danish imports to the US data, the purchase values less import tax were used. Although country-specific emission data were not found to be available in sufficient detail, it would have been preferable to further detail the treatment of imported products by linking the most important foreign IO-tables directly to the Danish, and adjust the default emission factors with country-specific emission factors when available. This would have allowed more detailed modelling, e.g. of improvement options, market sensitivities etc. However, the linking of IO-tables required more resources than available to this project, notably because of the different levels of aggregation between countries and different dividing lines between industries. 2.9 Adjusting for market constraintsIn standard IO-analysis, all the links between industries are assumed to contribute proportionally to the result, for example the environmental impact of milk will appear as a combination of the impacts from the chain from dairy back to agriculture, fertiliser industry etc. However, such a calculation does not take into account that it is not all industries that can influence their entire supply chain in this way. For example, because of the quotas on milk production, a change in the output of milk from the dairies will not be able to influence the amount of milk produced in agriculture, and therefore not the environmental impacts from agriculture either. An increased output of milk will instead be met by decreasing the output of milk powder and butter. The only way the environmental impact of dairy farms can be influenced is by placing explicit demands on the technology applied on the farms. This can be a direct regulation or it can be a consumer demand for BAT milk (e.g. milk from ecological farming). To reflect this in the expanded NAMEA, i.e. to reflect the way each industry reacts on changes in supply and demand, we analysed all industries systematically for long-term production constraints, i.e. constraints that influence investment decisions, like the one mentioned for dairy farms. This means that for each industry, we have investigated:
As a result of our analysis, we identified the following main areas where constraints play a significant role:
In most other industries, changes in demand will affect the modern plants, typically with low emission factors (Weidema 2003). This implies that using average emission factors will lead to a systematic overestimation of the impact of a change in demand. However, since this overestimation will affect all industries, it should not affect the overall ranking of product groups, and we have therefore not adjusted the data for this general overestimation. However, for a truly market-based database, we recommended to supplement the database with specific modern processes in the cases where there is a significant difference in technology and emissions between the average and the modern plants. Since we have not implemented this recommendation in the expanded NAMEA, we call our version market-adjusted rather than market-based. The market adjustments that we have implemented for the ranking take into account the most important of the production constraints in the above bullet-points; see details below. For each constrained supplying industry, we first identified the alternative most sensitive supply route (or in the case of input constraints, the most sensitive alternative consumption or treatment route) according to the procedure of Weidema (2003). We then created a separate copy of the expanded NAMEA, named “market-adjusted model.” In this version of the NAMEA, the following adjustments were made, for the most important constrained industries:
More specifically, the following describes in detail the market adjustments made. The documentation for the described market conditions is provided in Weidema (2003) unless otherwise stated:
All of the above adjustments have been made under the simplified assumption of equal monetary value of the constrained and the unconstrained products, i.e. the total production value of each industry is kept constant. A more precise calculation could be made by using data on the physical amounts of unconstrained products that replace the constrained products, but comparing the effort required by this approach as well as the additional assumptions that would thereby be introduced, we have judged our simplified approach to be preferable for the purposes of this project. Furthermore, the following adjustment was introduced into the database from the project, see Chapter 7, but was not included in the version applied for the prioritisation, since it was estimated that this would not influence the prioritisation:
For some of the identified constraints, no adjustments were made, since it was estimated that this would not influence the prioritisation. This applies to:
2.10 Impact assessmentDifferent possible approaches to impact assessment was discussed with the project reference group. Based on these discussions, the group chose to apply the Danish EDIP-method for the external environment (Wenzel et al. 1997), supplemented with an impact category for nature occupation (see Chapter 2.10.2) and an equal weighting (see section 2.11.4) of the resulting 8 impact categories:
In the course of the project, some EDIP characterisation and normalisation factors were updated, see sub-chapters 2.10.1, 2.10.3 and Chapter 3. 2.10.1 Characterisation factorsIn general, the EDIP characterisation factors from Wenzel et al. (1997) have been applied. For photochemical ozone formation, the values for high background concentration of NOx have been applied to ensure consistency with the SimaPro version of the EDIP method. We have added characterisation factors for particulates, tributyltinoxide and unspecified herbicides, fungicides and insecticides, based on Stranddorf et al. (2001). To provide a consistent treatment of PAHs from domestic and foreign industries, they have all been aggregated to benzo(a)pyrene-equivalents, based on MOE (1997) - and CEPA (1993) for fluoranthene. In general, all toxicity factors have been updated with the most recent information from Olsen (2003). The applied characterisation factors are site-generic, i.e. they do not take into account that the same amount of emission may have different impacts depending on the location of the emission. Particularly for transport by ship this may lead to an unreasonably high impact for acidification, nutrient enrichment and human toxicity, since a large share of the emissions take place at high sea and therefore never reach neither the sensitive ecosystems nor humans. Rather than applying specific characterisation factors for emissions from shipping, we have simply roughly simulated a site-dependent impact assessment by reducing the emissions of SO2, NOx, ammonia, VOC, PAH and particulates from “Transport by ship” to 25% of those originally reported in the extended NAMEA. In this context, it is also worth noting that due to the specific atmospheric conditions in marine areas, the marine NOx emissions are highly likely to have a larger effect on global warming than NOx emitted over land, but more research is needed to quantify these influences (Skjølsvik et al. 2000), and we have therefore not made any corrections for this. 2.10.2 New impact category: nature occupationLand use is specified in two categories:
with the unit m²yr. The characterisation factors applied are:
PAF is an abbreviation of Potentially Affected Fraction, i.e. the number of native species that are assumed to be negatively affected by the occupation. The maintenance of housing, infrastructure and crop production during one year affects 100% of the species during this year. In addition, these types of land use typically occupy arable land, and thereby contribute to the general expansion of land under human use and thus to the annual global deforestation. The gross deforested area of natural forests is 0.15 E12 m²/year (FAO 2001). Assuming an average relaxation time of 540 years (Weidema & Lindeijer 2001) and 50% average depression of the natural ecosystem during this time, the resulting nature occupation is 40.5 E12 m²/year. This is 2.4 times the 17 E12 m² currently used globally for human settlements and arable and permanent crops. Thus, to take deforestation into account, every area of arable land currently used is calculated as resulting in an occupation of 3.4 times this area, i.e. 3.4 PAFm²yr/m²yr. For cultivated forest and permanent grassland, it is estimated that 1/3 of the native species are sensitive to the activities (Weidema & Lindeijer 2001), resulting in the characterisation factor 0.33 PAFm²yr/m²yr. The above is a simplification of the impact assessment for physical impacts of land use developed for the EDIP method by Weidema & Lindeijer (2001). In this method, detailed calculations were made to take into account that ecosystems differ in species richness, vulnerability and inherent scarcity. Since these factors of ecosystem quality can only differ between 0 and 1, it turned out that in practice the impact assessment is dominated by the occupied area of ecosystem, and only to a lesser extent influenced by the specific qualities of the ecosystems occupied. This is reinforced by the fact that most human activities take place in areas that have a high ecosystem quality, and therefore do not differ so much in this respect. Together, these arguments lead us to apply the above simplification, which focus mainly on the area occupied, and does not distinguish between the ecosystem qualities of the occupied areas. Also, the above simplification focuses on biodiversity impacts, since this is regarded as the most important physical impact of land use, compared to the impacts on substance and energy cycles and natural productivity, which was also covered by the method developed by Weidema & Lindeijer (2001). 2.10.3 NormalisationThe EDIP normalisation references of Wenzel et al. (1997) relate to the environmental impacts from Danish production and final use in 1990 (Global production and final use for the impact categories global warming and ozone depletion). These references were updated to 1994 by Stranddorf et al. (2001). However, since our project applies emission data from 1999, Danish normalisation references for 1999 is an incidental by-product of our work (see Chapter 3). However, since our assessment covers also emissions abroad caused by Danish production and consumption, it would give our assessment an unintended bias if we applied the Danish normalisation reference. This would be particularly noticeable for impact categories where Danish impacts are relatively low (such as ozone depletion and toxicity), since the foreign emissions would make these impact categories appear much more important than the other impact categories when measured in units of Denmark-equivalents or person-equivalents. This bias could be corrected for in the weighting, but we found it more satisfactory to apply a normalisation reference that reflects the object of our study, i.e. the total environmental impact caused by Danish production and consumption. Thus, the normalisation reference applied in this study is: The total environmental impact caused by Danish production and consumption in year 1999, see Table 2.16. Additional to the impacts from Danish production and final use, this includes impacts caused abroad by production of products imported to Danish industries and final use, but excludes impacts caused by re-exported products, as well as impacts caused abroad by consumption of products produced in Denmark. To make the normalisation value more meaningful, it has been divided by the Danish population in 1999 (5313577 inhabitants), resulting in a value expressed per person. Thus, this value - in person-equivalents - express the total environmental impact caused by the production and consumption of an average Dane in 1999. The normalisation reference in Table 2.16 is affected by the reduction of the emissions of SO2, NOx, ammonia, VOC, PAH and particulates to take into account site-specific aspects of “Transport by ship” as described in Chapter 2.10.1. This affects the values for acidification, nutrient enrichment, photochemical ozone and human toxicity air. Without this reduction, the values for these impact categories would have been 1.64E+06 Mg SO2-eqv. (36% larger), 3.49E+06 Mg NO3--eqv. (14% larger), 2.46E+05 Mg C2H4-eqv. (2% larger) and 2.71E+16 m³ air (14% larger), respectively. Table 2.16. Total environmental impact caused by Danish production and consumption in year 1999
2.10.4 WeightingThe three categories of ecotoxicity (water chronic, water acute, soil chronic) are aggregated into one, based on their normalised values. The same is done for the three categories of human toxicity (air, water, soil). This implies that each of the three sub-categories receives equal weight within the overall categories of ecotoxicity and human toxicity. In most cases, results are presented per impact category, but for some purposes, e.g. the general presentation in Chapter 1.1, and for selecting the top 10 most important product groups in Chapters 1.2 to 1.4, the eight impact categories have been weighted equally based on their normalised totals. This implies that each impact category contributes with 1/8 to the total environmental impact of Danish production and consumption as reported in these chapters. 2.10.5 Limitations of the impact assessmentThe eight impact categories do not cover all environmental problems. Notably, the following issues are not covered:
Species dispersal is mainly related to transport vectors and imports of biological materials. This implies that the exclusion of this impact category mainly leads to an underestimation of the importance of transport products and products that involve much transport, and especially imported biological products. However, even with the current impact assessment method, transport and biological products receive much attention. Thus, the exclusion is not likely to affect the prioritisation significantly. Poverty-related health issues are mainly affected by trade and investment in countries with a low average income. Thus, the exclusion of this impact category mainly leads to an underestimation of the positive effects of importing products from such countries. Accidents (besides accidents at the workplace) are mainly related to traffic and to a lesser extent to specific household activities. As mentioned above, transport already receives much attention in the prioritisation, even without the inclusion of this impact category. Occupational health (including accidents at the workplace) could be included in the assessment by applying the method developed by Schmidt et al. (2004). The possible result of this has not been estimated. Also noise is mainly related to road traffic, and thus reinforces the focus on transport activities. Besides the exclusions, the main limitation of the impact assessment method lies in the equal weighting of the normalised impact categories, which does not reflect their true importance, e.g. in terms of number of affected individuals or ecosystems. 2.11 Uncertainty analysisUncertainty in using IO-tables for environmental analysis can be broadly understood as that arising from the models themselves, and that arising from the data used in the models. The analysis here concentrates on data uncertainties (empirical uncertainty), which can be quantified in a probabilistic uncertainty analysis. Our uncertainty analysis estimates the uncertainty of the main data inputs into the NAMEA-model, and propagates these to the output using a probabilistic simulation analysis. The uncertainties on the output results are presented as coefficients of variance (CVs) as well as illustrative plots with confidence intervals (see Chapter 1). Based on the research by Lenzen (2001), we identify the main sources of empirical uncertainty in the Danish economic input-output data to come mainly from three sources:
We thus find that these sources of uncertainty, together with uncertainty on the emission factors, will dominate the overall uncertainty, and that our analysis can reasonably be limited to these sources. The first two sources are considered in detail, as there may often be a choice between using geographically relevant data at a low degree of detail (few industries), or using a table from another country, available at a higher level of detail (many industries), see Chapters 2.8 and 2.11.4. In either case, there will be a certain amount of unavoidable uncertainty associated with using an IO-table constructed from economic data a few years prior to the particular year of study (especially for rapidly changing industries). This temporal uncertainty has not been quantified. Coefficients of variation (CVs) are estimated for the IO-data and the emissions data, with separate estimates for the domestic and foreign production. Our analysis does not include uncertainty for the final use data and emissions, nor for the characterisation factors for the impact assessment. The coefficients of variation estimates for the IO-data were made from two levels of aggregation analyses. The first of these (Chapter 2.11.1) looked at the variation within the Danish IO-table arising from the aggregating the data in the supply-use tables (Danmarks Statistik 2003b) into the level of the 130 industries in the standard IO-table (Danmarks Statistik 2003a), and the second looked at various levels of aggregation in different national IO-tables (Chapter 2.11.2). Geographical uncertainty was also analysed by comparing different national IO-tables at the same level of aggregation (Chapter 2.11.3). Coefficients of variation were also estimated for the emission data. The CV estimates for the industry emission data are based on the values published with the Danish emission data, while CVs for those emission types for which uncertainty data is not published are based on known variations in the processes underlying the emissions (see Chapter 2.11.5). For foreign emissions, these data were supplemented by an analysis of the geographical variation between the air emission data of various countries (Chapter 2.11.6). 2.11.1 Uncertainty due to aggregation in the Danish IO-tableThe most detailed transaction records complied by Statistics Denmark consists of a total of 51014 inputs and outputs classified by 7-digit commodity numbers (Danmarks Statistik 2003b). From these detailed transaction records, we constructed 130×1,878 matrices for Make and Use. These two matrices were used to derive the most detailed commodity-by-commodity input-output matrix for Denmark based on the industry-technology model (see Suh 2003b). The resulting matrix has the dimension of 1,878×1,878. The detailed square matrix was further aggregated into a 1,878×130 matrix (A’) based on the standard classification system used for the Danish input-output table. The matrix shows the structure of inputs, represented by the most detailed commodity categories, to commodities, represented by the standard Danish IO categories. In principle, aggregation of the A’ matrix into a 130×130 matrix would result in the standard IO-table (A), as produced by Statistics Denmark (Danmarks Statistik 2003a). The aggregation error that we estimate is that arising when using the aggregated input coefficients of those commodities that belong to the same standard Danish IO category (elements in A) instead of the most detailed, commodity-specific input-coefficients (elements in A’). The probability that a commodity in the detailed classification is chosen over the others in the same standard IO category is assumed to correspond to the size of the input. Thus, the matrix of Coefficients of Variation (CVs) is derived from the elements in each column in the A’ matrix that are used for the aggregation into the A matrix. The CV estimates derived from the above analysis were used directly as an estimate of the uncertainty of the Danish industry matrix. 2.11.2 Importance of aggregation level across national IO-tablesNational IO-tables are published at very different levels of detail, as can be seen by the following list of tables considered in this analysis. The number of directly-comparable commodity groups in each table is given in brackets (the numbers in brackets are slightly less than the total categories published for each country, as a few categories are not comparable across the tables):
The aggregation structure of the 30x30 GTAP IO-tables used by Nijdam & Wilting (2003) and Goedkoop et al. (2003) is also considered in our analysis, but the data were not used in the quantitative analysis that follows. To analyse the degree of aggregation across the tables, we organised the industries / commodity groups considered in each table according to the CPA 2002 (Statistical Classification of Products according to Activity). This is a fairly straightforward procedure for the European tables, but creates some difficulties for the USA table which uses a different classification system, the Standard Industrial Classification System or SIC. Once classified according to a common system, the different levels of aggregation in the different tables can be analysed (i.e. the number of commodity groups considered by each table at the different classification levels). Twenty-three "top-level" groups of industries are defined, where the "top-level" index is taken from the CPA nomenclature, and corresponds to where at least one of the tables listed above is constructed at that level of aggregation, e.g. at the CPA level "DA - Food Products, Beverages and Tobacco", the USA table is broken down into 50 different commodities, whilst the UK is broken down into 13 and Germany 3. However the French table has just one entry, so this is taken as a "top-level classification". 2nd and 3rd level classifications are also considered where possible, e.g. at the CPA level 16, "Tobacco products", the USA table has 4 entries, and all other tables 1 (except the French and GTAP tables, which only have entries at the higher aggregation level). Even at very high levels of aggregation, the different classification system used for the USA table means that certain industries are left of the analysis. The French table also has a few commodity groups with unusual combinations of the CPA classifications, which also results in them falling outside the "top-level" classifications (i.e. being excluded from the analysis). We then calculated the degree of variation (expressed as a coefficient of variance; CV) between the use commodities for each IO-table at the various aggregation levels. Figure 2.2 gives the results of this analysis for "Pulp, paper products and publishing". For comparison, the variation within the Danish supply categories is also given (plotted on the y-axis).
Figure 2.2. Coefficient of variance (CV) within industry groups as a function of the aggregation level (calculated by aggregating the commodities from the detailed tables from USA, Norway and Denmark to the levels of aggregation found in less-detailed tables), with the geographical variation superimposed as vertical lines showing the range in CV found for inputs to pulp, paper products and publishing between the tables, showing highest variation for Basic metals and lowest variation for Energy inputs. Figure 2.2 clearly shows the higher level of variation as more commodities are aggregated. This effect is most visible with the USA table, as it has the largest number of commodity groups, however the trend is also clear for the other tables where data allows. 2.11.3 Geographical variation in inputs to industriesThe degree of variation between the tables was also assessed to give some indication of geographical variation. Although geographical differences are thought to be the primary driver for the variation between the tables, the analysis in fact captures all sources of difference between the tables. The latest version of the IO-table is used for each country, so there are differences in the age of the data, and perhaps even more importantly, there may be underlying differences in the methodology used to construct the different tables. The analysis is also limited to comparing those commodities that are directly available at an identical level of detail for each table, i.e. Norway, Denmark, Germany and the Netherlands can be compared according to "Beverages" (CPA 15.9), but not the USA or UK, which consider a lower aggregation level (e.g. "Bottled and canned soft drinks"), nor Sweden or France, which consider only a higher aggregation (e.g. "Food products and beverages"). Variations are only calculated for those commodities considered by at least 3 tables, which limits the analysis to a consideration of only 77 commodities. To be comparable with the previous analysis, the 77 commodities are then aggregated to the 23 "top-level" groups considered in the aggregation analysis (i.e. although the CV is calculated for each possible commodity, the average of these CVs is calculated for the higher-level groupings). Variation of inputs within "Pulp, paper products and publishing" is shown in Figure 2.2 (CV of each industry group given by a vertical line, with the industry showing the highest and lowest geographical variation given in the legend). 2.11.4 Aggregation vs. geographical uncertaintyFigure 2.2 clearly shows that geographical variation between the IO-tables is often considerably lower than the variation due to aggregation of industries / commodities. This same trend was found for almost all of the 23 industry-groups analysed. The analysis shows that where 10 commodities (and in some cases considerably fewer) are aggregated, these have higher variation between them than what is found across the tables (at that aggregation level). Thus, from a data uncertainty perspective, it appears preferable to use a table with a low level of aggregation rather than using more geographically relevant data at a high level of aggregation. This supported our decision to model the products imported to Denmark on the basis of the detailed USA table, rather than using the more specific, but less detailed IO tables acquired for European and non-OECD countries (see Chapter 2.8). This interesting finding also means that when using a table with a high degree of detail but in a different geographical context, e.g. using the USA table to represent the rest of the world (ROW), the geographical variation values can be used as a rough estimate of the uncertainty arising from using this data in a different context. The geographical variations calculated above are thus used as an estimate of the uncertainty of the modified USA IO-table applied to model the products imported to Denmark (see Chapter 2.8). In both the domestic and foreign IO tables, the row average CV is used to estimate the uncertainty in those few instances where lack of data results in a "blank" field. This approximation is made because empty fields are invariably interpreted as zero, which is not meaningful in this context. 2.11.5 Emission factor uncertainty for Danish emissionsUncertainty estimates are available in various reports on the Danish national emission inventory (see Nielsen & Illerup 2003; Illerup et al. 2003a and b). The uncertainty estimates are derived using the methodology of Pulles & van Aardenne (2001), and are expressed as half of the 95% confidence interval divided by the total (interpreted to be the mean). The uncertainty estimates combine the uncertainty of the data source (national statistics) and the uncertainty of the emission factor. The former is estimated by Illerup et al. (2003) as contributing only little to the overall uncertainty (2% for most emissions), whilst the latter range considerably (as high as 1000% for ammonia and heavy metals). The level at which the uncertainty estimates are available depends on the emission type, for example for carbon dioxide, the estimates are for each fuel type, whilst for many emissions it is at the aggregated industry level (i.e. transport and stationary consumption, which is sometimes further disaggregated into energy and transformation industry, non-industrial combustion and manufacturing industry). Estimates for fugitive emissions and those from various agricultural processes are also available for certain emission types (e.g. methane and ammonia). Using information on the breakdown of fuel types consumed by the various industries, the approximate relative contribution of transport and stationary consumption activities to the emission can be estimated, and an overall CV calculated for each industry from the available uncertainty estimates (or from the contribution of each fuel type, in the case of carbon dioxide emissions). This simple method does not take into account the fact that much of the uncertainty is correlated, i.e. arising from a common source, with its distorting effect on the output uncertainty sample (when calculated using a probabilistic simulation analysis). However, this effect can be mitigated by basing the results on an analysis on the normalised difference between the industries, which removes the distorting effect of common elements (provided they are calculated from the same uncertainty sample). For simplicity and consistency, the CV estimates are once again calculated at the level of 23 industries. Uncertainty estimates for emissions to water and soil are specified in considerably less detail than emissions to air. We have either based these on expert knowledge, where a single estimate is used across all industries (e.g. nitrogen emissions to water are estimated at 10%, representing 2 standard deviations), or calculated them from known ranges for the particular emission (e.g. the 4-86 kg range given for mercury emissions to water from the extraction of crude and natural gas is assumed to cover the 95% confidence range). We did not include uncertainty estimates for the land use data, and consequently uncertainty has not been estimated for the impact category “Nature occupation”. The land use data for Denmark is expected to have very low uncertainty. However, no information was available to guide an estimate of using the Danish data as proxy for foreign land use (which is expected to imply a larger higher uncertainty). 2.11.6 Emission factor uncertainty for foreign emissionsThe CVs for the foreign emissions (i.e. those associated with imports) are derived from the geographical variation between the NAMEA air emission inventories (Pasquier 2001). Sufficiently consistent air emission data and economic data are available for the following countries to allow for an analysis of the degree of variation between the emission inventories (data for 1999, unless otherwise indicated):
To allow for an equal analysis of emissions per industry, we normalised the emissions to the total output for the industry in 1999 US dollars. CVs for the air emission data are predominantly calculated using only the data from the first six countries listed above, as recommended in Pasquier (2001), which cautions that the data from all available countries cannot reliably be compared because of methodological and data collection differences. However, CVs are only calculated where three or more data points are available, so in a few cases (e.g. for particulates) the data for all countries other than Belgium are used (Belgium is excluded because of highly anomalous results). This restriction also means that the CVs are calculated at fairly high industry aggregation levels, since for many of the countries, the emission data is only available at a relatively high level of industry aggregation. For consistency, in most cases the CVs are calculated at the same level of aggregation as the economic data (23 industry groups), and this CV used to estimate the uncertainty of the emission for all industries in the group. When the geographical variation data gave lower uncertainty estimates than that estimated for the Danish data, the Danish CV value was used for both domestic and import emissions. In these cases, the overall uncertainty is assumed to be dominated by the very high uncertainty of the method used to calculate or estimate the emissions (e.g. as found for emissions of heavy metals). The same applies to emissions to water and soil where a single estimate based on expert knowledge is used across all industries. 2.12 Adjusting for differences in improvement optionsThe standard NAMEA expresses the magnitude of the environmental exchanges from each industry and product group, not the possible change in these exchanges (e.g. improvement potential). The product groups that have the largest environmental exchanges may not necessarily also be the ones with the largest improvement potential. We therefore investigated different data sources on improvement potentials (including BREFs from EU, BAT documents for the Nordic Council of Ministers, BATNEEC guidance documents from Ireland, and Cleaner Technology projects of the Danish EPA) to identify possible differences that could affect the prioritisation (see also Chapter 1.7). To limit the analysis, we addressed only the product groups with the largest environmental impacts (Top 20). The rationale behind this approach is the assumption that unless specific circumstances apply, all industries (product groups) have a relatively similar potential for improvements, which implies that the industries / product groups with large impacts also have equivalently large improvement potentials based on the general results of increased efficiency and incremental technology improvements characteristic of the market economy. Limited improvement potentials would especially be expected for in the case of mature, and well-established technologies, on the last, flat part of the learning curve, if at the same time competition from new technologies were constrained – either by the lack of economic incentives or by physical, cultural or political limitations. Limited improvement potential can also be identified by relatively small differences between best available, modern and average technologies. We found large improvement potentials for all the priority product groups, generally falling within the following categories:
Phylipsen et al. (2002) also conclude that “traditional” material technologies, such as more efficient material production, material-efficient product design and material recycling are still important options to reduce the environmental impact in each of the impact categories of most of the materials they investigated. For detailed results on improvement options for the top-10 product groups, see Chapter 1.7. We have not found any evidence that any of the priority product groups should be particularly subject to limitations in their improvement potential relative to other product groups. The differences appear to have more to do with the focus that have been placed on different industries or environmental problems. Some industrial industries and product groups have been subject of cleaner production projects, development of BAT notes etc., so technological options have been identified, but in general only applied to a limited extent. In other areas, international agreements are already in force or being negotiated, i.e. both needs and options have been identified, but policy measures and instruments still lack full implementation. Experiences from the cleaner technology programmes especially in Denmark, the Netherlands and Germany (Remmen 2003) show that public funding do promote improvements by higher efficiency or substitution of substances, materials or processes, but within the regime of the options of the technological development in general. As these funding programmes can only support a very limited number of industries, general improvements will require industry-wide incentives, e.g. use of legislative restrictions or economic incentives, such as taxes. In general it can be concluded that a focus on improvement options does not change the overall ranking of product groups compared to the focus on environmental impact applied for the current prioritisation. We have therefore not found any reason to quantify the improvement potentials further. 2.13 Calculation routines and validationTo arrive from the expanded NAMEA to the results presented in Chapter 1, the environmental impact intensity (i.e. the “life cycle” or “embodied” environmental impacts per monetary value of products) of each industry is first calculated by multiplying the emissions or impact matrix with the inverted production matrix. This provides the exact solution to the iterative calculation suggested by figure 2.1, and is equivalent to the standard calculation routine for LCA and IO-analysis, as described by Heijungs & Suh (2002). The environmental impact intensity of each industry is then multiplied by the monetary requirements from each final consumption group (product group or household activity) and by the export value of each industry, resulting in the total environmental impact from each product group, household activity or export item. The calculation routine was performed by exporting the expanded NAMEA from the Excel work book in which it was stored into three different software, namely MatLab (www.mathworks.com), SimaPro (www.pre.nl) and Analytica (www.lumina.com) and performing the above calculation in parallel in the three software. The calculation was validated by ensuring that the results were the same across the three software. Calculations of coefficients of variance for the results were done exclusively in Analytica, using a probabilistic simulation with Median Latin Hypercube sampling of the input distributions. The very large number of inputs into the uncertainty model forced us to restrict the simulation to a sample size of 200. This relatively small sample size is deemed sufficient for this application (i.e. it gives reproducible CV results), but the results should not be interpreted beyond two significant figures. 3 Danish LCA normalisation data for year 1999Danish LCA normalisation data (i.e. data on the total emissions from Danish production and final use) were published by Wenzel et al. (1997) referring to year 1990 and updated to 1994 by Stranddorf et al. (2001). As our project applies emission data from 1999, a Danish normalisation reference for 1999 is an incidental by-product of our work. As this may be useful for LCA practitioners, it is provided in Table 3.1. Comparing to the normalisation reference used in this project (see Table 2.16), it should be noted that the normalisation reference in Table 3.1. refers to the emissions by Danish activities only, as defined by the national accounting principles (Plovsing & Dalgaard 1997), while the normalisation reference in Table 2.16 includes the environmental impacts caused by Danish production and consumption, including impacts caused abroad by production of products imported to Danish industries and final use (except re-export). Table 3.1. Total environmental impact from Danish production and final use in year 1999
¹ 5.313577 E6 inhabitants in DK in 1999 4 New product groups for environmental labels4.1 Identification procedure As part of the application of the project results, 5-6 product groups have been identified for which the development of new environmental labelling criteria would be relevant. This chapter describes the identification procedure, and the identified product groups in terms of the environmental effects that contribute to the results as well as the potential for improvements. 4.1 Identification procedureA product group for environmental labelling should first of all be environmentally relevant in the sense of having high environmental impact intensity. Thus, the candidate product groups for environmental labelling should be found at the top of the lists in Chapter 1.2.5. Since the environmental labels are restricted to products for which a significant part of its sales volume are sold for final consumption or use (European communities 2000) it is the consumption perspective that is relevant, i.e. the list where fireworks is at the top. In table 4.1, this list is expanded to include more products. The corresponding lists per impact category are provided in chapter 1.4.2 are those for Danish consumption with the largest intensities (Tables 1.20, 1.24, 1.28 etc.). As a second step, these product groups with high environmental impact intensity are then screened for their relevance according to a number of exclusion criteria, namely:
For example, fireworks, in spite of being very relevant in terms of environmental impact, will not be eligible for labelling since it could be harmful to the consumer in its normal application. Also, as can be seen from Table 4.1, many of the products with high environmental impact intensity are food products (including animal foods) and therefore not eligible for environmental labelling. It is somewhat provoking that many environmentally relevant products are thereby excluded from environmental labelling, and this could suggest that it may be relevant to re-consider this exclusion criterion when revising the eco-labelling directive. Table 4.1. Products in Danish consumption sorted according to falling environmental impact intensity, and indexed according to eligibility for new environmental labelling criteria.
(a) Non-durable household goods is a very complex product group, covering items such as labels, polishes, minor textile items, wrapping paper, brooms and brushes, carbondioxide cartridges and
pesticides. Some of these items are already labelled (some polishes and textile items) while some are potentially harmful in normal application (pesticides). As a third step, the product groups that pass without remarks in Table 4.1 (indicated with italics) are then evaluated on two further criteria:
This is documented in Table 4.2. Table 4.2. Sales volumes in EU-25 in 1999 in GEUR (billion Euros) corrected to EU-15 PPS (purchasing power standard) and steerability of the eligible product groups from Table 4.1.
1) Total values from Eurostat (2004) extrapolated to EU-25 by Nielsen (2004) From the three steps reported above, we arrive at the following products for which we in the following sub-chapters will describe the contributing environmental effects and the potentials for improvements via ecolabelling:
4.2 Car purchase and drivingTaking up approximately 12% of the average household budget and topping the list in terms of environmental impact intensity, automobiles are of obvious interest for ecolabelling. However, it could be argued that cars do not fulfil the conditions of the EU eco-labelling directive, since automobiles “in their normal application could be harmful to the consumer.” In 1997 an estimated 165,000 persons were killed on the roads in the ECE region and more than 6 million persons were seriously injured (UNECE 2004). Out of this number more than half were consumers (car drivers or passengers). On the other hand, it can be argued that accidents are just one of the detrimental effects of car driving, which could be taken into account in the ecolabelling criteria, e.g. in the form of requirements on safety measures for both passengers and other road users. Another argument against ecolabelling on automobiles would be that as a mode of transport it is less environmentally beneign than alternative modes of transport, notably rail transport (Dom & de Ridder 2002). Thus, it could be argued that out of the different transport modes, only railroads should be eligible for ecolabelling (see also Chapter 4.4). However, current car usage shows clearly that often other modes of transport are not seen as realistic alternatives, which would support an ecolabelling initiative that could at least help the consumers reduce their impact of car driving. Leaving these discussions aside, we find that the main environmental effects from automobiles are related to the emissions from fuel combustion during driving. A recent EU Directive (1999/94/EC) requires comprehensive labelling for all new cars providing information on carbon dioxide emissions and fuel economy. The UK Government promotes moving this further towards comparative labels in line with their Vehicle Excise Duty, which are based on vehicles' CO2 emissions and fuel type (CVTF 2002). Also the vehicle production itself contributes significantly to the overall impacts, both due to its chemicals use (VOC emissions), energy use (especially electricity) and materials use (aluminium and steel), thus leaving ample room for developing further ecolabelling criteria relating to the production itself. As a pioneering effort, the car manufacturer Volvo provides environmental product declarations for their S80, S70, S40 and V40 models. Weight reduction is one of the most practical ways to increase the fuel economy of vehicles, and is thus complementary to the efforts to reduce chemical, electricity and materials use in the vehicle production. CVTF (2001) identified several so-called Environmental Rating Systems (ERSs) in the public domain, and state: “These efforts, however flawed, are the only guidance available to consumers and others that wish to understand the relative environmental performance of one model compared with another. Given the lack of such an ERS from either government or industry, it is likely that independent efforts will continue to be developed - whether or not they accord with government or industry needs”. As pointed out in section 1.7.9, the most direct improvements option is to focus on reducing the need for car driving, an issue which cannot easily be covered by ecolabelling. However, there may be possibilities for including ecolabelling criteria relating to equipment that can assist in reducing driving needs, e.g. GPRS systems for improved route planning, and registration equipment that provide driving statistics for improving vehicle usage patterns through mobility management. Registration equipment may also be used for improving driving behaviour towards a better fuel economy and reduced emission intensity. We thus conclude that there are many options and arguments for developing ecolabelling criteria for cars. 4.3 Tents and outdoor equipmentEcolabelling criteria already exist for textiles in general, but these do not cover textiles used in tents. It is therefore obvious to consider if these criteria could be extended to cover textiles used in tents. 4.4 Transport servicesTransport services include mainly passenger transport by railroads, busses (both regular and chartered), taxis, aeroplanes (regular and chartered), and passenger ships. Included in this product group is also, but with less importance, facilities for car parking, removals companies, travel agents and tourist agencies. We concentrate here on the passenger transport. The different transport modes are in principle comparable, since they all transport passengers a certain distance, although with differences in speed and comfort. Thus, it could be argued that ecolabels should only be applicable to the transport mode with the least environmental impact per passenger*km, which (disregarding walking and bicycling) is rail, and busses when rail is not available (UITP 2003). This could also be seen as an argument against ecolabelling automobiles, see Chapter 4.2. However, as an alternative, rail transport is obviously limited to the areas covered by the rail network. Furthermore, from current usage patterns we can see that even when rail is a physically existing alternative, users often do not accept it as a comparable mode to cars and aeroplanes. This means that an ecolabel on a specific transport mode would not be able to move many passengers from other modes. Considering instead an ecolabel for transport services within each specific transport mode encounters another problem, namely that often only one transport option exists within each transport mode, e.g. only one rail or bus line connects two specific geographical points. An ecolabel would not be able to increase use of this option. An exception is taxis and chartered operators, for which ecolabel criteria would be possible, in parallel to the considerations for private cars (see Chapter 4.2). A more promising option may be to develop ecolabel criteria for mobility management schemes, e.g. the management and consulting service reducing the overall impact of transport within a specific organisation (see e.g. www.vtpi.org and www.epommweb.org). This would overcome the limitations of ecolabels on specific modes of transport, and could generally improve consumer travel options, encourage competition and innovation, correct mispricing by converting fixed costs into variable costs, and allow consumers more pricing options (VTPI 2004, page “Market Principles - TDM Impacts on Market Efficiency and Equity”). 4.5 Energy for temperature regulation in buildingsWhile the emissions related to temperature regulation in buildings are connected to the energy carriers, the heating or cooling requirement is determined by characteristics of the building. Thus, ecolabelling could be implemented both as an energy labelling of buildings and as an ecolabelling of energy carriers according to their environmental impacts per supplied volume of heating or cooling. Energy labelling of buildings could be based on standard calculations of heating and cooling requirements. The EC Directive 2002/91/EC sets out energy performance requirements for new buildings and larger renovations as well as requirements for energy performance certificates when buildings are constructed, sold, or rented out. However, the directive does not cover the existing, smaller buildings, which contribute to the major part of the energy use, nor does it place any specific technical requirements on how energy performance should be calculated. An energy label could have a wider application area and include more specific requirements for the quality and thoroughness of the underlying energy audit e.g. requiring thermographic inspection of insulation defects and a quantification of the air leakage. A Finnish project on energy certificates for buildings (Aho et al. 1997) suggested that the most appropriate means of introducing an energy label to the market is to combine it with the existing energy audit or building assessment schemes. A general reservation towards voluntary energy labelling of buildings is that purchase or renting of a dwelling is a decision made only a few times in the lifetime of a consumer, which may make the effect of labelling questionable. The incentive for a seller or lessor to have the building labelled is also unclear. More direct incentives that integrate the cost of heating and cooling in the price of the dwelling are likely to have much more effect. Ecolabelling of energy carriers is straight-forward, since the environmental impacts per supplied volume of heating or cooling are easy to establish. Renewable energy sources are obvious candidates for ecolabelling. Ecolabelling criteria for solar collectors have been developed in Germany (RAL 2003), mainly including an energy efficiency requirement. 4.6 CandlesThe main environmental impact from candles appears to come from their release of CO and soot in the use phase. Besides the obvious health risks involved, soot also leads to increased demand for cleaning and renovation of household textiles, re-painting walls and ceilings, etc. Also other air emissions during combustion, such as VOCs, may be of importance, especially when considering that the emissions primarily affect the indoor climate. Imported candles may still contain lead in the wick. Scented candles obviously contain more VOCs. Candles are produced largely from stearic acid and/or paraffin, with mainly vegetable and mineral origin, respectively. Soot (and CO) formation depends on both the raw material type (basically the carbon/hydrogen ratio of the fuel), the purity of the raw materials and additives, and the correct dimensioning of the wick to the candle (Matthäi & Petereit 2004). High content of iso-paraffins or a high degree of branched molecules will decrease the flame temperature and result in a higher tendency of the flame to soot. Other environmental advantages and disadvantes of different raw material compositions warrant further investigation (differences in environmental impacts during production, differences in net CO2-emissions). A German product standard for candles (www.kerzenguete.com) contains procedures for optical inspection of the burning behaviour and the purity of raw materials, e.g. sulphur content. It explicitly forbids azo-colourants. A proposal has been made to include also a method for quantification of soot emissions (GK 2002). There is work in progress to develop a European (CEN) standard (Matthäi & Petereit 2004, Thorhauge 2004), convering fire safety specifications (e.g. flame size, liquid temperature, wick stability, self-extinguishing) and safety signs and warnings, as well as a measuring method for a soot index. These standards thus provide a good starting point for developing ecolabelling criteria. Representatives from the major industries (Dreyer 2004, Kilström 2004) have indicated willingness to participate constructively in such a development. 4.7 ElectricityThe environmental impact from electricity production differs widely, depending primarlily on its source (hydro, nuclear, wind, photovoltaic cells, biomass, lignite, hard coal, oil or gas) and secondly on the efficiency of electricity production and transmission. The product itself, electricity, is perfectly homogeneous, and therefore comparable across all sources and production facilities. Thus, it is only meaningful to award the eco-label to the source(s) with least environmental impacts, which typically implies an exclusion of the fossil fuel sources. A possible controversy may arise in relation to nuclear power, as its environmental impact is of such different nature than the other power sources, that a comparison is complicated. Being based on a limite resource base (uranium), nuclear power is not counted as a renewable energy, and its severe problems relating to security and long-term waste has generally excluded it from being considered as an environmentally acceptable alternative. On this background, any further expansion of nuclear power in Europe has until recently been regarded as unlikely (EC 2000, Mantzos et al. 2003). However, the Finnish decision in 2002 to build a new nuclear power plant has challenged this view. The background for this shift in opinion has been the growing focus on global warming, where nuclear power is seen as a quick solution to avoid further increase in CO2 emissions (CEC 2002d). Some of the most promising renewable power sources, notably wind and photovoltaic cells, are dependent on natural fluctuating flows, which implies that they are best seen as components in a mix with other back-up sources that can fill in and stabilize the fluctutations. In this context, it is also important to consider how the total mix of sources will be able to cover peak demands, both daily (morning and evening peaks) and seasonal (cold or hot seasons with extraordinary heating or cooling requirements). For these reasons, we recommend to develop ecolabelling criteria for self-reliant mixes of electricity sources, not for individual sources alone. The EU Directive 96/92/EC of June 2003 requires that electricity suppliers disclose their preceding year's fuel mix, broken down on sources, including also information on emissions of CO2 and radioactive waste. This could be seen as a first step towards a common labelling, but does not in itself include any incentives to minimize the environmental impacts neither from the current production nor from any new capacity installed. Many labelling initiatives for so-called “green” electricity already exist. Some of the more well-known are the Swiss naturemade-Star (www.naturemade.org), the German OK-power (www.ok-power.de) and Grüner Strom Label (www.gruenerstromlabel.de), the Austrian ecolabel richtlinie UZ46 “Grüner Strom,” and the Swedish “Bra Miljöval” (www.snf.se/bmv), which is also sold in Denmark as “Naturstrøm” by NESA. A total of 18 labels have been reviewed by White & Vrolijk (2003). The labels have very different concepts of what is meant by “green” electricity, and often include different levels of compliance, some based on a minimum supply from “new” plants, i.e. plants constructed after a certain date, others based on matching current production with current demand. Most of the existing labels allow the inclusion of both hydropower and electricity from direct biomass combustion, which from an ecolabelling perspective appears questionable; see also the discussion of individual power sources below. Some labels even allow co-generation to be a part of the fuel mix. Some labels are more restrictive, like Københavns Energi's “Solstrøm” based exclusively on photovoltaic cells, but resulting in very high prices for the labelled products. Regarding hydropower, the main environmental concerns are the disruption of the reservoir areas and the barrier effects in relation to fish migration. As a renewable energy source with very limited emissions to the environment, it would be an obvious candidate for ecolabelling, if further expansion of production volume were possible. However, due to its relatively large-scale effects on the landscape, there are few locations in Europe where an expansion is likely (Mantzos et al. 2003). Due to the low cost of production, hydropower will at all times be utilised to the maximum possible, which makes it irrelevant to promote the production through ecolabelling. As has been pointed out by Weidema (2001), such labelling may mislead consumers to think that their purchase of labelled electricity leads to an increased production of hydropower, when what in fact happens is only a reduction in sales of non-labelled hydropower from the same production facilities, thus having no net effect on the environment. Or in the words of the Finnish Consumer Ombudsman: “power companies now sell as green electricity the same electricity which they used to sell cheaper without a green label. Practically all the electricity which is now sold as green is produced in the same way as before. Emphasizing the environmental effects of consumers choice of electricity is therefore misleading.” (Kuluttajansuoja no.2, 1999). The Swiss Naturemade-Star label was one of the first to take steps to avoid such consumer mis-information, since they include a requirement that the entire additional revenue from selling labelled hydropower is to be used for additional distribution and marketing costs for labelled electricity, ecological improvements at the power plants, and a so-called promotional model (Fördermodel) implying that per kWh naturemade-star hydro power, 0.025 kWh “new” naturemade-star renewable electricity (wind, biomass, photovoltaics) must be sold. Such promotional models are now included in other labels, and is one of the key requirements in the pan-European EUGENE labelling initiative (www.eugenestandard.org). However, even though such arrangements reduce the possible problems involved, they do not in themselves provide an argument for including old hydropower plants in the power mix for ecolabelled electricity. With the application of appropriate promotional models, one could equally well argue for the inclusion of coal-fired power plants in the power mix. The main motivation for including hydropower in the “green” electricity mix, is to reduce the overall price of the labelled electricity, with the aim of reaching a larger customer group. However, such “manipulating” of the price of ecolabelled electricity may in the long run harm the credibility of the ecolabelling concept. Thus, notwithstanding that even hydropower can be produced with more or less environmental impact (see e.g. www.greenhydro.ch), we generally advise to avoid inclusion of hydropower in ecolabelling programmes, due to its specific market situation (low production costs, low environmental impact, few options for expanding the production volume). At least, to avoid mispricing, the share of hydropower in a specific ecolabelled power mix should not exceed the share that hydropower has in the total power mix. In terms of air emissions, direct biomass combustion is not very different from fossil fuel combustion, although the CO2 emission can be argued to be environmentally neutralised by the equivalent uptake of CO2 during biomass production. The latter requires, however, that there is no net change in CO2 release between the biomass production and combustion system and what would have occurred in the absence of biomass harvest (the undisturbed reference system). Anaerobic biomass fermentation and subsequent combustion of the biogas provides a biomass based power source with lower air emissions, and is a likely candidate as the back-up fuel stabilizing the fluctuations in an electricity mix based on wind and photovoltaic cells. Wind energy and photovoltaic energy are likely to play key roles in an ecolabelled electricity mix. Both have their main environmental impacts in the production of the power plants (wind turbines and photovoltaic cells), with some concern also due to the impact on natural areas (wind turbines mainly as an aestethic problem, photovoltaic cells more as an area consuming activity). With the recent large turbines, wind power is close to being competitive on normal market conditions, which could put the role of ecolabelling into question, as has been done for hydropower: If wind power capacity is anyway expanded as quickly as possible for purely financial reasons (probably mainly limited by technological lock-ins within the energy planning and political decisions on location of wind parks) an ecolabel would not be able to influence this expansion further. In spite of the complications mentioned, we believe that it should be possible to design ecolabelling criteria for electricity in such a way that it favours the expansion of a self-reliant mix of power sources with the lowest possible environmental impact. 5 Resource and waste flows5.1 Introduction to material flow analyses 5.1 Introduction to material flow analysesThe Input-Output-tables applied for the prioritisation in Chapter 1 can also be applied for material flow accounts and analyses (MFAs). In fact, the emissions recorded for each industry in the environmentally extended Input-Output-tables, are just one specific type of material flow. Resources enter the economy through a limited number of industries, notably agriculture, fishery, forestry and mining. From these primary industries, the materials flow into the other industries, where losses occur in the form of wastes and emissions, before the remaining material flows with the products onto the next industry or into final use, where further losses occur. A material flow analysis may be limited to a specific geographical area and/or a specific time period, or it may apply a product perspective, like the environmental analyses in Chapter 1 (Hinterberger et al. 2003). When limited to a specific geographical area and/or a specific time period, there will typically be a difference between materials in and out of an industry, i.e. a change in stock. In contrast to this, the product perspective is a steady-state perspective, i.e. all materials entering the economy are traced until they leave the economy again as waste or emissions, even when this takes place at very different places or points in time. Stock changes are only temporary, and for each product, the materials in must equal the materials out. Both primary and secondary materials need to be accounted for in order to make the mass balances complete. To allow a full material flow analysis, both the input of materials in the form of resources and the output of materials in the form of products, waste or emissions needs to be known for each industry. The amounts of secondary materials supplied and used by each industry must also be known. The difference between materials in and out of an industry is its change in stock. For the foreign industries, we have not been able to find data on amounts of materials in products and waste, nor on recycled materials or changes in stock. This implies that it has not been possible to trace the input of foreign materials through the economy and thus to identify in which foreign industries they build-up as stock and in which foreign industries they become waste, and how large a share of materials are incorporated in products imported into Denmark. The Danish import statistics provide us with information on the total weight of products entering Denmark, but it is only possible to identify the material composition for the most homogeneous product groups. Without having the amount of imported materials as a starting point, it is impossible to establish the total Danish waste potential per material and product, even though it is possible to identify the amounts of specific materials in products and waste at the level of Danish industries from Danmarks Statistik (2003b) and Dall et al. (2003). See also Christensen et al. (2002) for recommendations on improving the data basis for MFA. Thus, in this chapter, we limit ourselves to prioritising the product groups according to:
We account for the material inputs (both foreign and Danish) divided on the following types:
For these material types, we account for both the amounts extracted for use, and the related unused extraction (mining overburden, unused straw, fish discards etc.). The latter corresponds to the amount of bulk waste in the resource extracting industry. The sum of used and unused extraction is also known as the Total Material Requirement (TMR), see Pedersen (2002). For the Danish industries and final use, we account for current amounts of deposited waste, divided on the following groups:
Iron, steel, coal slag and ashes, products from flue gas cleaning, bricks and concrete are all regarded as completely recycled and therefore not included under bulk waste in the Danish statistics. In addition, we account for hazardous waste from Danish industries and final use. 5.2 Data sources5.2.1 Danish resource extractionFor the Danish resources, we have used the same data sources as Pedersen (2002) for the DMI and TMR for 1997, i.e. the Energy Statistics, Agricultural Statistics and Resource Extraction Statistics from Statistics Denmark. We also applied the same material density conversion factors as applied in the calculation by Pedersen (2002). Our data are therefore basically an update of the DMI and TMR data of Pedersen (2002). A minor difference compared to Pedersen (2002) is that we did not include aquaculture products as primary resource extraction, as they are mainly fed on fish fodder produced from wild fish, and therefore resemble other animal husbandry products. The ratios for unused to used resources have also been taken from Pedersen (2002). 5.2.2 Foreign resource extractionWe supplemented the US American NAMEA (Suh 2003) with data for resource extraction based on the USGS data (USGS 2001) for apparent consumption less secondary supplies, and FAOSTAT data on food biomass. This results in resource consumption intensities for each imported product group. We validated the resulting resource consumption intensities against the weight recorded in Danish import statistics for those commodity groups where the resources occur as relatively pure products, i.e. “Basic ferrous metals, ROW” for iron, “Basic non-ferrous metals, ROW” for the remaining metals, coal, crude oil and natural gas as specific commodities, “Gravel, clay, stone and salt etc., ROW” for minerals, “Forestry products, ROW” for fibre biomass, and “Agriculture, ROW” for food biomass. We found very good correspondence between the import statistics and our calculated values for iron, aluminium, copper, and coal, which are all relatively homogeneous products. Also for food biomass, the correspondence is reasonable (calculated biomass extraction 1.17 E+06 Mg; actual imports 0.90 E+06 Mg), considering the very diverse nature of this product group, which also includes some animals and animal products. For other metals than Fe, Al and Cu, our calculated values were only ¼ of the actual weight of the Danish imports recorded under “Basic non-ferrous metals, ROW.” This may be explained by the metals imported to Denmark having a different composition than the average composition of non-ferrous metals in the US American economy (metals imported to Denmark generally being more expensive than the average). We therefore corrected the resource extraction for “Other metals” imported under “Basic non-ferrous metals, ROW” with a factor 4. The content of other metals in other imported products were not corrected, since it is reasonable to expect that the average composition of other metals in these products correspond to the US American average. For resource extraction of crude petroleum and natural gas recorded under “Coal, crude petroleum, natural gas etc., ROW”, a similar correction factor of 0.58 was applied to fit the actual weight of imported oil and gas. Again, this correction was not seen as relevant for the resource extraction of crude petroleum and natural gas for other imported products. For sand, gravel, stone and clay, the calculated extraction for “Gravel, clay, stone and salt etc., ROW” is more than 4 times the weight of the actual import. It is likely that for such bulk materials, materials that are imported (and thus transported over long distances) are of higher value than the average mineral in the US economy. This is less pronounced for other minerals (chemical and fertiliser minerals) where we see a good correspondence between the calculated values and the actual imported weight. We therefore corrected the resource extraction for sand, gravel, stone and clay for “Gravel, clay, stone and salt etc., ROW” with a factor 0.25. As above, this correction was not seen as relevant for other imported products, where the mineral use must be expected to take place closer to the extraction. Also for fibre biomass, the calculated biomass resource extraction for “Forestry products, ROW” was larger (1.9 E+06 Mg) than the weight of the actual import (0.7 E+06 Mg), again probably due to the import being of higher value than the average wood in the US economy, which is mainly pulpwood. This is confirmed by the much better correspondence between the calculated and actual values for imports under “Pulp, paper and paper products, ROW” as well as “Textiles, ROW”. We can therefore ascribe the deviations to the inhomogeniety of the fibre resources, and have not made any corrections to the calculated data. We have applied the same ratios for unused to used resources as Bringezu and Schütz (2001), as reported in the dataset A of Moll et al. (2003). We have used the factors for imports to EU for metals, coal and oil, and the factors for EU for natural gas and minerals. For fish discard, we have applied a factor 0.25. For fibre biomass we have applied a factor 0.2, corresponding to the value used for forest biomass in the calculations by Pedersen (2002). In our calculations, forest biomass constitutes 80-90% of the fibre biomass extraction for imported products, and in view of the above-mentioned large uncertainty on the fibre biomass values, the factor 0.2 has been applied to all fibre biomass, although e.g. the amounts of unused straw is likely to be of the same size as the amount of used straw. 5.2.3 Current amounts of deposited and hazardous waste in DenmarkWe have used the Danish Waste Statistics for year 2000 (DEPA 2002) to supplement and correct the information in Dall et al. (2003), where deposited waste is specified for 27 material groups. The resulting values are shown in table 5.1, also showing how these amounts were allocated to the waste supplying industries and final uses. For hazardous waste to deposits, the dominating sources according to DEPA (2002) were in year 2000: Asbestos dust from repair and maintenance of buildings (8812 Mg), sludge and dust from flue gas cleaning from metal casting (248 Mg), and sludge from metal-hydroxides and –oxides (3611 Mg). The latter are allocated to galvanizing industries based on their expenditure on chemicals for galvanizing (zinc oxides and peroxides, chromium oxides and hydroxides, hydrogen chloride, aluminates, potassium dichromate, hydroxides, ester salts of phosphoric acid, hydrogen fluoride, and sulphuric acid). Other hazardous wastes are not considered. Table 5.1 Total amounts of deposited waste in Denmark, year 2000
5.3 TMR for Denmark 1999From the data reported in Chapters 5.2.1 and 5.2.2, we can calculate the TMR for Denmark, as presented in Table 5.2. For easier comparisons, the values are also given in percentages in Table 5.3. Table 5.2. Total Material Requirement of Denmark 1999 in Mg
Table 5.3. Total Material Requirement of Denmark 1999 in % of column sums
Comparing the results for 1999 to the TMR for 1997 calculated by Pedersen (2002) in Table 5.4, we see a 57% increase in foreign resources extracted for use. Some of this increase is likely to be due to the change in methodology (the 1997 data include only the weight of imported products, while the 1999 data include also resources used in upstream foreign processes), but some of the difference may also be explained by increased imports. It is nevertheless interesting to note that there is not a similar increase in the related unused extraction. All in all, the difference in methodology does not appear to be very important for the overall result. Table 5.4. Comparison of TMR for 1997 and 1999
5.4 Product groups with high material requirementsFrom Tables 5.2 and 5.3 it is obvious that the fossil fuels and sand, gravel and stone make the largest contributions to the overall TMR, with biomass as another important group. It is therefore not surprising to find that the product groups with large material requirements (Tables 5.5 and 5.6), are similar to those found in Tables 1.2 and 1.3 for global warming (which is to a large extent governed by the combustion of fossil fuels), mixed with product groups where sand, gravel and stone are major components (the extracting industry exporting these raw materials, and the major consuming industries: construction materials and civil engineering). Food products and horticultural products rank high, both for their consumption of energy carriers and for their biomass extraction. Table 5.5. Product groups within Danish net production with the largest Total Material Requirement (TMR), in Mg and % of total TMR from Danish production and consumption.
1) The value shown represents the total impact from Danish electricity and heat minus the values for “Electricity (unconstrained)” and “District heat (unconstrained)” Table 5.6. Product groups within Danish consumption with the largest Total Material Requirement (TMR), in Mg and % of total TMR from Danish production and consumption.
Similar findings appear when looking at product groups with high total material intensity, i.e. parallel to the results in Chapter 1.4.2. Except for the extracting industry “Gravel, clay, stone and salt etc.”, the same product groups as for global warming (see Tables 1.18 and 1.19) dominate the result. Materials that contribute less to the overall TMR, notably the metals, will obviously not contribute to place product groups high in the ranking in Tables 5.5 and 5.6. Therefore, separate analyses for each material are especially relevant for the metals. As an example of the results that can be provided for each material, using the project database (see Chapter 7), the results for metals are presented in Tables 5.7 and 5.8. It appears that for the major metals (Fe, Al, Cu), it is the same product groups that are have large requirements for the different metals, and even in approximately the same ranking order. This may to some extent be due to the aggregation that occurs in the IO-tables, i.e. in a more disaggregated analysis for specific products it is likely that a larger difference will be found between the requirements for the different metals than what appears from Tables 5.7 and 5.8. Table 5.7. Product groups within Danish net production with the largest metals requirement in Mg and % of total requirement from Danish production and consumption. The product groups included represent more than 50% of the total requirements for each metal. The data are for extracted metals for use, not including related unused extraction.
However, even at this level of aggregation, it can be seen that iron is used relatively more than the other metals in engines, power plants, machinery in general, construction and civil engineering. Aluminium and copper, on the other hand, is used more in hand tools & packaging, and radio & communication equipment, aluminium also with a larger share in restaurants, while copper has a somewhat lower share in motor vehicles. Table 5.8. Product groups within Danish consumption with the largest metals requirement in Mg and % of total requirement from Danish production and consumption. The data are for extracted metals for use, not including related unused extraction.
5.5 Product groups with high amounts of deposited waste in DKFrom the way deposited waste was allocated to the waste supplying industries and final uses, as reported in Chapter 5.2.3, it is not surprising to find that the main product groups contributing to deposited waste in Denmark are dwellings and repair and maintenance of buildings in general, the sugar industry (due to the soil from beets), sewage treatment (sand, fibres and food biomass), and civil engineering (mainly removed soil). Thus, for waste, the product-oriented approach does not provide substantially more relevant information than already provided by the waste statistics. However, it may be interesting to use the project database (see Chapter 7) to investigate the source of specific types of waste. As an example of this, we show in Tables 5.9 and 5.10 the product groups contributing to deposited copper waste in Denmark. Since marine engines, compressors, hand tools, packaging etc., which contribute most to the deposited copper waste, are not products that contribute much to Danish private and public consumption (they are nearly all exported), Tables 5.9 and 5.10 look quite different. Dwellings is the first product group, while most of the copper waste in following product groups in Table 5.10 can be traced back to their input of marine engines, compressors etc. For the product groups in private consumption, the dominating source is copper in hand tools etc. Table 5.9. Product groups within Danish net production with the largest contribution to deposited copper waste in Denmark, in Mg and % of total deposited copper waste in Denmark from Danish production and consumption.
Table 5.10. Product groups within Danish consumption with the largest contribution to deposited copper waste in Denmark, in Mg and % of total deposited copper waste in Denmark from Danish production and consumption.
It is interesting to note that there is a good correspondence between the product groups in Table 5.9 (deposited copper waste) and those for copper requirement in table 5.7. A similar correspondence is found between most of the product groups in Table 5.10 and those for copper requirement in Table 5.8. A notable exception is copper in automobiles, topping the list in Table 5.8 but apparently not contributing to deposited copper waste according to Table 5.10. This may point to a better separation of copper during waste treatment of automobiles, but may also be an artefact from the allocation of deposited copper waste, which is done exclusively over the industries supplying commodity V740400 Copper waste. It has not been possible within this project to investigate this further. 6 Detailed analysis of four specific areas6.1 Introduction 6.1 IntroductionIn this chapter, four specific product areas are analysed in more detail. These analyses are intended for use by the product panels of the Danish EPA, which currently cover the four areas agriculture/foods, electronics, retail trade and textiles. The analyses are based mainly on the database developed by the project (see Chapter 7), and highlights environmental impacts and improvement potential in more detail than what has been done in relation to the overall prioritisation in Chapter 1. The analyses have been made in cooperation with the product panels, in order to make the analyses as relevant as possible for the panels. 6.2 Agriculture/foodsAgricultural products are mainly food products. Important exceptions are fur (for wearing apparel) and straw (for energy). Pork and milk products make up approximately half of the value of Danish agricultural production. Improvement options in the food sector were already discussed in Chapter 1.7.2. This sub-chapter will therefore focus on how food products are consumed, in particular differences between catering and household preparation. We have calculated the supply of individual foods in g per person per day for private consumption, consumption in restaurants and hotels, and consumption in hospitals and public institutions. This has been done on the basis of the total supply of food products for the Danish market as given by the supply-use tables (Danmarks Statistik 2003b), where many flows are provided in both monetary units and mass. Missing mass flows have been estimated by using the kg/price relationship of the major flow for each individual commodity. Private use in agriculture (negligible) has been disregarded. Supply from baker's shops has been calculated as the food raw materials entering into the baker's shops. The resulting data for each individual commodity has been re-aggregated into the food groups presented in Table 6.1. The data for restaurants include industry canteens with separate accounting. Minor industry canteens without separate accounting make up a very small part of the overall food consumption and have a composition of food products practically identical to that of canteens in hospitals and public institutions, and has therefore been included under that heading. Table 6.1. Total supply of foods (in g/person/day) for private consumption and catering
¹ The non-meal related share of private food consumption has been estimated in the following way: For baker's produce, ice cream, chocolate, and confectionary products this is the surplus consumption relative to restaurants and hotels. For milk products, this is the commodity ”other beverage products”. For fruits and vegetables, this is all fresh fruits and nuts. For ready-made food, this is all food preparations (baby food etc.). For mineral water, this is the surplus consumption relative to hospitals and public institutions. Although other beverages (coffee, wine, beer) may also be non-meal related, their consumption per person per day is relatively stable across the three consumption domains, so we have not found any reason to separate out the non-meal related share. From Table 6.1 it can be seen that 76% of the weight of foods are consumed in private households (431+162 out of 2713 g/person/day) against 18% in restaurants and hotels and 6% in hospitals and public institutions. However, since these data include also non-meal related food items, they do not provide a good indication of how many meals are prepared from these supplies. A better indication of the relative number of meals consumed can be obtained by looking at the meal-related amount of basic foods (potatoes, rice, other cereals, noodles, bread & bakery products), which gives the following distribution of meals: 62% in private households, 28% in restaurants and hotels (23% in restaurants and 5% in hotels) and 10% in hospitals and public institutions. Using this as normalisation reference, we can compare the composition of meals in the three consumption domains, as done in Table 6.2. This shows that meals in private consumption in general require more raw materials than catering meals. Half of the difference can be explained by dairy products, while another important contribution come from a larger consumption of meat per meal in private households. An important part of the explanation is probably a larger percentage of waste food in households compared to catering, especially for milk and vegetables. According to Table 6.2, the composition of the meals is also quite different among the three consumption domains:
Table 6.2. Composition of daily food supply for a full day of meals in private households and catering (based on data from Table 6.1, scaled to meal-related basic foods)
From the above calculations, we can estimate the total number of meal-days that Danes spent at home to be 62% * Danish population * 365 days = 1.2 E+09 meal-days, and the number of meal-days spent at restaurants to be 23% * Danish population * 365 days = 446 E+06 meal-days. The corresponding expenditure is 100 E+09 DKK and 36.6 E+09 DKK (including VAT), showing a surprisingly equal cost of private meals and restaurant meals. This information may be further combined with the corresponding data on environmental impact from the expanded NAMEA on household meals (food, storage, cooking and dishwashing [8]) and the industry ”Restaurants and other catering,” respectively, resulting in the comparison presented in Figure 6.1. From table 6.2 it can be seen that the most important difference is due to the larger consumption of meat in private meals. Figure 6.1. Relative environmental impact of a full day of meals at restaurants and in private households. Table 6.3. Most important processes contributing to the overall result in Figure 6.1 (in % of total; sorted by right column; all 8 impact categories given equal weight)
6.3 Electrical and electronic equipmentIn the Danish NAMEA (Danmarks Statistik 2003a), the electronics sector (broadly interpreted) is divided in five industries (turnover in brackets):
Domestic cooling equipment constitute about half of the turnover in the first of these industries. Since domestic cooling equipment has a somewhat different composition and environmental profile than the rest of the industry (producing items such as stoves, heaters, vacuum-cleaners and tumble-driers), we have split out domestic cooling equipment into its own industry. All resulting six industries have roughly the same pattern of environmental impacts, but the level of impact per DKK varies between them, see Figure 6.2. Electrical machinery and domestic appliances are at the high end, while medical and optical instruments are at the low end. This reflects the larger share of wages and profits in the expenditure of the manufacturers of medical and optical instruments. Figure 6.2. Environmental impacts (in person equivalents per MDKK) caused by six electronics industries. The main impact categories of concern are human toxicity (mainly due to the heavy metal emissions related to the use of metals) and photochemical ozone formation (mainly due to the use of organic solvents and plastics). The distribution of the overall impacts on the contributing processes is shown in Table 6.4. Table 6.4. Most important processes contributing to the overall result in Figure 6.2 (in % of total; sorted by the column for Electrical machinery; all 8 impact categories given equal weight)
The most obvious way of reducing the toxic releases from the basic metals industries is to increase the recycling of the metals, thus completely avoiding the primary processes. This would also reduce other emissions. The substitution of metals by e.g. new composites will have the same effect. For solvent emissions several reduction options exist, both preventive (modifying process equipment and conditions) and end-of-pipe (combustion). The data in Figure 6.2 and in the database from the project (see Chapter 7) are provided per DKK output from each industry, i.e. all products from an industry are assigned the same environmental impact per DKK. An advantage of this is that it allows comparisons across very different products, which may be especially relevant for the electronics sector, where each industry have a very diverse product composition. A disadvantage is that the same DKK's may represent very different inputs in both weight and materials. Therefore, the data can only be used as a very rough representation of an average product, from which individual products may deviate significantly. The data above represent the cradle-to-gate environmental impacts of the electrical and electronic products, i.e. wholesale, retail, use stage and post-consumer waste handling are not included. To obtain life cycle data for electronic products, these stages should therefore be added to the data above. For an individual product, the electricity use during the use stage should be calculated from the product specifications and the lifetime of the product. The environmental impacts of this electricity use may then be added, e.g. by using the process “Electricity (unconstrained), DK” for a product used in Denmark. For groups of products, such as cooling equipment, cooking equipment & dishwashers, washing equipment, vacuum cleaners, TV & computer, energy use may be estimated from Dall et al. (2002), resulting in the values in Table 6.5. Table 6.5. The contribution (in %) of life-cycle stages to the overall environmental impact and Global Warming Potential (GWP) of some groups of electronic products.
6.4 Retail tradeIn the Danish NAMEA (Danmarks Statistik 2003a), retail trade is divided in six groups:
Furthermore, sale of motorvehicles is a separate category, which will not be treated further here. All six groups of retail trade have roughly the same pattern of environmental impacts, but the level of impact per DKK varies between them, see Figure 6.3. Service stations and department stores are at the high end, while retail trade of pharmaceuticals and cosmetics is at the low end (with 40-55% of the impact per DKK of the service stations and department stores). This reflects the larger share of wages in the expenditure of retail trade of pharmaceuticals and cosmetics.
Figure 6.3. Environmental impacts caused by 6 types of retail trade. Out of the total environmental impact of Danish consumption, retail trade contributes with 1-5% depending on impact category. However, Danish consumption includes also products like electricity that does not pass through a retail stage, so for typical retail products, the share will be larger. Some selected examples for the impact category “global warming” are given in Table 6.6. Table 6.6. The share of total global warming potential (GWP) caused by retail trade for selected products.
A similar study for selected retail commodities in the USA (Norris et al. 2003) shows that the energy use caused by retail trade make up between 10% (detergents) and 30% (books and computers) of the total life cycle energy consumption of these commodities. On this background, they conclude that e-commerce and direct delivery, which “short-cuts” the retail trade, can reduce pre-consumer environmental impact significantly for some products. However, it should be noted that the environmental impact intensity of the retail trade is below average, see Table 6.7. This implies that if e-commerce and direct delivery are associated with cost reductions, the net effect on the environment could be negative, since the costs saved by the consumers would then be used to buy more products, which on average have more environmental impact. Thus, since retail trade – like other service industries - has a relatively large share of expenditure on wages, it contributes to reduce the overall environmental impact of the overall consumer spending. This points to a possible strategy, in which the retail trade could harvest the advantages of e-commerce while at the same time adding even more to the service they provide; providing more complete solutions to their customers, including e.g. home deliveries, maintenance, on-site repair, and monitoring of the cost and environmental impact of the customers' total consumption. In this way, the retail trade could still contribute to maintain a low environmental impact intensity of the overall consumer spending, while incorporating the savings of e-commerce and direct delivery. Table 6.7. Environmental impact intensity (impact in person-equivalents per kDKK) of retail trade in Denmark, compared to the impact intensity of average Danish consumption and selected consumption (need) groups.
The environmental impacts from retail trade are mainly related to the use of buildings, electricity and heat, office machinery, and freight. The use of buildings (which includes their construction and maintenance) is the major source for the impact categories ozone depletion, acidification, photochemical ozone, and human toxicity, and account for approximately 20% of the global warming potential from retail trade. As pointed out in Chapter 1.7.3, buildings are very complex products, and improvement options will often require coordination between large numbers of actors. The plea from the building panel for stronger and more far-sighted regulatory incentives is also valid for non-residential buildings, such as those used by retail trade. Of voluntary measures, we would recommend knowledge dissemination in the form of general advice and checklists for the personnel responsible for construction and management of the shops. Electricity use is responsible for 27% of the global warming contribution from retail trade, heating adding another 10%, and freight by road 8%. The most direct way of reducing the environmental impacts from electricity and heating are savings in consumption, for which substantial potentials exist, both by improvements in equipment and in user behaviour. With the liberalisation of the energy markets, the choice of renewable energy sources is also an obvious possibility. For road transport, optimising the logistics can reduce the need for driving. In this context, it should be noted that retail trade has a significant influence on the automobile use of private households (24% of private car driving is related to shopping etc.), an impact that is not included in the values for the retail trade. Alternative distribution systems with direct delivery could thus result in improvements far exceeding all other improvements in the retail trade itself. The main contributor from retail trade to the impact category “human toxicity” is non-ferrous metals, which is primarily used in buildings, but also office machinery, electrical machinery, etc. contribute with an important share. The most obvious improvement option for the retail trade is to ensure that the metals in discarded office machinery etc. are recycled. For the impact categories “nutrient enrichment”, “ecotoxicity” and “nature occupation”, the contributions from retail trade are of less importance. When calculating the total environmental impact of a product group, both in the consumption perspective in this project and in typical life cycle assessments, the contribution from retail trade is calculated per DKK retail profit for each individual product group. This means that a product with high retail profit will obtain a larger share of the total environmental impacts from retail trade than a product with low retail profit. As retail profits may vary from a few percent to more than 50% of the price of a product, this may result in a very uneven distribution of the environment-tal impacts from retail trade over the products. Table 6.8 illustrates how the retail profit varies within food products, from a low 13% for bread to a high 52% for fish and sugar, the average being 26% of the product price. Seeing the large importance of buildings, electricity and heat, and freight in the total impacts from retail trade, one could argue that other parameters than retail profits may better reflect the share of the specific product group in the environmental impact from retail trade. Such parameters could be the space taken up by a product (building space), specific electricity requirements (e.g. for cooling), and the weight of the product (when this is limiting freight capacity). Table 6.8. Distribution of environmental impacts from retail trade over food products, based on retail profits
6.5 Textiles and apparelIn the Danish NAMEA (Danmarks Statistik 2003a), the two industries:
are not further subdivided. These industries cover more than 400 commodity numbers, with very different compositions. Especially the fibre origin (mainly wool, cotton, cellulostic fibres, synthetic fibres) may vary, and is often not reflected in the commodity classification. For example, the top 10 commodities from the Danish textile industry from an economic perspective are:
i.e. only for the last one, the fibre origin is specified. The same is true for the foreign (US) data. Although the textile and apparel industries are disaggregated into 23 sub-industries, none of these are specified in terms of fibre origin. For example, there is one industry named “Yarn mills” with input of wool, cotton, cellulostic and synthetic raw materials. This implies that it is impossible to distinguish between the environmental impacts from cotton yarn and synthetic yarn; only the value for an average yarn is available. Since the largest part of the raw materials for the Danish textile industry is imported, our first step has been to disaggregate the most important textile and apparel industries in the US Input-Output table (which is used as a Rest-of-World proxy in the Danish database, see Chapter 2.8) into fibre-specific industries. We have done this by isolating the input of wool, cotton, cellulostic fibres and syntetic fibres for the following industries:
and subdividing these industries into:
each with input of only one of the fibre types (i.e. either wool, cotton, cellulostic fibres or syntetic fibres), while maintaining the average input-output coefficients for all other inputs and outputs (which is equivalent to assuming that all other inputs have a fixed relation to the value of the fibre input). This allows us to distinguish the environmental characteristics of the different fibres, as shown in Figure 6.4. The difference is most remarkable for the yarns, where it is possible to obtain the sharpest isolation of the different fibre inputs, and where the fibre material make up a larger share of the total inputs. Figure 6.4. Environmental impacts (in person-equivalents per kDKK) from apparel and yarns, depending on fibre type. It can be seen that nature occupation, ecotoxicity (from pesticides) and nutrient enrichment are nearly exclusively related to cotton fibres, while photochemical ozone formation and ozone depletion are much more important for the artificial and synthetic fibres (mainly due to solvent use and VOC emissions from refineries and production of syntetic fibres). It should be noted that the low values for wool are due to this fibre being a by-product of the meat industry. To obtain a better model of the structure of the Danish textile industry with respect to fibre types, we constructed a mass balance based on the data provided in the supply-use tables (Danmarks Statistik 2003b), where import and export flows are provided in both monetary units and mass. Missing mass flows have been estimated by the kg/price relationship of the import and export flows for each individual commodity (for input and output flows, respecticely). The resulting data for each individual commodity has been re-aggregated into the product groups presented in Table 6.9. While the inputs to the Danish textile industry are quite well specified in terms of fibre type, the outputs are not, as mentioned above. This implies that it is not possible to establish a well-founded relationship between the output commodities and the incoming raw materials. Of course, we could make a similar subdivision as in the US data, into “Wool textiles, DK”, “Cotton textiles, DK” and “Synthetic textiles, DK” and from this a specific textile with mixed fibre composition could be combined. However, as mentioned for the subdivision of the US industries, this implies an assumption that all other inputs have a fixed relation to the value of the fibre input. While this may be an acceptable assumption when subdividing a fairly uniform industry such as “Yarn mills”, it would be less appropriate for subdividing the much more diverse, aggregated textile industry, where we see a large variation in output value relative to the value of fibre input (reflected in the differences in average prices per kg output; see Table 6.9). We have therefore, in spite of the large uncertainty in such a venture, attempted to suggest a possible split of the different fibre inputs for each of the product groups. This should be seen a first rough assignment, and not as an authoritative reflection of the actual fibre composition of the different products. For example, it is most likely that carpets and sweaters are not made solely from wool, and that relatively more wool should therefore be allocated to other products, such as knitware. However, such changes can easily be made in the database from the project (see Chapter 7) without affecting the overall results. As can be seen in Table 6.9, the value of a textile product does not vary much across different fibre types, but is much more related to the degree of processing. This means that for modelling of a specific textile product, the fibre type of the input can be changed, e.g. from cotton to synthetics, without changing the monetary value of the input, i.e. simply by transferring the purchase value from “Yarn, cotton” to “Yarn, synthetic.” To keep the model of the entire textile industry consistent, it is of course necessary to match a change in input composition for a specific product with an opposite change for one or more of the other products, so that the overall mass balance is kept intact. However, for modelling of a specific product, such concerns are less important. In addition to the inputs to the textile industry allocated to specific products in Table 6.9, we allocated some minor plastic and metals inputs to household textiles, fish net, mattresses and an additional product group “textile accessories” to eliminate these articles from the “pure” textile products. Also, zippers were allocated 50% to tents and the rest evenly over knitware and textile goods n.e.c. according to production value. Table 6.9. Tentative mass balance for the Danish textile industry in 1999
Figure 6.5 shows the resulting environmental impact intensities for the 12 textile product groups with largest turnover compared to the original average textile industry (the column on the left). The figure mainly reflects the importance of the fibre type, clearly showing the importance of the cotton input, and also showing the importance of the assumption that carpets and sweaters are purely made from wool. Figure 6.5. Environmental impact (in person-equivalents per kDKK) of the average textile industry and 12 of its constituting product groups. In parallel to the mass balance for the textile industry, a mass balance for the Danish apparel industry could be constructed. However, this would become even more speculative, since approximately half of the textile input is only specified as “knitware”, not by fibre type. The rest of the textile input is mainly cotton and synthetic fibres, in the typical 65/35 proportion. A reasonable assumption could be that the unspecified knitware is composed in the same proportion. Different types of clothing have very different mass/value relationships, with synthetic nightgowns at the extreme low end with 0.06 g/DKK over the average 4 g/DKK to 10 g/DKK for worker's clothes. Since the textile input is responsible for the main part of the overall environmental impact, it would be reasonable to specify the textile input based on the weight of the apparel output (adding an average loss factor of 8%) and then add the non-textile input up to the full production cost. To allow for this, we provide in the database from the project (see Chapter 7) an average input coefficient for the non-textile input to the apparel industry. In the use stage of textiles and apparel in private consumption, the processes connected to washing and cleaning (washing machine, electricity, detergent, laundering and dry cleaning services) contribute 19% of the overall life cycle impacts of the textile and apparel products and 34% of the life cycle impact of global warming for these products. The industrial laundry service, where textiles are supplied as part of the service, does not appear as a separate industry in the Danish NAMEA, as it is included in “Service activities n.e.c.” We have therefore separated “Service activities n.e.c.” into its constituent parts: “Laundries and dry cleaners”, “Hairdressers and other beauty shops” and “Funeral services” based on data provided in the supply-use tables (Danmarks Statistik 2003b) and data on the three corresponding industries in the US NAMEA (Suh 2003). The resulting environmental impact intensity for laundries is approximately 50% higher than for the original aggregated industry. For the resulting industrial laundry service, the textile component is only responsible for approximately 20% of the overall environmental impact, while the detergents contribute with approximately 50%, mainly due to VOC emissions. This points to a more efficient use of the typical textile in industrial laundry service compared to the textiles used in private consumption. 7 Database development7.1 Introduction 7.1 IntroductionThe database developed in this project provides a set of background data for lifecycle assessment of products used and/or produced in Denmark. The IO-based background data can be used to fill gaps in LCAs where specific process data are missing, and at the same time provide a basis for prioritising future data collection. The database is provided in formats compatible with the EDIP LCA-database administrated by the Danish LCA Centre (i.e. SimaPro and GaBi data formats). In the GaBi version, only terminated data per product group is provided, since the GaBi software does not yet handle the endless loops which are an inherent feature of IO-data. However, GaBi-users may analyse the full data in the free demo version of SimaPro, which can be downloaded at www.simapro.com/simapro. The database is provided both as an attributional version where all the links between industries contribute proportionally to the result and a market-adjusted version where market constraints are taken into account as described in Chapter 2.9. Requests for access to the database should be directed to the Danish LCA Centre <info@lca-center.dk>. This chapter has been prepared with contributions from Niels Frees from the Danish LCA Centre, who reviewed the database and suggested improvements for the user-interface. 7.2 Adding physical unitsThe supply-use tables (Danmarks Statistik 2003b) provide data as to which commodities are produced by each industry (unfortunately only in Danish language). For some of these commodities, also data in physical units are provided. For each industry and final consumption group, the 15 most important commodities (from an economic perspective) have been placed in the comment field of the database (see Chapter 7.4). For the industries, the calculated basic price per physical unit has been added, when available. The information can be applied in two ways:
The latter application is complicated by the large number of products typically produced by each industry, out of which physical data are only provided for some. Also, physical data does not necessarily mean mass, but could also be “pieces” (e.g. of footwear), “pairs” (e.g. of trousers), “m²” (e.g. of glass plate), etc. This makes it impossible to provide an overall price/mass relationship for most industries. A further complication is that mass balances or similar quality control techniques have not been applied to the data in physical units, which means that there may be undiscovered errors in the price information provided. In most cases it is possible to estimate the missing mass flows from the price/mass relationships of similar imported or exported commodities, as we have done to construct the mass balance for the textile industry (see Chapter 6.4). However, this is a cumbersome task, which could not be performed for all industries within the limits of the current project. Thus, to find the monetary value that should be applied to the output from an industry for a given quantity of a specific commodity (for which the price is not already provided in the comment field), we recommend using the price/mass relationship given in the export commodity statistics (www.statistikbanken.dk; look under “External trade” for Table FORS2: “Supply of goods, by BEC (Broad economic categories), trade/production and quantity/value”). Note that the prices shown for industry outputs are basic prices, i.e. without taxes and wholesale and retail profits. 7.3 Further disaggregationCompared to the database that was used for the prioritisation presented in Chapter 1, the published database has been further disaggregated on a number of points:
These improvements were chosen among a long list of possible improvements, based on two criteria:
We also sought to find industries where the existing process-based LCA-data in the EDIP database could be used to disaggregate the IO-based data. However, the areas where the EDIP database has large detail does not in general match the areas identified as having priority from the above criteria. 7.4 User's guide to the LCA databaseThis sub-chapter gives a short introduction to the database as available in SimaPro. For further guidance on how to use the functionalities in the SimaPro software, please consult the SimaPro user manual, which is included in the free demo version. Figure 7.1 below shows the main menu of the project opened in SimaPro. In the LCA explorer, processes are chosen in the left menu. The Danish input-output data for industry outputs (i.e. cradle to gate) are placed under Material – Input Output – Danish production and the data for final consumption (i.e. including wholesale, retail and use stages) under Use – Input Output – Danish consumption. Figure 7.1. The main menu of the LCA database in SimaPro Under Danish production, the following sub-menus appear:
Under Danish consumption, the following sub-menus occur:
In the right menu in Figure 7.1, the process Advertising from Danish production is chosen. In the bottom, below the list, a comment field shows the commodities included in the chosen process, and the price information when available. The attributional version of the database (i.e. without the market adjustments of Chapter 2.9) is provided as a separate project in the database, with the same structure as explained above. SimaPro (also in the free demo version) offers several different ways to analyse a product system and its environmental impact. Using the Calculate Network option (F10) the links between the selected process and the other processes is provided in a graphical form, see Figure 7.2. Figure 7.2. Example of network (with cut-off 3.2%) showing important processes contributing to the 140 g CO2-equivalents from the lifecycle of 1 DKK of products from the industry “Beverage, DK” (accumulated emission values in the lower left of each box). It is possible to cut off minor contributing processes in the graphical presentation of the network. For example, in Figure 7.2, a cut-off of 3.2% was selected to limit the number of processes shown in the diagram. The cut-off relates only to what processes are shown in the diagram, not to cut-off's in the calculation (i.e. the underlying calculation still includes all contributing processes). Figure 7.2 shows that to obtain a net-production of 1 DKK beverage, the actual (gross) production is in fact 1.08 DKK. Similar results can be found for other processes. The explanation is that not only the required output (1 DKK worth of beverage) is produced, but also beverage used in other processes of the upstream network. These feedback loops are shown by the arrows leaving at the top of the beverage industry feeding back into itself and other processes in the network. The environmentally most important inputs to a process can be found by following the thickest streams of Figure 7.2. In this example, Grain farms are dominant, but also electricity and wholesale trade have large contributions to global warming. Other impact categories may of course be chosen, giving further information. Already from a diagram as Figure 7.2 it can be seen e.g. that energy processes are not very costly compared to their environmental burden; itself an interesting observation. In the example of Figure 7.2, the electricity contributes with 10 % of the Global Warming Potential, but represents only 1 % of the economical cost of the product. Having selecting several processes in the SimaPro LCA explorer, the Calculate Compare option (F9) allows comparative presentations as already presented in earlier Chapters of this report (e.g. Figure 1.3. comparing the 11 need groups, and all the figures in Chapter 6). The contribution from individual processes within the product systems can be shown as in Tables 6.3 and 6.4. The results from these analysis options can be presented both as tables and figures and are of course also available for a single product. When using the data, it should be remembered that thay have been derived by following the monetary flows from buyer to seller. This means that services provided for free will not be included, even when they have environmental relevance. For example, the data for “Freight transport by road, DK” and “Car purchase and driving…” have inputs of vehicles, fuels, maintenance, accessories, and road and bridge tolls, but do not include the general road infrastructure since this is provided “for free” by the society, which means that it is placed under “Public infrastructure” drawing mainly on the industry “Civil engineering” (Anlægsvirksomhed). 7.5 How to use the database for hybrid LCAThere are several ways in which the IO-database may be combined with more specific process data. The two main approaches are:
The name hybrid analysis refers to the combination of process-based LCA and Environmental IOA. 7.5.1 Tiered hybrid analysisThe typical (and simple) application of IO-data in a process LCA is to start from one or more specific processes that are better documented in terms of emissions and inputs than the corresponding industries in the IO data. To this “foreground” kernel, the IO data are simply added, linking each input to the process-based system with the corresponding best fitting final use group or industry output in the IO-database. Downstream processes like recycling or waste treatment may also be added. In this way, the IO data are used to complete the upstream and downstream parts of the product system not covered by specific process data. A very simple hybrid application starts from one single foreground process (for example a specific industry site), identifies in the IO-database the final use group or industry output that best covers this process, makes a copy of this IO-based process, and use the more precise data of the foreground process to replace the less precise data in the IO-based process (leaving the IO data as a proxy for those parts of the foreground data which are not adequate or complete). The resulting hybrid process may then be used in a direct comparison (benchmarking) with the original IO-based process, or it may be used in further modelling of a more complex foreground system. The advantage of this approach is that it is simple. The drawback is that there are no links back from the IO data to the foreground processes, i.e the upstream IO data do not take advantage of the added information available in the foreground processes. This also means that knowledge does not accumulate in the database, i.e. when applying the IO database for another foreground system, the added information from first foreground system is not automatically linked into the new product system. This is the main reason for the development of embedded hybrid analysis (see Chapter 7.5.2), where these drawbacks are overcome. However, embedded hybrid analysis is more demanding and therefore appeals more to the advanced user that wishes to make several LCAs while continuously improving the underlying database. 7.5.2 Embedded hybrid analysisThis more advanced hybrid approach utilises the common matrix nature of process-based and IO-based data, by embedding the process-based data in the IO-matrix. This is the approach used when subdividing industries in the IO-database as described in Chapter 2.6 and 7.3. The first step of this approach is identical to that of the tiered approach (Chapter 7.5.1): The starting point is an identification of the IO-database the final use group or industry output that best covers the process for which more specific data are available. A copy of this IO-based process is then made, and the more precise data of the foreground process is used to replace the less precise data in the IO-based process. Two additional steps are then needed to embed the new process in the IO-database:
Both these steps, but especially the latter, are rather cumbersome if performed within SimaPro, since every input and output needs to be accessed separately. For the advanced user, it is therefore preferable to perform these operations in the original matrix structure, e.g. in a spreadsheet software, utilising the advantage that operations in a spreadsheet can be performed on entire rows and columns. The entire database can be exported to Excel with the “Export to matrix” function of SimaPro. The two embedding steps may then be performed by adding a row and column representing the new hybrid process, performing the additions and subtractions described above, and re-import the adjusted matrix into SimaPro or any other matrix calculation tool. Import of matrices to SimaPro is performed via a CSV-file, which can e.g. be generated by a macro in Excel. The advantage of the embedded approach to hybrid LCA is that the adjustments made will automatically be available for all future applications of the database. It is therefore the approach preferred by database developers and advanced users that perform several LCAs using the same underlying database. 7.6 Prioritising future data collection for the LCA databaseThe underlying IO data from Statistics Denmark as well as many of the emissions data are published on an annual basis. Thus, it would be possible to update the database annually. The delay in availability of statistical data already imply that consistent data sets are at least 4 years old when published, which could be an argument for annual updates. However, due to the relatively large amount of work involved in performing all the necessary adjustments described in Chapter 2, a less frequent update could be considered. An update at least every 5 years should be considered imperative due to the developments in technology and consumption patterns. It should also be considered that the costs of regular updating of the entire database could instead be used to improve the detail of the database, both by subdividing industries based on more detailed statistics and other datasources (as described in Chapters 2.6 and 7.3) and by adding more emissions or environmental impact categories (as suggested for toxicity in Chapter 2.5.1 and for other impact categories in Chapter 2.10.5). An uncertainty assessment performed on the database may be used as a guiding tool to determine the most cost-effective way of maintaining the database. That maintenance action should be chosen which give the largest reduction the overall uncertainty of the results form using the database. As mentioned in Chapter 2.11, one of the most important causes of uncertainty in the database is the high aggregation level of industries. The industries may therefore be ranked according to the absolute uncertainty with which their environmental impacts are determined, thus providing a prioritised list of the industries where a further disaggregation could reduce the overall uncertainty the most. For the database used in the prioritisation (i.e. prior to the improvements described in this chapter) we obtained such a list, the upper part of which is shown in Table 7.1. The uncertainty data shown in Table 7.1 include the uncertainty from using modified US American data to represent all imports to Denmark. Thus, on an individual industry level, this geographical aspect of data quality is included in the suggested prioritisation in Table 7.1. However, at a more general level, it should be considered how the work on the Danish NAMEA could be embedded within a Global NAMEA, e.g. through the database network initiated by the UNEP Life Cycle Initiative (www.uneptie.org/pc/sustain/lcinitiative). Neither age of data nor the importance of missing environmental exchanges are included in the uncertainty assessment described above. For an overall data collection strategy, these two aspects of uncertainty need to be included, e.g. by estimating the variation of IO and emission data in NAMEAs from a number of years and estimating the bias caused by environmental exchanges not currently included in the database. Table 7.1. Absolute uncertainty (standard deviation) of the overall environmental impact (expressed in person-equivalents) from different product groups, calculated before the database improvements reported in this chapter.
Once these two additional estimates are available, it will be possible to judge whether uncertainty is reduced most by more frequent updating of the database, by disaggregating specific industries (including improving the representativeness of foreign industries), or by adding more environmental exchanges. In practice, other concerns than uncertainty reduction may guide the data collection. Typically, funding will be available for data-generating projects within specific industries, and such data should of course be integrated in the database as quickly as they become available, disregarding the position of that industry in the overall prioritisation suggested by the uncertainty assessment. LiteratureABS (2003). Australian National Accounts: Tourism Satellite Account. Australian Bureau of statistics. Publication no. 5249.0. Aho I, Haakana M, Marttila M, Kinnunen H, Lindholm M, Pirinen A. (1997). Raennusten energiatodistus. (Final report, SAVE project 4.1031/Z/95-118). Allermann K, Walstrøm E, Andersen B H, Andersen T T, Højevang J. (2004). Substitution af biocider i bundmaling til skibe med enzymer. (Miljøprojekt 910). Bach H, Christensen N, Kristensen P. (ed.)(2001). Natur og Miljø 2001. Påvirkninger og tilstand. Roskilde: Danmarks Miljøundersøgelser. (Faglig rapport fra DMU no. 385). Bak F, Jensen M G, Hansen K F. (2003). Forurening fra traktorer og ikke-vejgående maskiner i Danmark. København: Miljøstyrelsen. (Miljøprojekt 779). Banister D, Marshall S. (2000). Encouraging transport alternatives. London: The Stationary Office. Bringezu S, Schütz H. (2001). Material use indicators for the European Union, 1980-1997. Luxembourg: Office for Official Publications of the European Communities. (Working Paper 2/2001/B/2). CEC (2002a). Commission directive 2002/62/EC of 9 July 2002 adapting to technical progress for the ninth time Annex I to Council Directive 76/769/EEC on the approximation of the laws, regulations and administrative provisions of the Member States relating to restrictions on the marketing and use of certain dangerous substances and preparations (organostannic compounds). Brussels: Commission of the European Communities. Official Journal of the European Communities L 183/58. CEC (2002b). Communication from the Commission to the European Parliament and the Council - A European Union strategy to reduce atmospheric emissions from seagoing ships. Brussels: Commission of the European Communities. (COM/2002/0595). CEC (2002c). Proposal for a Directive of the European Parliament and of the Council amending Directive 1999/32/EC as regards the sulphur content of marine fuels Brussels: Commission of the European Communities. (COM/2002/0595 final Volume II - COD 2002/0259). Official Journal of the European Communities C 045 E. CEC (2002d). Communication from the commission to the council and the European parliament. Final report on the Green Paper “Towards a European strategy for the security of energy supply”. Brussels: Commission of the European Communities. (COM/2002/321final). CEC, OECD, UN, WTO. (2001). Tourism Satellite Accounts: Recommended Methodological Framework. Commission of the European Communities, Organisation for Economic Cooperation and Development, United Nations & World Tourism Organization. CEPA (1993). Benzo[a]Pyrene as a Toxic Contaminant. Part B Health Assessment. California Environmental Protection Agency. Christensen L. (2001). Bystruktur og transportadfærd. Hvad siger transportvaneundersøgelsen? Roskilde: Danmarks Miljøundersøgelser. (DMU-rapport nr 382). Christensen T, Huusom H. (2003). Evaluering af informations- og rådgivningsbaserede virkemidler i Pesticidhandlingsplan II. København: Miljøstyrelsen. (Arbejdsrappport 22). Christensen T E, Jørgesen H, Wejdling H. (2002). Økologiske rygsække -ressourceeffektivitet, materialestrømme og globalisering. København: Miljøstyrelsen. (Arbejdsrappport 30) CMEH (2000). Assessment Report - 1,3-Butadiene. Canadian Ministers of Environment and Health. Crocker D, Linden T. (eds.) (1998). Ethics of Consumption. New York: Rowman and Littlefield. CVTF (2001). Review of work on whole-life environmental impacts of vehicles. London: Cleaner Vehicles Task Force. CVTF (2002). Progress Report on the Government Response to the final report of the Cleaner Vehicles Task Force, "The Way Forward". London: Cleaner Vehicles Task Force. Dalgaard R, Halberg N (2004). Draft work files 118, 158 and April2004 in process for the final version of the LCA food data base (see Nielsen et al. 2003b). Dall O, Toft J. (1996). Miljøbelastningen ved familiens aktiviteter. København: Forbrugerstyrelsen. (Rapport 1996.1). Dall O, Toft J, Andersen T T. (2002). Danske husholdningers miljøbelastning. København: Miljøstyrelsen. (Arbejdsrappport 13). Dall O, Christensen C L, Hansen E, Christensen E H. (2003). Ressourcebesparelser ved affaldsbehandlingen i Danmark. København: Miljøstyrelsen. (Miljøprojekt 804). Danmarks Statistik. (2002). Nøgletal for transport 2002. Copenhagen: Statistics Denmark. Available at http://www.dst.dk/3637. Danmarks Statistik (2003a). Grundmateriale til miljøøkonomisk regnskab for Danmark (NAMEA). Emissionsmatricer og input-output-matricer for 1999. Copenhagen: Statistics Denmark. Danmarks Statistik (2003b). 1999 løbende tilgang-anvendelses matrice på varenummer-niveau med tilføjede mængdeoplysninger baseret på Varestatistik og Udenrigshandelstatistik. Copenhagen: Statistics Denmark. Danmarks Statistik (2003c). IO konsistent investeringsmatrice for 1999. Copenhagen: Statistics Denmark. DEPA (2000). Bekæmpelsesmiddelstatistik. København: Danish Environmental Protection Agency. (Orientering fra miljøstyrelsen Nr. 11). DEPA (2002). Waste Statistics 2000. Copenhagen: Danish Environmental Protection Agency. (Environmental Review No. 1) Delisle J, Venne S. (2001). Tourism in Canada and its various economic facets. Chapter 6 in Tourism statistical Digest. Statistics Canada Catalogue no. 87-403-XPE. Dom A, de Ridder W. (2002). Paving the way for EU enlargement. Indicators of transport and environment integration. TERM 2002. Copenhagen: European Environmental Agency. (Environmental issue report 32). Dreyer J C. (2004). Personal communication 2004-09-21. Jørgen Christian Dreyer, Direktør for Gies Kerzen, Glinde. Drivsholm T., Maag J., Hansen E and Havelund S. (2000). Massestrømsanalyse for cadmium. Environmental Project no. 557. København: Danish Environmental Protection Agency. Drivsholm T, Holm-Petersen M, Skårup S, Frees N, Olsen S. (2002). Produkters forbrug af transport. Systemanalyse. København: Danish Environmental Protection Agency. (Arbejdsrapport fra Miljøstyrelsen no. 44). Eastern Research Group (1996). Best Management Practices for Pollution Prevention in the Textile Industry. Cincinnati: US EPA (Doc. no. EPA/625/R-96/004) Available at http://www.p2pays.org/ref/02/01099/0109900.pdf EC (2000). Green Paper. Towards a European strategy for the security of energy supply. Brussels: European Commission. EC (2003). Reference Document on Best Available Techniques for Mineral Oil and Gas Refineries. Seville: European Commission Joint Research Centre, Institute for Prospective Technological Studies. EEA. (2003). Atmospheric emission inventory guidebook. EMEP/CORINAIR 3rd edition. Copenhagen: European Environmental Agency. Eltra (2004). Strategi for dansk vindenergiforskning. Fredericia: Eltra. (Eltra dok nr. 185399 V3). Environment Canada. (2001). Formaldehyde. Priority substances list assessment report. EPA. (1996). Location and Estimating Air Emissions from Sources of 1,3-Butadiene. US Environmental Protection Agency. (Document 454/R-96-008). EPA. (2000). Factor Information Retrieval System ver. 6.23. US Environmental Protection Agency. EurEco, Witteveen and Bos (1998). Clean technologies for waste minimisation. Luxembourg: Office of Official Publications of the European Communities. European Communities (2000). Regulation (EC) no. 1980/2000 of the European Parliament and of the Council of 17 July 2000 on a revised Community eco-label award scheme. Official Journal of the European Communities L237 21.9.2000. Eurostat (2004). Mean consumption expenditure by detailed COICOP level (in PPS). Table T121 from the Household Budget Survey. Luxembourg: Eurostat. Evensen T N. (1999). Turismens betydning for norsk økonomi. Satellittregnskap for turisme 1988-1995. Statistics Norway. Rapport 99/21. FAO. (2001). The global forest resources assessment 2000. Summary report. Information note for item 8(b) of the provisional agenda for the 15th session of the Committee on Foresty 2000.03.12-16. Rome: FAO. (ftp://ftp.fao.org/unfao/bodies/cofo/cofo15/X9835e.doc). Fenhann J. (1999). Projections of emissions of greenhouse gases, ozone precursors and sulphur dioxide from Danish sources until 2012. Copenhagen: Danish Energy Agency. Finnveden G, Johansson J, Moberg Å, PalmV, Wadeskog A, Suh S, Huppes G. (2001). Miljöpåverkan från olika varugrupper. Stockholm: Forskningsgruppen för miljöstrategiska studier, Totalförsvarets Forskningsinstitut. (fms report 167). Fox J W, Cramer D R. (1997). Hypercars: A Market-Oriented Approach to Meeting Lifecycle Environmental Goals. Old Snowmass: Rocky Mountain Institute (Society of Automotive Engineers Paper 971096; RMI report T97-5). French T A. (2001). Marine Engine Manufacturers' Perspectives on Environmental Regulations. Presentation to the 2001 Conference on Marine Vessels and Air Quality: Presentations. (http://www.epa.gov/region09/air/marinevessel/) Frischknecht R (ed.). (1996). Ökoinventare für Energiesysteme. Zürich: Bundesamt für Energiewirtschaft. Goedkoop M, Effting S, Alvarado C and Madsen J. (2003). Bijdrage aan Milieudruk Consumptie in Beeld. VROM 200107075. Netherlands. GK (2002). Methode zur Rußmessung beim Abbrand von Kerzen. Entwurf vom 24.04.2002 Mitgliederversammlung. Stuttgart: Gütegemeinschaft Kerzen. (Available from http://www.kerzenguete.com/russ.htm). Grell H, Kjerulf B. (1999). Pendlerplaner i Hillerød. København: Danish Environmental Protection Agency. (Miljøprojekt nr. 472). Hans Bjerregård Rådgivning ApS (2001). 12 Byøkologiske forsøgsbyggerier - Erfaringer og anbefalinger. København: Erhvervs- og boligstyrelsen. (www.ebst.dk/publikationer/rapporter/forsogbyg/12byokolo/html/samf.htm) Hansen E. (1995a). Miljøprioritering af industriprodukter. København: Danish Environmental Protection Agency. (Environmental project no. 281). http://www.mst.dk/udgiv/Publikationer/1995/87-7810-301-0/pdf/87-7810-301-0.PDF Hansen J H (1995b). Nationale og industrielle emissioner af 38 stoffer. Overbliksrapport. København: Danish Environmental Protection Agency. (Arbejdsrapport no. 64). Hartoft-Nielsen P. (2001a). Boliglokalisering og transportadfærd. Forskningscenteret for skov- og landskab. (By- og Landsplanserien 15) Hartoft-Nielsen P. (2001b). Arbejdspladslokalisering og transportadfærd. Forskningscenteret for skov- og landskab. (By- og Landsplanserien 16) Hartoft-Nielsen P. (2002). Byudvikling i større byer - mulige konsekvenser for transport. Forskningscenteret for skov- og landskab. (By- og Landsplanserien 17) Hauschild M, Wenzel H. (1998). Environmental Assessment of Products. Vol.2. Scientific background. London: Chapman and Hall. Hauschild M, Olsen S. (2004). Personal communication with Michael Hauschild and Stig Olsen, Technical University of Denmark. Heijungs R, Suh S. (2002). The computational structure of life cycle assessment. Dordrecht: Kluwer Academic Publishers. (Eco-efficiency in Industry and Science vol. 11). Hinterberger F, Giljum S, Hammer M. (2003). Material Flow Accounting and Analysis (MFA). Vienna: Sustainable Europe Research Institute. (SERI Background Paper 2). Højenvang, J. (2002). Udviklingen af alternative antifoulingmetoder til lystbåde. Statusrapport. (Miljøprojekt 692). Illerup J B, Birr-Pedersen K, Mikkelsen M H, Winther M, Gyldenkærne S, Bruun H G, Fenhann J. (2002). Projection Models 2010. Danish emissions of SO2, NOx, NMVOC and NH3. Roskilde: National Environmental Research Institute. (NERI Technical Report No. 414). Illerup J B, Lyck E, Nielsen M, Winther M, Mikkelsen M H. (2003a). Annual Danish Emission Inventory Report to UNECE. Inventories from the base year of the protocols to year 2001. Roskilde: National Environmental Research Institute. (Research Notes from NERI no. 184). Illerup J B, Lyck E, Nielsen M, Winther M, Mikkelsen M H. (2003b) Denmark's National Inventory Report. Submitted under the United Nations Framework Convention on Climate Change, 1990-2001. Roskilde: National Environmental Research Institute. IMO (2001). International Convention on the Control of Harmful Anti-fouling Systems on Ships. London: International Maritime Organization. (Available from http://www.antifoulingpaint.com). Jensen J D, Andersen M. (2003). Marginale producenter af udvalgte landbrugsprodukter. Copenhagen: Danish Research Institute of Food Economics. (Working paper 08/03). Kass D I, Okubo S. (2000). U.S. Travel and Tourism Satellite Accounts for 1996 and 1997. Survey of Current Business, p. 8-24. July 2000. Bureau of Economic Analysis. ( http://www.bea.doc.gov/bea/ARTICLES/NATIONAL/Inputout/ 2000/0700tta.pdf) Kilström O. (2004). Personal communication. 2004-09-22. Olle Kilstöm, Fabrikschef på Liljeholmens Stearinfabrik. (Liljeholmens is the largest candle producer in Europe). Kjølholt J, Stuer-Lauridsen F, Mogensen A S, Havelund S. (2003). The elements in the second rank. A problem now or in the future? København: Danish Environmental Protection Agency. (Environmental report no. 770). Labouze E, Monier V, Puyou J-B. (2003). Study on external environmental effects related to the life cycle of products and services. BIO Intelligence Service and O2 France for the European Commission, Directorate General Environment (Sustainable Development and Policy support). Lassen C, Drivsholm T, Hansen E, Rasmussen B and Christiansen K. (1996). Massestrømsanalyse for kobber. Forbrug, bortskaffelse og udslip til omgivelserne i Danmark. Copenhagen: Danish Environmental Protection Agency. (Environmental Project no. 323). Lassen C, Vaaben S, Hansen E. (1997). Massestrømsanalyse for tin med særligt fokus på organotinforbindelser. Copenhagen: Danish Environmental Protection Agency. (Arbejdsrapport fra Miljøstyrelsen no. 7). Lassen C, Christensen C L, Skårup S. (2003). Massestrømsanalyse for bly 2000. Copenhagen: Danish Environmental Protection Agency. (Environmental Project no. 789). Laursen S E, Bagh J, Hansen J, Jensen O K, Werther I. (1997). Environmental assessment of textiles. Life cycle screening of the production of textiles containing cotton, wool, viscose, polyester or acrylic fibres. Copenhagen: Danish Environmental Protection Agency. (Environmental Project no. 369). Laursen K, Jensen J S, Wallach T, Plesner V, Andersen J H, Dam M, Bielski J, Pedersen S. (2000). Punktkilder 1999. Copenhagen: Danish Environmental Protection Agency. (Orientering fra Miljøstyrelsen no. 16). Lenzen M. (2001). Errors in conventional and Input-Output-based life-cycle inventories. Journal of Industrial Ecology 4(4):127-148. Lihn Jørgensen, N. (1982). Input-output modeller - en introduktion. Economic Institute, University of Copenhagen. Memo no. 108. Madsen I-L (2003). Data from Arealanvendelseskortet AIS. National Environmental Research Institute. Madsen T, Samsøe-Petersen L, Gustavson K, Rasmussen D. (2003). Økotoksikologisk vurdering af begroningshindrende biocider og biocidfrie bundmalinger. (Miljøprojekt 507). Mantzos L, Capros P, Kouvaritakis N, Zeka-Paschou M, Chessire J, Guilmot J F. (2003). European energy and transport trends to 2030. Luxembourg: Office for Official Publications of the European Communities. Maslow A. (1954). Motivation and Personality. New York: Harper and Row. Matthäi M, Petereit N. The quality candle. Stuttgart: Gütegemeinschaft Kerzen. (Availæable at http://www.kerzenguete.com/quality.pdf). Max-Neef M. (1992). Development and human needs. In Ekins & Max-Neef (eds.): Real-life economics: Understanding wealth creation. New York: Routledge. MOE (Ministry of the Environment). (1997). Scientific Criteria Document for Multimedia Standards Development. Polycyclic Aromatic Hydrocarbons (PAH). Part1: Hazard Identification and Dose-Response Assessment. Ministry of the Environment, Toronto, Ontario. Moll S, Bringezu S, Schütz H. (2003). Zero Study: Resource Use in European Countries. An estimate of materials and waste streams in the Community, including imports and exports using the instrument of material flow analysis. Copenhagen: European Topic Centre on Waste and Material Flows. (Available from http://europa.eu.int/comm/environment/natres/titles1_2.htm). MVTU (2003). Grønt teknologisk fremsyn om perspektivrige grønne teknologier med erhvervspotentiale. København: Ministeriet for Videnskab, Teknologi og Udvikling. NEB (2001). Nordic ecolabelling steps. Nordic Ecolabelling Board. (Available at www.sfs.fi/ymparist/engsteps.pdf). Nemry F, Thollier K, Jansen B, Theunis J. (2002). Identifying key products for the federal product and environment policy. Final report. Institut Wallon de développement économique et social et d'aménagement du territoire ASBL and Vlaamse Instelling voor Technologisch Onderzoek (VITO) for the Belgian Federal Services of Environment, Department on Product Policy. NERI (2000). Emission factors, stationary combustion for year 1999. Excel file received from the National Environmental Research Institute. (Similar data are published annually on the website www.neri.dk). NERI (2003). Particulate matter. Roskilde: National Environmental Research Institute. http://www.dmu.dk/1_Viden/2_Miljoe-tilstand/3_luft/4_adaei/pollutant_en.asp?pol_id=PM Nielsen P. (2004). Consumption expenditure EU25 1999 COICOP (05). Internal work file from the EIPRO project. Lyngby: Technical University of Denmark. Nielsen M, Illerup J B. (2003). Danish emission inventories for stationary combustion plants. Inventories until year 2001. Roskilde: National Environmental Research Institute. (Research Notes from NERI No. 192). Nielsen A M, Christiansen K, Weidema B P. (2003a). Prioritisation of product groups and product areas in the integrated product policy. Proceedings of a seminar, Copenhagen, 2003-03-10. Published at http://www.lca-net.com/files/seminarreport.pdf Nielsen P, Nielsen A M, Weidema B P, Dalgaard R, Halberg N (2003b). LCA food data base. Draft version. www.lcafood.dk/database. Nijdam D S, Wilting H. (2003). Milieudruk consumptie in beeld. Bilthoven: RIVM. (RIVM report 7714040004). Norris G A, Croce F D, Jolliet O. (2003). Energy burdens of conventional wholesale and retail portions of product life cycles. Journal of Industrial Ecology 6(2):59-69. Nussbaum M. 1998. The Good as Discipline, the Good as Freedom. In Ethics of Consumption, Crocker, D. and T. Linden, eds. New York: Rowman and Littlefield. Øhlenschlæger R. (2003). Miljørigtigt byggeri og miljørigtige byer. København: Realdania. Available at www.dcue.dk/Files/Filer/Forside_Nyheder_Miljorigtige_byer_Realdania.pdf Oxbøl A, Wismann T. (2003). Emissioner fra skibe i havn. København: Danish Environmental Protection Agency. (Arbejdsrapport fra Miljøstyrelsen nr. 11). Olsen S I. (2003). EDIP tox factors June 2003. Published at http://www.lca-center.dk/docs/showdoc.asp?id=030624085132&type=doc&fname=EDIP tox factors June 2003 LCA Center Denmark.xls PA Energy (2004). Solceller. Oplæg til en national strategi for forskning, udvikling og demonstration. Available at http://www.ens.dk/sw3082.asp Palmgreen F., Berkowicz R., Skov H. and Hansen A.B. (2000). Benzene from traffic. Fuel content and ambient air concentrations. NERI Technical Report no. 309. Roskilde: Ministry of Energy and Environment Palonen H, Thomsen A B, Tenkanen M, Schmidt A S, Viikari L. (2004). Evaluation of wet oxidation pre-treatment for enzymatic hydrolysis of softwood. Applied Biochemistry and Biotechnology 117(1):1-18. Pasquier J-L. (2001). Nameas for air emissions. Results of pilot studies. Luxembourg: Eurostat. Office for Official Publications of the European Communities. (ISBN 92-894-1428-6). Paulley N, Pedler A. (2000). Integration of Transport and Land Use Planning. Final report of the TRANSLAND project (http://www.inro.tno.nl/transland/) Pedersen O G. (2002). DMI and TMR Indicators for Denmark 1981, 1990 and 1997. Copenhagen: Statistics Denmark. Pedersen O G. (2003). National emissions of heavy metals and PAH to air distributed over 130 industries and 5 private consumption groups. Internal work file from the project “Miljøvurdering af danskernes forbrugsmønster” financed by Statens Samfundsvidenskabelige Forskningsråd (SSF) and managed by the Institute of Local Government Studies, Copenhagen. Petersen C, Joergensen H (2004). Storskraldsordninger – øget genbrug og genanvendelse. København: Danish Environmental Protection Agency. (Miljøprojekt 894). Phylipsen D, Kerssemeeckers M, Blok K, Patel M, de Beer J. (2002). Assessing the environmental potential of clean material technologies. Institute for Prospective Technological Studies, Joint Research Centre (DG JRC), European Commission. (Report EUR 20515 EN). Plovsing J, Dalgaard E. (1997). New National Accounts 1988-1996. Statistiske Undersøgelser no. 47. Statistics Denmark. Poulsen T S. (2001). Ozonlagsnedbrydende stoffer og visse drivhusgasser – 1999. København: Danish Environmental Protection Agency. (Environmental Project no. 580). Poulsen T S. (2004). Ozone depleting substances and the greenhouse gases HFCs, PFCs and SF6. Danish consumption and emissions 2002. København: Danish Environmental Protection Agency. (Environmental Project no. 890). Pulles T, van Aardenne J. (2001). Good practice guidance for CLRTAP emission inventories. Draft [??] Chapter for UNECE Corinair Guidebook on Emission Inventories, 7. November 2001. http://reports.eea.eu.int/EMEPCORINAIR3/en/AEIG%20Section%20B.pdf RAL (2003). Basic criteria for the award of the environmental label Solar Collectors RAL-UZ 73. Sankt Augustin: Reichs-Ausschuss für Lieferbedingungen. Rambøll Nyvig A/S (2002). Bæredygtig bolig-arbejdsstedstrafik i Horsens Kommune. København: Danish Environmental Protection Agency. (Environmental Project no. 669). Remmen A. (2003). Cleaner Products – new tools, players and relationships. København: Danish Environmental Protection Agency. (Environmental Review No. 7). Schmidt A, Poulsen P B, Andreasen J, Fløe T, Poulsen K E. (2004). LCA and the working environment. Denmark: Danish Environmental Protection Agency. (Environmental project 907). SEMC. (1999). Certified environmental product declaration, hydro power electricity from the Lule river. Stockholm: Swedish Environmental Management Council. http://www.environdec.com/reg/e_epd1.pdf Sen A. (1998). The Living Standard. In Crocker & Linden (see this). Segal J. (1998). “Consumer expenditures and the growth of need-required income” and “Living at a high economic standard: a functionings analysis”. In Crocker & Linden (see this). Skårup S, Christensen C L, Jensen S H, Maag J. (2003). Massestrømsanalyse for kviksølv 2001. Danish Environmental Protection Agency. Miljøprojekt nr. 808. Skjølsvik K O, Corbett J J, Andersen A B, Skjelvik J M. (2000). Study of greenhouse gas emissions from ships. Trondheim: MARINEK. Available at http://unfccc.int/issues/imoghgmain.pdf and appendices at http://unfccc.int/issues/imoghgapp.pdf Skov- og Naturstyrelsen, Ministeriet for Fødevarer, Landbrug og Fiskeri (2003). Forberedelse af Vandmiljøplan III. Del V. Syntese af arbejdsgruppernes rapporter. Endvidere rapporter fra de tekniske undergrupper. Published on http://www.vmp3.dk. Skov- og Naturstyrelsen, Ministeriet for Fødevarer, Landbrug og Fiskeri. Smith B. (1994). The Future of Pollution Prevention: An Alternative to Costly Waste Treatment. Presentation to the American Textile Manufacturer's Institute Pollution Prevention Conference, Charlotte, NC, October 1994. Available at http://www.p2pays.org/ref/01/00386.pdf Speedy A, Pugliese P-L. (1991). Legume trees and other fodder trees as protein sources for livestock. Rome: FAO. (FAO Animal Production and Health Paper 102). Stranddorf H K, Hoffmann L, Schmidt A. (2001). Normalisation and weighting - update of selected impact categories. Draft manuscript for a technical report from the project: ”LCA-metodeforbedring / metodeudvikling og konsensusskabelse, Delprojekt 4” Copenhagen: Danish Environmental Protection Agency. Suh S. (2003a). Internal work file for MIET 3.0 (see Suh 2003b). Suh S. (2003b). MIET 3.0 user's guide. An inventory estimation tool for missing flows using input-output techniques. Leiden: CML, Leiden University. Thorhauge G. (2004). Personal communication; CEN task force member Gitte Thorhauge; 2004-11-02. Treloar G J. (1998). A Comprehensive Embodied Energy Analysis. Australia: Faculty of Science and Technology, Deakin University. UITP (2003). Ticket to the Future: Three Stops to Sustainable Mobility. Brussels: UITP. UNECE (2004). Road accident statistics – 1997 ECE road accident data. Geneva: United Nations Economic Commission for Europe (http://www.unece.org/trans/roadsafe/rs3ras.html). UNEP (2002). Global mercury assessment. Geneva: UNEP Chemicals. USDHHSPHS (2002). 1,3-Butadiene - The Tenth Report on Carcinogens. U.S. Department of Health and Human Services Public Health Service National Toxicology Program. USDLSHT (2002). 1,3-Butadiene. U.S. Department of Labor Safety and Health Topics. (http://www.osha.gov/SLTC/butadiene/). USGS (2001). Mineral commodity summaries 2001. Reston: U.S. Geological Survey. Walter-Jørgensen A, Jensen H G, Frandsen S E. (2001). Reform af EU's sukkerpolitik - Konsekvenser for EU og udviklingslandene. Statens Jordbrugs- og Fiskeriøkonomiske Institut. (Rapport nr. 126). Weidema B P. (1999). System expansions to handle co-products of renewable materials. Presentation Summaries of the 7th LCA Case Studies Symposium SETAC-Europe, 1999. Pp. 45-48. (available from http://www.lcafood.dk/products/crops/casestudy99.pdf) Weidema B P. (2001). Two cases of misleading environmental declarations due to system boundary choices. Presentation for the 9th SETAC Europe LCA Case Studies Symposium, Noordwijkerhout, 2001.11.14-15. (Available from http://www.lca-net.com/publ/casestudies01.asp). Weidema B P. (2003). Market information in life cycle assessments. Technical report from the project: ”LCA-metodeforbedring/metodeudvikling og konsensusskabelse, Delprojekt 2: Systemafgrænsning” Copenhagen: Danish Environmental Protection Agency. (Environmental Project no. 863). Weidema B P, Lindeijer E. (2001). Physical impacts of land use in product life cycle assessment. Final report of the EURENVIRON-LCAGAPS sub-project on land use. Lyngby: Department of Manufacturing Engineering and Management, Technical University of Denmark. (IPL-033-01). Revised version dated 2001.12.31. http://www.lca.dk/publ/gaps9.pdf Vejdirektoratet. (2004). Brændstofpriser i Europa. http://www.trafikken.dk/wimpdoc.asp?page=document&objno=14758 Wenzel H, Hauscild M, Alting L. (1997). Environmental Assessment of Products. Vol.1. Methodology, tools and case studies in product development. London: Chapman and Hall. Whall C, Cooper D, Archer K, Twigger L, Thurston N, Ockwell D, McIntyre A, Ritchie A. (2002). Quantification of emissions from ships associated with ship movements between ports in the European Community. Brussels: Commission of the European Communities. (http://europa.eu.int/comm/environment/air/pdf/chapter1_ship_emissions.pdf) White S, Vrolijk C. (2004). Review of existing electricity quality label systems in the European Union. Chineham: IT Power. (Available from http://www.green-x.at/). Wrisberg S, Eilersen A M, Nielsen S B, Clemmesen K, Henze M, Magid J. (2001). Vurdering af muligheder og begrænsninger for recirkulering af næringsstoffer fra by og land. Copenhagen: Danish Environmental Protection Agency. (Økologisk Byfornyelse og Spildevandsrensning 14). VK (2001). Environmental declaration. Vestegnens Kraftvarmeselskab I/S. VTPI (2004). Online TDM Encyclopedia. Victoria: Victoria Transport Policy Institute. (http://www.vtpi.org/). Annex A Produktgruppernes navne på danskI nedenstående tabel gives de danske oversættelser af navnene på de produktgrupper der nævnes i tabellerne i rapportens kapitel 1. Produktgruppenavne på engelsk og dansk. Bemærk at der kan være produktgrupper der forekommer overlappende, idet både produktion og forbrug af de samme vare er medtaget, og der er benyttet forskellige navne herfor. Det fremgår af tabellerne i hovedrapportens kapitel 1 hvorvidt der er tale om produktion eller forbrug.
Footnotes [1] Net production of Danish industries is the products supplied by Danish industry for domestic final consumption or for export, as opposed to the gross production that includes also the products supplied for internal use in Danish industry. [2] Products for re-export are not included in any of the three perspectives. [3] 1,3-Butadiene is a product of incomplete combustion and mainly found in exhaust emissions from gasoline- and diesel-powered vehicles, non-transportation fuel combustion, biomass combustion (CMEH 2000, EPA 1996) and cigarette smoke. It is also an industrial chemical produced in petroleum processing and mainly used in the production of synthetic rubber, but is also found in smaller amounts in plastics and fuel. Exposure may therefore occur from polluted air and water near chemical, plastic or rubber facilities and from ingestion of foods that are contaminated from plastic or rubber containers, although workplace exposure is more important (USDLSHT 2002). Industries with a high potential for exposure include rubber and latex production, petroleum refining, secondary lead smelting (due to the plastic separators and rubber casings), agricultural fungicides, and production of raw material for nylon (USDHHSPHS 2002). [4] N-butyl alcohol (also known as 1-butanol) is used as a solvent, dehydrating substance, adjuvant for agricultural chemicals, in hydraulic fluids and as an intermediate in chemical and pharmaceutical manufacturing. It is used in many different industries, including manufacture of detergents, dyes, lacquers, fats, resins, waxes, gums, rubber, fabrics, ore floatation agents, and safety glass. [5] Formaldehyde is emitted to air from fuel combustion, mainly in vehicles, and biomass combustion (including cigarettes), from on-site industrial uses, and as an off-gas from products in which it is used, notably particleboards, fabric and paper coating, insulation foams and as a preservative in some paints, coatings, and cosmetics (Environment Canada 2001). [6] In fact, NOx dominated the original top10 due to a high characterisation factor for human toxicity soil. This is regarded as an artefact due to a very simplified fate modelling (Hauschild & Olsen 2004) and this characterisation factor has therefore been omitted both from the top10 and from the version of the EDIP method used in this project. [7] The very simplified way pesticides are treated in the Danish normalisation data implies that pesticides are not assigned any characterisation factor for water ecotoxicity (see Stranddorf et al. 2001). [8] Compared to the need group “food” in Chapter 1.2.4, we have not included car driving for shopping and catering in the definition of household meals. Also, it should be noted that the additional building space for kitchens is also not included, as this is assumed to depend primarily on other factors than the number of meals consumed at home. [9] Note that the same commodity may be produced by several industries. For example, the commodity “Plastic sheets n.e.c.” (“Plader, ark, film mv a plast ian”) is mainly coming out of the industry “Rubber products, plastic packing etc.” but a smaller amount is also coming from “Basic non-ferrous metals”, which may at first sight look like an error. However, such occurrences can often be explained as the re-sale of surplus purchase of raw materials, in the example given, it could be surplus plastic originally purchased to laminate aluminium articles.
|
|||||||||||||||||||||||||||||||||||||||||||||||||||||||||||||||||||||||||||||||||||||||||||||||||||||||||||||||||||||||||||||||||||||||||||||||||||||||||||||||||||||||||||||||||||||||||||||||||||||||||||||||||||||||||||||||||||||||||||||||||||||||||||||||||||||||||||||||||||||||||||||||||||||||||||||||||||||||||||||||||||||||||||||||||||||||||||||||||||||||||||||||||||||||||||||||||||||||||||||||||||||||||||||||||||||||||||||||||||||||||||||||||||||||||||||||||||||||||||||||||||||||||||||||||||||||||||||||||||||||||||||||||||||||||||||||||||||||||||||||||||||||||||||||||||||||||||||||||||||||||||||||||||||||||||||||||||||||||||||||||||||||||||||||||||||||||||||||||||||||||||||||||||||||||||||||||||||||||||||||||||||||||||||||||||||||||||||||||||||||||||||||||||||||||||||||||||||||||||||||||||||||||||||||||||||||||||||||||||||||||||||||||||||||||||||||||||||||||||||||||||||||||||||||||||||||||||||||||||||||||||||||||||||||||||||||||||||||||||||||||||||||||||||||||||||||||||||||||||||||