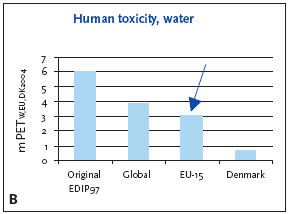
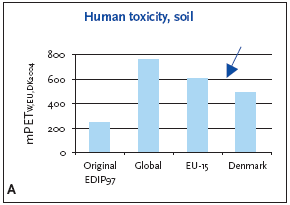
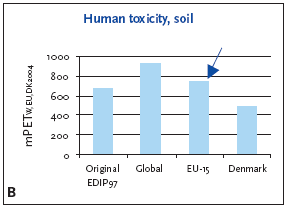
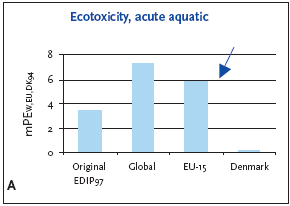
|
Environmental News no. 78, 2005 Impact categories, normalisation and weighting in LCAContents
2 Selection of impact categories 3 Application of normalisation references and weighting factors
5 Stratospheric ozone depletion
6 Photochemical ozone formation
11 Example: Normalisation and weighting
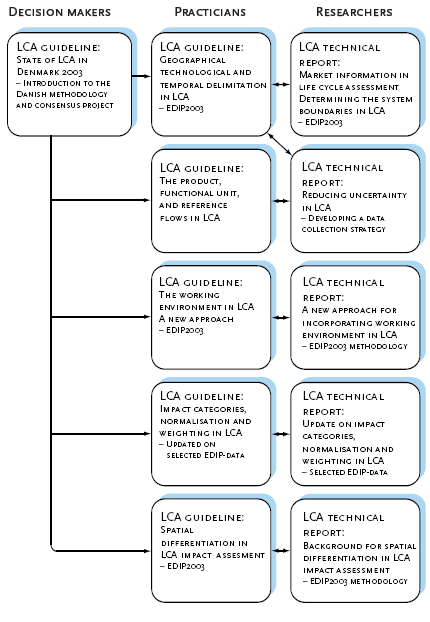
Introduction to the seriesLife cycle thinking and life cycle assessment are key elements in an integrated product policy. There is a need for thorough and scientific well- founded methods for life cycle assessment. Parallel to this, there is a need for simple, easy-understandable methods, which reflect life cycle thinking. Which method to use must depend on the goal and scope in each case inclusive target group, publication strategy etc. It is common for all life cycle assessments, that they have to give a solid and reliable result. A result, that is a good foundation for the decisions subsequently to be made. During the last 10 years a number of projects concerning life cycle assessment and life cycle thinking has received financial support. The main results of projects on life cycle assessments will from 2000 and in the next couple of years be published as a mini-series under the Danish EPA's series Environmental News (Miljønyt). As the projects are being finalised they will supplement the results of the EDIP-project from 1996. The tools, experience, advice, help and guidance altogether form a good platform for most applications of life cycle assessments. Life cycle assessment is a field so comprehensive, that it is not likely to be possible to write one book, that will cover all situations and applications of life cycle assessments. The Danish EPA hopes, that the LCA-publications together will present the knowledge available to companies, institutions, authorities and others, who wish to use the life cycle approach. The Danish Environmental Protection Agency, October 2000 PrefaceThis guideline has been prepared within the Danish LCA methodology and consensus-creation project carried out during the period from autumn 1997 to 2003. The guideline forms part of a series of guidelines dealing with key issues in LCA. These guidelines are planned to be published by the Danish Environmental Protection Agency during 2004. A primary objective of the guidelines has been to provide advice and recommendations on key issues in LCA at a more detailed level than offered by general literature like the ISO standards, the EDIP reports, the Nordic LCA project and SETAC publications. The guidelines must be regarded as an elaboration of and supplement to this general literature and not a substitution for this literature. The guidelines, however, build on the line of LCA methodology known as the EDIP methodology. It is important to note that the guidelines were developed by a consensus process involving in reality all major research institutions and consulting firms active in the field of LCA in Denmark. The advice given in the guidelines, thus, be said to represent what is generally accepted as best practice today in the field of LCA in Denmark. The guidelines are supported by a number of technical reports, which present the scientific discussions and documentation for recommendations offered by the guidelines. These reports are also planned to be published during 2004. The guidelines and the technical reports are presented in the overview figure below. The development of the guidelines and the technical reports was initiated and supervised by the Danish EPA Ad Hoc Committee on LCA Methodology Issues in the period 1997-2001. The research institutions and consulting firms active in the development and consensus process are: COWI, Consulting Engineers and Planners (Project Management) Guidelines and technical reports prepared within the Danish LCA- methodology and consensusproject
Authors' prefaceThis guideline focusing on normalisation and weighing is a result of an LCA methodology and consensus-making project. The project has involved a large part of the LCA practitioners and interested parties in Denmark. The guideline gives a presentation of normalisation references with the reference year 1994 and weighting factors with 2004 as the target year. Along with the guideline a technical report (Stranddorf et al., 2003) has been developed. During the project two workshops were held. At the first workshop the data intended to form the basis of the updated and extended normalisation reference and the weighting factors were presented and at the second, the collected data were presented and discussed. This gave valuable input to the project group regarding data to the normalisation references and the weighting factors. Further, at the second of the workshops background and recommendations for choice of impact category and normalisation reference were presented and discussed. This guideline is based on the technical report mentioned above. However, the approach in the guideline is more practical than theoretical. The guideline provides a short presentation of the impact categories described in detail in the technical report. The guideline includes a common example on how to apply normalisation references and weighting factor for the included impact categories. In addition to the presented normalisation reference and weighting factors, the guideline presents recommendations regarding choice of impact categories and choice of normalisation references. The following persons have been responsible for the chapters regarding the different impact categories in the technical report and should be specially acknowledged for their contributions that forms the basis for the chapters regarding impact categories in this guideline: Chapter 4: Global warming: M.Sc (Chem. Eng) Leif Hoffmann The expertise was provided by the following Danish research and consultancy institutions which are acknowledged for their contribution to this work: FORCE Technology (editing, global warming, ozone depletion, Sammenfatning og konklusionerDe nærværende Guidelines præsenterer en udvidelse af den oprindelige UMIP-metode i form af normaliseringsreferencer og vægtningsfaktorer EU- 15 og Globalt. På samme tid er de danske normaliseringsreferencer og vægtningsfaktorer blevet opdateret. Resultaterne præsenteres i nedenstående tabel. Udarbejdelse af normaliseringsreferencer og vægtningsfaktorer er dokumenteret i den tekniske rapport for Delprojekt 4 (Stranddorf et al., 2005). Kort beskrevet er de nye normaliseringsreferencer fremkommet enten ved at bruge de aktuelle emissioner i beregningerne, eller ved at ekstrapolere emissioner fra en region (f.eks. EU) til global skala ved at bruge bruttonationalproduktet som skaleringsfaktor. Det er klart, at den første mulighed giver de mest præcise resultater, og det har da også været den foretrukne fremgangsmåde. Emissionsopgørelser af den nødvendige kvalitet findes imidlertid kun for få belastningskategorier, og den udviklede ekstrapolationsmetode er derfor i udstrakt grad anvendt ved beregninger for lokale og regionale belastningskategorier. Vægtningsfaktorerne er beregnet på samme måde som i den originale UMIP- metode. Det er imidlertid svært at finde konsistent information om reduktionsmål for lokale og regionale miljøbelastninger på globalt niveau, og disse er derfor ikke blevet beregnet. For at råde bod på denne "mangel" giver Guidelines derfor en række anbefalinger om, hvad man kan gøre i stedet. De generelle anbefalinger er forholdsvis simple og i korthed sammenfattes i følgende tre punkter:
Anbefalingerne afspejler i nogen grad de indbyggede usikkerheder ved normalisering, især hvis der er tale om en LCA med et bredt omfang. Det er klart, at jo bedre de geografiske afgrænsninger af produktsystemet og dets miljøbelastninger er kendt, jo bedre vil normaliseringstrinnet kunne afspejle den relative vigtighed af de enkelte belastninger. Anbefalingerne er en modificering af den originale UMIP-metode, hvor de danske normaliserings- og vægtningsreferencer blev anbefalet i vurderingen af lokale og regionale belastninger. Det foreslåede skift til brug af normaliseringsreferencer og vægtningsfaktorer for EU retfærdiggøres af, at den geografiske afgrænsning på denne måde passer bedre til mange af de produktsystemer, der vil blive undersøgt i en LCA, samtidigt med at normaliseringsreferencerne har en acceptabel kvalitet. På trods af de simple anbefalinger vil der i praksis være tale om, at LCA- praktikeren skal foretage det endelige valg. Årsagen til dette er, at LCA efter den originale UMIP-metode vil inkludere belastningspotentialer, der finder sted i et bredt udvalg af lande og regioner, uden at det er muligt at skelne mellem disse i de endelige resultater. LCA-praktikeren må derfor vælge den tilgang, der giver den bedste beslutningsstøtte for slutbrugeren af LCA'en. De nærværende Guidelines indeholder et gennemgående eksempel, der er taget fra de originale UMIP-rapporter. I eksemplet er anbefalingerne fremhævet, samtidigt med at de tilsvarende værdier fra alternative tilgange og den originale UMIP-metode præsenteres. Eksemplet giver således et interessant overblik over betydningen af udviklingen i emissionsopgørelser og reduktionsmål siden den originale UMIP-metode blev beskrevet i 1996, ligesom eksemplerne viser de forskelle, der i den konkrete case fremkommer ved at bruge forskellige tilgange. Det ligger udenfor denne rapports rammer at diskutere eksemplets resultater nærmere, men det er oplagt, at det øgede antal valgmuligheder kan give et mere nuanceret billede af livscyklusbelastningerne for et givet produkt eller produktsystem. På den anden side vil det øgede antal valgmuligheder dog ofte medføre, at der er flere spørgsmål, der kan eller skal besvares. Hvilke spørgsmål, der et givet fald skal besvares, kan naturligvis ikke forudses, men det anbefales generelt at fokusere på de områder, hvor der er væsentlige forskelle ved at bruge forskellige tilgangsvinkler. De forbedrede muligheder for normalisering og vægtning i UMIP-metoden er ikke brugt i praksis endnu. LCA-praktikere vil formodentlig hurtigt finde ud af at udnytte mulighederne, for eksempel i forbindelse med en følsomhedsanalyse. De eventuelle vanskeligheder, der måtte være forbundet hermed, vil blive væsentligt mindre så snart man har gjort sig de første erfaringer. Afslutningsvis skal det nævnes, at der i Delprojekt 5 i det samlede LCA- metodeudviklings- og konsensusprojekt er udviklet en alternativ vurderingsmetode (Hauschild og Potting, 2005). Den alternative metode tager hensyn til steds-speficikke karakteristika ved de udledninger, der bidrager til forskellige belastningskategorier, og giver dermed en reduktion af de usikkerheder, der er forbundet med normaliserings- og vægtningsproceduren i den originale UMIP-metode. Summary and conclusionsThe present Guidelines present an extension of the original EDIP methodology in the form of normalization references and weighting factors for EU-15 and the world. At the same time, the normalization references and weighting factors for Denmark have been updated. The results are presented in the table below: The establishing of the normalization references and weighting factors is documented in a technical report (Stranddorf et al., 2005). In short, the new normalization references have been established in two ways, i.e. by using actual emissions in the calculations, or by extrapolating the emissions from one region (e.g. the EU) to a global scale by using the gross domestic product (GDP). Obviously, the first option provides the most precise results and has been the preferred choice, but emission inventories of sufficient quality are only available for a few impact categories and therefore the developed extrapolation method was applied for the local and regional impact categories to yield figures on the Global scale. The weighting factors have been calculated according to the methodology described in the original EDIP reports. Consistent information on reduction targets for local and regional impacts was difficult to find on the Global scale and were therefore not calculated; the Guidelines provide recommendations on what to do instead. The general recommendations are fairly simple, and can in short be expressed in the following way:
The recommendations above reflect to some extent the inherent uncertainties in normalisation, especially if the step has a broad scope. Obviously, the more is known about the product (system) investigated as regards the geographical extent of its potential impacts, the more precisely the normalisation step will mirror the relative importance of different impacts. The recommendations are a modification of earlier recommendations for EDIP97, where Danish normalisation references were recommended for regional and local impacts. The suggested shift to the EU normalisation reference is justified by the better scope for many industrial products, combined with the fact the EU-normalisation references are of an acceptable quality. Although the general recommendations are simple, they still leave the LCA practitioner with the final choice. The reason for this is that most LCAs using the original EDIP methodology will include impact potentials that occur in a wide selection of countries and regions and it is not possible to discriminate between these in the final results. The practitioner must therefore decide which approach gives the most suitable results for the user of the LCA. The Guidelines include an example, where the recommended values are highlighted and the alternative results presented alongside, together with the results obtained by using the original EDIP method. The example thus provides an interesting overview of both the importance of the development in emission inventories since the original EDIP and the differences that are observed when using different approaches. It is outside the scope of this report to discuss the findings in the example in detail, but it is obvious that the increased number of possibilities for choosing can provide a more balanced view of the life cycle impacts in the life cycle of a product. At the same time, however, the increased amount of information can also cause additional questions to be asked. Exactly which questions that will emerge cannot be determined at this moment, but it is a general recommendation that they should concentrate on those issues where significant changes are observed. The improved possibilities for normalisation and weighting have not been utilised in "real" LCA so far. LCA-practitioners will most probably quickly find a way to use the possibilities, e.g. as a part of the sensitivity analysis. The efforts needed in doing so will decrease significantly when the first experiences have been gained. Finally, it is mentioned that in Subproject 5 of the Danish LCA Methodology Development and Consensus Project, an alternative to the original EDIP methodology has been developed and documented (Hauschild og Potting, 2005). This alternative focuses on using the site-specificity of the contributions to different environmental impacts in the assessment and thereby reducing the inherent uncertainties associated with the normalisation and weighting procedure used in the original EDIP method. 1. Introduction
This guideline focuses at the optional steps in LCA, normalisation and weighting. Normalisation is a part of the EDIP methodology used to compare results (e.g. global warming) to well-known figures, and weighting aims at ranking different impact categories against each other in order to determine their importance according to political targets. The present guidelines present an update and extension of the original EDIP methodology in relation to normalisation and weighting. Further, the guideline is focused on choice of impact categories and choice of normalisation reference. It is also mentioned here that a parallel methodology has been developed in another subproject in the Danish LCA methodology and Consensus project. This methodology is termed EDIP 2000 and uses site-differentiated characterisation and normalisation. 1.1 Normalisation and weighting and standardisationIn the international standardisation organisation, ISO, a number of standards regarding LCA has been developed and approved. One of these standards, ISO 14042, Life Cycle Impact Assessment (LCIA), deals with the subject of normalisation (calculating the magnitude of the category indicator results) and weighting (assignment and calculation of different impact categories and resources reflecting the relative importance). This is based on value choices. According to ISO 14042, life cycle impact assessment includes several steps from the inventory to the interpretation:
In Life Cycle Impact Assessment, the first three steps; assignment of inventory results to impact categories, the characterisation, and the classification are mandatory, while normalisation, grouping and weighting are optional elements. 1.1.1 EDIP applied to ISO EDIP offers two ways of identification of the relative proportion of category indicators to reference values (normalisation in ISO terminology). One is to identify the relative proportion to current values. The other is to identify the relative proportion of category indicators to future values. In the original EDIP 1997 these ways are called normalisation and weighting, respectively. In order to avoid confusion, the terminology from EDIP 1997 is used in this update as well. However, it is recommended when presenting results from LCA work to use the ISO wording. 1.2 The concept of normalisation and weighting in EDIPBasically, the guideline takes off from the technical report (Stranddorf et al. 2005). This includes further development and extension of normalisation references compared to the original EDIP97 methodology as it is explained in Wenzel et al. (1997) and Hauschild and Wenzel (1998). In EDIP, along with the normalisation the concept of the person equivalent is developed. This is also used in the weighting process. The concepts of normalisation, person equivalent and weighting are explained below. In EDIP as well as in the ISO standards, the overall advantage of normalisation is an increased possibility of interpretation of indicator results compared to each other. Further, it also provides an option of control by unveiling extreme indicator results. Finally, normalisation is a preparatory element in the optional element of weighting. The goal of normalisation is to refer the impact scores to a common reference to enable comparison of different environmental impacts. It is an integral part of EDIP that the impacts are summarised for the area, which actually contributes to the current condition of the environment as it is experienced. For the global impacts it makes no difference where the environmental exchanges occur. But for regional and local impacts, only the exchanges occurring within the regions or local areas in question contribute to the current and future condition in the environment there. Due to this reasoning the normalisation and the subsequent weighting should ideally be carried out with normalisation references and weighting factors which, for each individual emission, are representative of the region where the emissions occur. However in the original EDIP 1997, the data for the global impacts are available while data for regional impacts, generally, are not available. Instead, EDIP use Danish normalisation references as default values for regional and local impacts. In contrast to EDIP 97 it has been chosen to regard human toxicity and ecotoxicity as being primarily regional impacts with the same normalisation reference being applied to all EU-15 countries. It is, however, also possible to use the updated Danish normalisation reference, e.g. in an assessment of specific Danish products or product systems, or as an element in the sensitivity analysis. The same possibility also exists for most of the other EU-15 countries. Due to lack of data no regional normalisation references for other regions e.g. Central Africa and the Middle East have been developed. For acidification, normalisation references are provided for EU-15 as well as for the individual countries within EU-15. The individual normalisation references can be found in Stranddorf et al. (2005). A different approach has been taken in a parallel project within the LCA methodology and consensus project, site-characterisation (Hauschild & Potting, 2005). The present guideline does not discuss the pros and cons of either method, but provides only an update of the original EDIP97 method with respect to normalisation and weighting. This project has provided a large number of normalisation references for EU-15 countries but substantial work still remains to be done before the ultimate goal, i.e. normalisation references for all relevant regions in the World, can be reached. 1.2.1 The person-equivalent The global impact will always be much greater than the impact from a particular region, irrespective of the type of effect to which the impact contributes. Use of global impacts as normalisation reference for the global impact categories, and regional impacts for the regional, and local impact categories will give an imbalance in the normalisation, and it will result in global impacts from the product system appearing as much less than the other impacts, because they are compared with the activity of the population of the entire world, while the others are compared only with the activity of, e.g. the European population. To correct this bias and ensure that the set of normalising references constitutes a common scale for all impact categories the normalisation references are calculated as the background impact over the course of one year per person in the area for which the impact is computed, irrespective of whether they are global or regional. This gives the normalisation references the unit "impact potential per person per year" for each individual impact category. Thus, when the impact potentials are normalised, they are expressed in person-equivalents, i.e. fractions of the contribution to the impact deriving from the average person in the affected area. 1.2.2 Establishing of normalisation references Normalisation references are established for Denmark, Europe (EU-15), and worldwide. For the relevant area surveys of emissions contributing to the different impact categories have been established. The normalisation references are calculated based on EDIP (Wenzel et al. 1997):
where: i.e. for each of the substances contributing to the impact category, the emitted quantity is multiplied with the equivalence factor for the specific substance giving the potential impact caused by the specific substance. The potential impacts by all the contributing substances are summarised and finally divided with the number of capita in the considered area. The figures used for normalisation in the EDIP methodology are the potential impacts caused per capita in a defined geographical area e.g. potential greenhouse effect per capita per year. 1994 has been chosen as reference year. The actual normalisation references are in general expressed as equivalents, e.g. kg CO2-eq./capita/year, with human toxicity and ecotoxicity being exceptions from this. When normalised the potential environmental impact is expressed in person equivalents (e.g. PEW94 or PEEU94) - i.e. relative to the annual contribution to the effect by one person in the affected area. The index to the unit expresses that the reference region for the normalisation is either the world or EU and the reference year is 1994. In principle, the normalisation methodology allows different impact categories to be compared to each other. The present study has developed normalisation references for Denmark, Europe (EU-15) and worldwide and provides thus the opportunity of a more versatile impact assessment. 1.2.3 Weighting The figures used for weighting in the EDIP methodology are based on the political reduction targets for the individual substances contributing to the relevant impact category. 2004 has been chosen as the target year. The actual weighting factors are dimensionless. The weighting factors are linked to the above mentioned normalisation references with regard to the geographical area covered. The present study presents weighting factors for Denmark, Europe (EU-15) and worldwide. The procedure for applying and using weighting in this project consists of the following steps:
In this project 1994 has been chosen as reference year and 2004 as target year. The weighting factor (WF) for impact category x on a given geographic scale is thus defined as follows:
As the actual political targets for reducing certain pollutants in the different countries seldom are related to the target year selected for this project, it has been necessary to interpolate and extrapolate the data, so that the weighting factors for all effect categories relate to year 2004. The interpolation is done linearly. The unit of weighted impact potentials is the targeted person equivalent – the PETWEU2004 – expressing the environmental impact from an average citizen according to the political targets for each of the impact categories in the year 2004. The index expresses that the reference region for the weighting and the underlying normalisation is either the world (W) or EU (EU) and the target year used for the weighting is 2004. In line with the thinking applied in the life cycle impact assessment standard ISO 14042, the weighting of EDIP97 using political targets to derive weighting factors can be seen as a normalisation where the politically targeted level of impact is used as normalisation reference, representing the probable future environmental impact – a prediction of what the background impact will be in 2004. In ISO TR14047, which illustrates the use of ISO 14042, an example presents this interpretation which means that the use of the EDIP default weighting factors is acceptable according to ISO 14042, also in comparative assertions disclosed to the public, where weighting is not allowed. 1.2.4 Reference year In the original EDIP97, 1990 was used as reference year for normalisation, while 1990 and 2000 were chosen as the reference and target year for weighting. In this update, 1994 and 2004 have been chosen as new reference year and target year for normalisation references and weighting factors, respectively. The reason for choosing 1994 as reference year has been the relatively easy availability of compilations of data for most of the countries included in the EU-15 normalisation reference. In the recent years the availability of emission data has increased significantly e.g. by access to databases via Internet, and the delay caused by central compilation of data can be expected to be reduced in the future. Therefore, future updating can be expected to be faster with reference years closer to the actual year. 1.3 Purpose of the guidelineThe purpose of the guideline is to provide guidance on choice of impact categories in LCA. Based on a comprehensive list in the technical report, the guideline lists the most commonly used impact categories. In addition to the list, general considerations regarding quantitative and qualitative assessment of impact categories are presented. Further the purpose of the guideline is to
The principle of normalisation is - as mentioned above - that global impacts are normalised globally, the regional impacts and the local impact are normalised regionally. The new normalisation reference includes normalisation reference at both the regional and local levels for the relevant impact categories. Therefore, the guideline also provides guidance on when to apply the different normalisation references. 1.4 How to read the guidelineChapter 2 is focused on a comprehensive list of impact categories to be included in LCA. In the chapter the list is presented and some considerations regarding which impact categories to choose or exclude are presented as well. Chapter 3 presents the updated and extended normalisation references and it deals with the application of these normalisation references. The principles in weighting and a list of updated weighting factors are also presented. Chapter 4 to 10 deals with the impact categories for which updated normalisation references are developed. All chapters are structured in an equal manner: Each chapter begins with a short presentation of the environmental issue and what potential impacts the issue has. The contributions of different substances to the impact category are listed in a table and it is followed by a description of how the normalisation reference for the specific impact category is modelled. Correspondingly, the procedure of the weighting factor is also included. In the chapter regarding global warming (Chapter 4), a detailed description of the steps in the calculation is demonstrated. Recommendations for the use of normalisation references are presented and in order to illustrate the applicability of the new normalisation references, a common imaginary example is used in the guideline. The full example is shown in Chapter 11. In each chapter regarding the impact categories the relevant part of the example is brought. For each impact category, the chapter is finalised with a section with further literature. 1.5 ReferencesHauschild, M. & Potting, J. 2005. Background for spatial differentiation in life cycle impact assessment - the EDIP2003 methodology. Environmental Project no. 996, Danish EPA, 2005 Hauschild, M. & Wenzel, H. 1998, Environmental Assessment of Products. Volume 2 - Scientific background. First edition. Chapman & Hall, London. ISO TR 14047. Illustrative examples on how to apply ISO 14042 – Life cycle assessment – Life cycle impact assessment. International Organisation of Standardisation, Paris. Stranddorf, H.K., Hoffmann, L. & Schmidt, A. 2005. Update on impact categories, normalisation and weighting in LCA. Environmental Project no. 995, Danish EPA, 2005 Wenzel, H., Hauschild, M. & Alting, L. 1997. Environmental Assessment of Products.Volume 1 - Methodology,Tools and Case Studies in Product Development. First edition. Chapman & Hall, London. 2. Selection of impact categoriesThe selection of impact categories depends on the purpose of the LCA, e.g. what kind of decision is going to be taken based on the LCA. Obviously, the choice also depends on the type of application of the LCA. Basically, selection of impact categories is a matter between the commissioner and the practitioner, and no methodology includes specific guidelines on which impact categories that have to be included in LCA. Based on a survey of four internationally known methodologies and the draft ISO 14047 (ISO 1999) technical report a comprehensive list of impact categories is established. The list is presented below in Table 2.1. In the comprehensive list it is also indicated if the specific impact categories are considered to be global, regional or local. Further, it is indicated if international consensus regarding the impact category in LCA has been reached. Table 2.1 Characterisation of impact categories.
1 Nielsen PH and Laursen J has recently (June 2000) submitted with a substantial input regarding classification and characterisation of noise, integration of external noise nuisance from road and rail transportation in life cycle assessment. A short description of each of the impact categories can be found in chapter 2, Selection of impact categories, in the report "Update on impact categories, normalisation and weighting in LCA." (Stranddorf et al. 2005) and in the detailed chapters in the same report. As it appears all impact categories (apart from effects of waste heat water and effects on eco-systems) have reached some sort of international consensus regarding classification and characterisation. In both exceptions, it is disputable if the impact categories can be considered as real impacts. It should be noted that although the above list is comprehensive, it does not include all possible types of impacts. If other types of impacts are of relevance for an LCA study, a suitable method (quantitative or qualitative) for their assessment should be defined and documented thoroughly, fulfilling the general requirements and recommendations in the ISO standards. Except for the remarks in the subsequent section, it is outside the scope of the present guideline to give further recommendations regarding this. 2.1 Considerations regarding choice of impact categoryThere is a large overlap in the suggested impact categories among different lists, illustrated in Table 2.1. However, the list and its underlying methodology do not guide a practitioner in the exclusion (or inclusion) of impact categories for different applications of LCA. The ISO 14042 (ISO 2000) provides the following guidance regarding selection of impact categories, category indicators and characterisation models including the criteria for environmental relevance:
2.1.1 General recommendation The aim of any LCA must be to ensure that the results are robust enough to form a basis for further considerations or for a decision. Of the different methodologies and standards for the recommendation regarding selection of impact categories the ISO 14042 probably provides the most guidance. Below a few general recommendations are presented:
2.2 ReferencesISO 2000, Environmental management - Life cycle assessment - Life cycle impact assessment. ISO 14042. ISO TR 14047. Illustrative examples on how to apply ISO 14042 - Environmental management - Life cycle assessment – Life cycle impact assessment. International Organisation of Standardisation, Paris. Stranddorf, H.K., Hoffmann, L. & Schmidt, A. 2005. Update on impact categories, normalisation and weighting in LCA. Environmental Project no. 995, Danish EPA, 2005. Nielsen, P.H. & Laursen, J.E.: Integration of external noise nuisance from road and rail transportation in life cycle assessment. In Potting, J. and Hauschild, M. (eds.): Background for spatial differentiation in LCA impact assessment. Environmental Project no. 996. Danish Environmental Protection Agency, Copenhagen, 2005. 3. Application of normalisation references and weighting factorsThe strategy so far has been to normalise global impacts globally as well as regional and local impacts regionally, based on Danish conditions. In the present project, new normalisation references have been developed for global, regional and local effects. For global warming and stratospheric ozone depletion global normalisation references have been calculated. For photochemical ozone formation, acidification, nutrient enrichment, human toxicity and ecotoxicity Danish and European (EU-15) normalisation references have been calculated and worldwide normalisation references have been extrapolated. As regards weighting updated figures are also provided. In some instances the new figures also include regional, national and global political targets. For global warming there are targets for industrialised countries as well as developing countries. The updated and extended normalisation references and weighting factors are presented in Table 3.1. The basic intentions with updating and extension of the normalisation references are that:
Furthermore, the new set of normalisation references allows the user to choose a normalisation reference adjusted to a specific purpose. These new possibilities give occasion for choosing, the main question being when and how to apply specific normalisation references. First of all, the intention with updating the weighting factor is still to allow the weighting since the target year of 2000 in the original EDIP is reached. Secondly, the goal of the new weighting factors is to provide more possibilities since more factors for the different impact categories are provided. The new possibilities give occasion for choosing, e.g. if your company is situated in an industrialised country and you choose to place your production in a developing country. If you want to weight your normalised results you can choose either to take the weighting factor for the developing countries (e.g.) for global warming or you can choose the weighting factor for the country. Both options are possible (and allowed), but in any case you have to argue for your choice. Table 3.1 Normalisation references and weighting factors, original EDIP97 and update (Global, EU-15, and Denmark) 3.1.1 When and how to apply specific normalisation For use of the updated EDIP97 normalisation references, the following recommendations are given for normalisation of the LCA results:
The recommendations above reflect the inherent uncertainties in normalisation, especially if the step has a broad scope. Obviously, the more is known about the product (system) investigated as regards the geographical extent of its potential impacts, the more precisely the normalisation step will mirror the relative importance of different impacts. The recommendations are a modification of earlier recommendations for EDIP97, where Danish normalisation references were recommended for regional and local impacts. The suggested shift to the EU normalisation reference is justified by the better scope for many industrial products, combined with the fact the EU-normalisation references are of an acceptable quality. 3.1.2 Example In the following sections on specific impact categories, the general recommendations above are exemplified in a specific case. The case, an LCA of a refrigerator, is presented in short in Chapter 11, including the figures for impact potentials. 4. Global warming
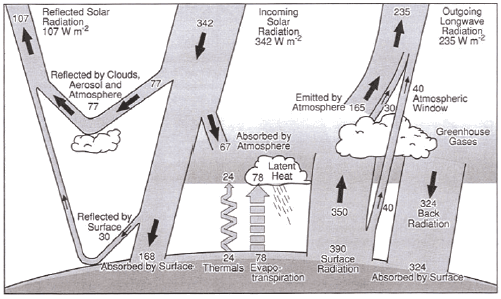
Global warming - or "greenhouse effect"/"climate change" - addresses the effect of increasing temperature in the lower atmosphere. The atmosphere is normally heated by incoming radiation from the sun. A part of the radiation is normally reflected by the surface of the Earth but the content of carbon dioxide (CO2) and other "greenhouse" gasses (e.g. methane (CH4), nitrous oxide (N2O), chlorofluorocarbons etc.) in the atmosphere reflects or absorbs the IR-radiation resulting in the greenhouse effect, i.e. an increase of temperature in the lower atmosphere to a level above normal. The possible consequences of the greenhouse effect include an increase of the temperature level leading to melting of the polar ice caps and glaciers in mountain area, resulting in elevated sea levels. The increasing temperature level may also result in regional climate changes.
Figure 4.1 Global warming - energy balance (Trenberth et al. 1996). The complexity of this modelling is high and the difficulty in calibration and verification of the modelling is huge. However, it is considered as a fact that the global temperature has increased during the last century. The specific consequences of global and regional climate changes due to increase of temperature are uncertain. Lately, computer models have been developed, demonstrating increased intensity as well as frequencies of storms, increased number and length of draught. Although the consequences of the climate changes are considered uncertain there seems to be a general international agreement that there will be (a risk of) huge impacts, which should be avoided or at least minimised. This is reflected in international agreements like the Montreal Protocol and the Kyoto Protocol with respect to reduction of relevant substances. 4.1 Substances contributing to the impact categoryThe substances contributing to global warming are defined as substances which at normal temperature and pressure are gases and:
The substances normally considered as contributors to global warming are:
For CO2 it is a special requirement that the emission must represent a net contribution, i.e. it must increase the content of CO2 in the atmosphere beyond that which would be observed if the emission did not take place. Examples of this are burning of fossil fuels and changes in land use, e.g. as a cause of deforestation. Use of biomass (wood, straw, etc.) for energy production does not give a net contribution, because it can be assumed that the materials would degrade under all circumstances. 4.2 Global Warming PotentialIn the original EDIP (Wenzel et al. 1997; Hauschild & Wenzel 1998) and many other LCA methodologies the potential global warming or greenhouse effect is quantified by using global warming potentials (GWP) for substances having the same effect as CO2 in reflection of heat radiation. GWP for greenhouse gases are expressed as CO2-equivalents, (CO2-eq.) i.e. the effects are expressed relatively to the effect of CO2. GWP's are normally based on modelling and are quantified for time horizons of 20, 100 or 500 years for a number of known greenhouse gasses (e.g. CO2, CH4, N2O, CFC's, HCFC's, HFC's and several halogenated hydrocarbons etc.). The emission of greenhouse gasses is regulated by the Kyoto Protocol under the Climate Convention. Global warming potentials for the known greenhouse gasses are developed by the "Intergovernmental Panel on Climatic Change" (IPCC) and they are revised continuously as the models used in the calculations are developed. GWP-values can be found in Hauschild and Wenzel (1998) and the last revision of some of the GWP-values for a number of substances can be found in Schimel et al. (1996). The potential greenhouse effect of a product/process can be estimated by calculating the product of the amount of emitted greenhouse gas per functional unit and the potential for greenhouse effect given in kg CO2-equivalents per kg emitted gas. 4.3 Normalisation reference and weightingfactor for global warming The normalisation references and the weighting factors for global warming are calculated according to the general formula in chapter 1, Introduction. Table 4.1 presents the normalisation references and the weighting factors for global warming in different regions. Table 4.1 Normalisation reference and weighting factors for global warming (Hoffmann 2001; Busch 2001).
Global warming is a global effect and therefore the global normalisation reference is recommended. It is also recommended to use the global weighting factor for the global impacts. 4.4 Example of applying normalisation reference and weighting for global warmingThe normalised global warming potential for the considered product is calculated as follows: where:
where: Calculation of the weighted impact potential for the considered product is done as follows: where:
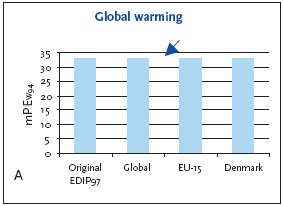
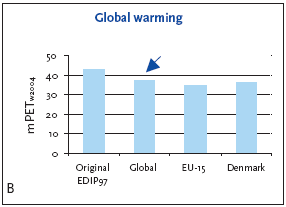
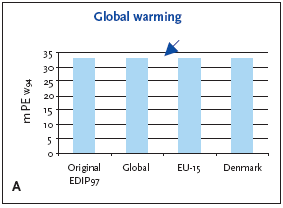
where: Figure 4.2 illustrates the normalised global warming potentials calculated by applying the global normalisation reference. For impacts that are potentially global, the global normalisation reference combined with the global weighting factor for global warming are recommended. Based on an impact potential for the product in question at 0.29 ton CO2-eq./year the actual normalised and weighted values are 33 mPEW94 and 37 mPETW2004 respectively. Figure 4.2 Normalised (A) and weighted (B) global warming potentials for production of a refrigerator at different localities. Arrows indicate the recommended choices.
4.5 If you would like to know moreYou can read more about the subject in: Busch, N.J. 2005, Calculation of weighting factors. In Stranddorf, H.K., Hoffmann, L. & Schmidt, A. Update on impact categories, normalisation and weighting in LCA. Environmental Project no. 995, Danish EPA, 2005 Hansen, J.H. 1995, Ozonlagsnedbrydende stoffer og HFC - forbrug i 1994. Miljøprojekt nr. 302. København: Miljøstyrelsen. Hauschild, M. & Wenzel, H. 1998, Global warming as a criterion in the environmental assessment of products. In Hauschild M, Wenzel H (eds.). Environmental assessment of products.Volume 2: Scientific background. London: Chapman & Hall. Hoffmann, L. 2005, Global warming. In Stranddorf, H.K., Hoffmann, L. & Schmidt, A. Update on impact categories, normalisation and weighting in LCA. Environmental Project no. 995, Danish EPA, 2005 Trenberth, K.E., Houghton, J.T., Meira Filho, L.G. (1996). The climate system: an overview. Chapter 1 in Houghton, J.T., Meira Filho, L.G., Callander, B.A., Harris, N., Kattenberg, A. & Maskell, K. (eds.) Climate change 1995 - The science of climate change. Cambridge: Cambridge University Press. Wenzel, H., Hauschild, M. & Alting, L. 1997, Environmental Assessment of Products.Volume 1 - Methodology,Tools and Case Studies in Product Development. First edition. Chapman & Hall, London. http://www.unep.org; http://www.unep.ch 5. Stratospheric ozone depletion
The concentration of the reactive oxygen compound ozone O3 is significantly higher in the stratosphere than in other parts of the atmosphere, e.g. the troposphere A number of substances, some of which occur naturally in the stratosphere, are involved in the breakdown of ozone: long-lived chlorine and bromine compounds, methane (CH4), nitrous oxide (N2O), and water vapour H2O. The reaction systems are complex. However, there is an international consensus about the issue and there is an international agreement based on the Montreal protocol concerning phase out of the relevant substances. The atmosphere receives ultraviolet radiation from the sun. Ozone molecules in the stratosphere absorb large quantities of this UV radiation, thus removing the life-threatening UV-C radiation and reducing the harmful UVB radiation. The reduction in the ozone concentration in the stratosphere will probably have a serious effect on the life on the surface of the Earth. It can cause damage to plants, animals, and humans. In the area around the South Pole (which is considered to be the most affected) effects on phytoplankton have been observed. Phytoplankton is a primary producer in every aquatic food chain and consequences can therefore be expected to be dramatic. The ozone depletion will also effect humans in the form of skin cancer, reduced immune defence etc. 5.1 Substances contributing to stratospheric ozone depletionThe substances contributing to stratospheric ozone depletion are defined as substances which:
The substances included are:
The substances are regulated in the Montreal Protocol (UNEP 1987). 5.2 Ozone Depletion PotentialIn EDIP (Hauschild & Wenzel, 1998), the potential depletion of stratospheric ozone is quantified by using ozone depletion potentials (ODP) for substances having the same effect as CFC's. CFC-11 has been chosen as reference substance in EDIP as it is in most other contexts. This is due to the fact that it is well studied and that it is one of the substances having the largest effect on ozone depletion. The ODP describes the ozone depletion potential from a substance relative to CFC-11. The modelling of the effect is complex. Data for modelling consist of e.g. the stability of the substance, its lifetime and the time horizon considered. Ozone depletion potentials have been presented by the World Meteorological Organisation (WMO) for a number of halogenated compounds (Solomon & Wuebbles 1995; Pyle et al. 1991). The actual ozone depletion potential is determined by a number of factors e.g. the content of chlorine and bromine and the chemical and photochemical stability of the substances. More recent reports containing information on production and consumption of ozone depleting substances (UNEP (1998), UNEP (2000)) also report ozone depleting potentials on the controlled substances. 5.3 Normalisation references and weighting factors for ozone depletionThe normalisation references and weighting factors for ozone depletion potential are calculated according to the formula in chapter 1, Introduction. Table 5.1 presents the normalisation references and the weighting factors for ozone depletion. Table 5.1 Normalisation reference and weighting factors for stratospheric ozone depletion (Hoffmann 2005; Busch 2005).
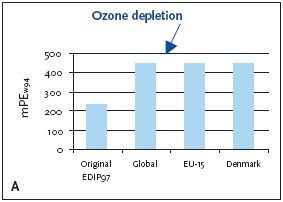
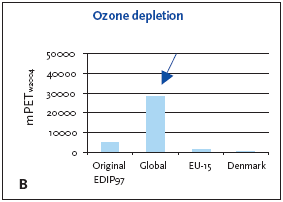
1. Industrialised countries/Developing countries 5.3.1 Recommendation of applying normalisation reference and weighting factors for ozone depletion Ozone depletion is a global impact and therefore only a global normalisation reference is relevant. 5.4 Example of applying the normalisation reference and weighting factor for ozone depletionBelow an example of applying the normalisation reference and weighting factor for a product (a refrigerator) is presented. Figure 5.1 illustrates the normalised ozone depletion potential calculated by applying the global normalisation reference. Irrespective of the geographical boundaries, the global normalisation reference combined with the global weighting factor for ozone depletion are recommended. Based on an impact potential for the product in question at 0.046 kg CFC-11-eq./year the actual normalised and weighted values are 448 mPEW94 and 28230 mPETW2004 respectively. Please note that the Danish weighting factor is infinite. Figure 5.1 Normalised (A) and weighted (B) ozone depletion potentials for production of a refrigerator at different localities.
5.5 If you would like to know moreAlbritton, D.L., & Kuijpers, L. (eds.) 1999, Synthesis of the Reports of the Scientific, Environmental Effects, and Technology and Economic Assessment Panels of the Montreal Protocol. A Decade of Assessment for Decision Makers Regarding the Protection of the Ozone Layer: 1988-1999. Nairobi: United Nations Environment Programme (UNEP). Available at http://www.unep.ch or http://www.unep.org. Busch, N.J. 2005, Calculation of weighting factors. In Stranddorf, H.K., Hoffmann, L. & Schmidt, A. Update on impact categories, normalisation and weighting in LCA. Environmental Project no. 995, Danish EPA, 2005. Hansen, J.H. 1995, Ozonlagsnedbrydende stoffer og HFC - forbrug i 1994. Miljøprojekt nr. 302. København: Miljøstyrelsen. Hauschild, M. & Wenzel, H. 1998, Stratospheric ozone depletion as a criterion in the environmental assessment of products, in Environmental assessment of products.Volume 2: Scientific background, eds. Hauschild M, Wenzel H. London: Chapman & Hall. Hoffmann, L. 2005, Stratospheric ozone depletion. In Stranddorf, H.K., Hoffmann, L. & Schmidt, A. Update on impact categories, normalisation and weighting in LCA. Environmental Project no. 995, Danish EPA, 2005. Pyle, J.A., Wuebbles, D., Solomon, S. & Zvenigorodsky, S. 1991, Ozone depletion and chlorine loading potentials. World Meteorological Organisation: Scientific assessment of stratospheric ozone: 1991 Global ozone research and monitoring project. Report no. 25. Geneva. Solomon, S. & Albritton, D.L. 1992, Time-dependent ozone depletion potentials for short- and long-term forecasts. Nature, vol. 357, pp. 33-37. Solomon, S. & Wuebbles, D. (lead authors) 1995, Ozone depletion potentials, global warming potentials and future chlorine/bromine loading in Scientific assessment of ozone depletion, 1994 eds. Albritton, D.L., Watson, R.T. & Aucamp, P.J. World Meteorological Organisation, Global Ozone Research and Monitoring Project - Report No. 37. Geneva: WMO. UNEP 1987, The 1987 Montreal Protocol on Substances that Deplete the Ozone Layer as adjusted and amended by the second Meeting of the Parties (London, 27-29 June 1990) and by the fourth Meeting of the Parties (Copenhagen, 23-25 November 1992) and further adjusted by the seventh Meeting of the Parties (Vienna, 5-7 December 1995) and further adjusted and amended by the ninth Meeting of the Parties (Montreal, 15-17 September 1997). Available at: http://www.unep.org. UNEP 1998, Data report on production and consumption of ODSs - 1986 - 1996. United Nations Environment Programme, Ozone Secretariat. UNEP (2002). Production and consumption of ozone depleting substances under the Montreal Protocol 1986-2000. UNEP Ozone Secretariat, Apreil 2002. (http://www.unep.org/ozone). 6. Photochemical ozone formation
Ozone is formed in the troposphere under the influence of sunlight when nitrogen oxides are present. When VOC's are also present, peroxy radicals can be produced. Peroxy radicals are highly reactive and toxic compounds, and the presence of peroxy radicals can result in an increase of the concentration of ozone through a complex reaction pattern. Ozone is a secondary pollutant, as there is practically no ozone present in source emissions derived from human activity. Tropospheric ozone, or ground level ozone, has been recognised as one of the most important environmental threats on the regional scale. At high concentrations it is hazardous to human health, but already at lower concentrations it causes damage to vegetation. Ozone is a transboundary pollutant, and it can be produced or consumed by other pollutants during transport over long ranges. The health problems caused by ozone have generally been considered to be an effect of the very high peaks of ozone concentration, known as ozone episodes. Increased background levels of ozone cause damage to vegetation, and thereby ozone also imposes an economic threat through a potential reduction of crop yield. It is assumed that anthropogenic emissions have resulted in a rise in the global background of ozone concentration from around 10 ppb in the year 1900 to around 20 ppb in 1975 (Fenger 1995). 6.1 Substances contributing to the impact categoryThe principal precursors of tropospheric ozone are
Primary reaction scheme for ozone formation Reactions (I)-(III) govern the background level of ozone in the troposphere: NO2 + hv –> NO + O (I) If VOC's are also present, they are oxidised to produce peroxy radicals. Peroxy radicals can either consume NO or convert it to NO2 and thus compete with ozone produced by reaction (II). Less ozone is thereby destroyed through reaction (III), and the ozone concentration will then increase. 6.2 Photochemical ozone creation potential (POCP)In EDIP (Hauschild & Wenzel, 1998), the photochemical ozone formation is described through POCP, the photochemical ozone creation potential, as an individual impact category. While POCP is used in Europe for the ranking of VOC's according to their ability to produce ozone a slightly different approach is used in the US: Incremental Reactivity (Carter et al. 1995). The "European approach" is being used in the guideline as well as in the technical report (Fuglsang 2005). POCP describes the production of ozone from a VOC emission through computer modelling of a complex series of chemical reactions in the atmosphere over a given scenario. A large amount of input data is required for the calculation of POCP by the model. The input data consist of the following principal components (Derwent et al. 1996):
The model describes the chemical composition of primary pollutants during the transport away from their sources and of secondary pollutants during the transport towards the sensitive receptors where environmental damage may occur. In the model, the chemical composition of parcels of air is followed as they travel across Europe. Emissions of NOx, CO, SO2 and VOC's are introduced into the air parcels in a series of trajectory studies. The trajectories are meant to be illustrative of the general situation during photochemical episodes in Europe, and they illustrate the photochemical production of ozone over 1-5 days (Derwent & Jenkins 1991). For a given VOC, POCP is calculated as the average of the results of the three scenarios. Most of the VOC's are oxidised more than 95% after 4-5 days, so that the calculated POCP represents the total ozone creation potential. 6.2.1 Definition of POCP POCP is generally presented as a relative value where the amount of ozone produced from a certain VOC is divided by the amount of ozone produced from an equally large emission of ethene. The unit of POCP is grams of ethene equivalents per gram of gas (g C2H4/g VOC). Ethene has been chosen as a reference gas as it is one of the most potent ozone precursors of all VOC's. By definition, the calculated POCP values are not absolute values. POCP will be a function of the scenarios chosen, i.e. from one geographical area to another. As data for e.g. the chemical and photochemical reactions are often not known in great detail, their representation in the model will often be a compromise. Therefore, even for the same scenario, the POCP values can be calculated with higher precision when more accurate input data and more powerful computer tools are available. POCP values reflect not only the present amount of ethene equivalents but also the concentration of the present NOx values. It may also be relevant in some cases to distinguish between high and low NOx areas, taking into consideration that the background concentration of NOx is lower in, e.g. Scandinavia. The normalisation reference is therefore calculated by taking the differences between high and low NOx areas into account. 6.3 Normalisation reference and weighting factorsThe normalisation references for photochemical ozone formation potential and the weighting factors for photochemical ozone formation are calculated according to the formula presented in chapter 1, Introduction. Table 6.1 presents the figures for normalisation references and weighting factors. Table 6.1 Normalisation references and weighting factors for photochemical ozone formation (Fuglsang 2005; Busch 2005).
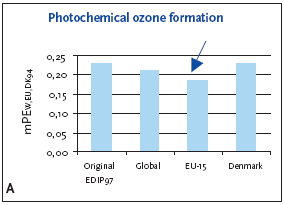
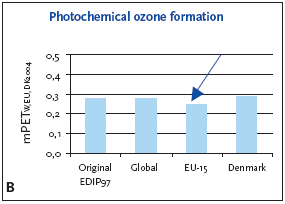
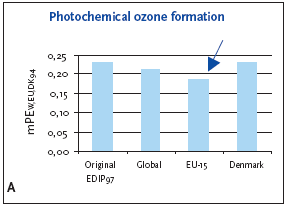
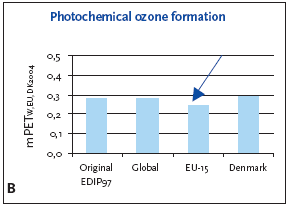
6.3.1 Recommendation of applying normalisation reference and weighting for photochemical ozone formation For photochemical ozone formation as a regional effect the EU-15 normalisation reference is recommended for impact potentials located in Denmark as well as in Europe or the global normalisation reference if the locality is outside Europe or unknown. 6.4 Example of applying normalisation reference and weighting for photochemical ozone formationFigure 6.1 illustrates the normalised photochemical ozone formation potential. For impact potentials located in Denmark the EU-15 normalisation reference combined with the EU-15 weighting factor for photochemical ozone formation are recommended. Based on an impact potential for the product in question at 0.0046 kg C2H4-eq./year the actual normalised and weighted values are 0.18 mPEEU94 and 0.25 mPETEU2004 respectively. Figure 6.1 Normalised (A) and weighted (B) photochemical ozone formation potentials for production of a refrigerator at different localities.
The chosen normalisation reference puts less attention to photochemical ozone formation than if the global or Danish reference was applied. The difference is however small, about 10-15%, and the practical consequences are probably without importance. 6.5 If you would like to know moreAltenstedt, J. & Pleijel, K. 1998, POCP for individual VOC under European conditions. IVL Report B-1305, Swedish Environmental Research Institute, Stockholm. Busch, N.J. 2005, Calculation of weighting factors. In Stranddorf, H.K., Hoffmann, L. & Schmidt, A. Update on impact categories, normalisation and weighting in LCA. Environmental Project no. 995, Danish EPA, 2005. Carter, W.P.L., Pierce, J.A., Luo, D. & Malkina, I.L. 1995, Environmental Chamber Study of maximum incremental reactivities of volatile organic compounds. Atmospheric Environment, 29 (18) pp. 2499-2511. Derwent, R.G. 1996, Photochemical ozone creation potentials for a large number of reactive hydrocarbons under European conditions. Atmospheric Environment, 30 (2) pp. 181-199. Derwent, R.G. & Jenkin, M.E. 1991, Hydrocarbons and the long-range transport of ozone and PAN across Europe. Atmospheric Environment, 25 (8) pp. 1661-1678. Fenger, J. 1995, Ozon som luftforurening. DMU Tema-rapport 1995/3. Fuglsang, K. 2005, Photochemical ozone formation. In Stranddorf, H.K., Hoffmann, L. & Schmidt, A. Update on impact categories, normalisation and weighting in LCA. Environmental Project no. 995, Danish EPA, 2005. Hauschild, M. & Wenzel, H. 1998, Photochemical ozone formation as a criterion in the environmental assessment of products in Environmental assessment of products.Volume 2 Scientific background eds. Hauschild. M. & Wenzel. H. London: Chapman & Hall. McBride, S.J., Oravetz, M.A. & Russel, A.G. 1997, Cost-benefit and uncertainty issues in using organic reactivity to regulate urban ozone. Environm. Sci.Technol. 31 (5), pp. 138A-244A. Olivier, J.G.J, Bouwman, A.F., van der Maas, C.W.M., Berdewski, J.J.M., Veldt, C., Bloos, J.P.J., Visschedijk, A.J.H., Zandveld, P.Y.J. & Haverlag, J.L. 1996, Description of EDGAR version 2.0: A set of global emission inventories of greenhouse gasses and ozone-depleting substances for all anthropogenic and most natural sources on a per country basis and on 1ox1o grid. RIVM report nr. 771060 002/TNO-MEP report nr. R96/119. Ritter, M. 1997, CORINAIR 94 - Summary Report - European Emission Inventory for Air Pollutants. Copenhagen: European Environment Agency. UN-ECE 1979, Convention on Long-range Transboundary Air Pollution. United Nations, Economic Commission for Europe. Available: http://www.unece.org. UN-ECE (1991). Protocol to the 1979 Convention on Long-range Transboundary Air Pollution concerning the control of emissions of volatile organic compounds or their transboundary fluxes. United Nations, Economic Commision for Europe. Available: http://www.unece.org. Wenzel, H., Hauschild, M. & Alting, L. 1997, Environmental Assessment of Products,Vol. 1: Methodology, tools and case studies in product development. London: Chapman & Hall. 7. Acidification
Acidification is regarded as a regional effect. Acidification is caused by releases of protons in the terrestrial or aquatic ecosystems. The acidifying substances are only contributing to acidification if the anion is leached out from the system. Organic acids vil predominantly be mineralised and does therefore not leach to the system. Accordingly, they are not regarded as contributors to acidification. In certain areas, acidification leads to increased mobility of heavy metals and aluminium. In the terrestrial ecosystem the effects are seen in softwood forests (e.g. spruce) but also in hardwood forests (e.g. beech) as inefficient growth and as a final consequence forest dieback. In Europe, these effects are mainly seen in Scandinavia and in the middle/eastern part of Europe. In the aquatic ecosystem the effects are seen as (clear) acid lakes without any wildlife. Clean lakes are mainly seen in Scandinavia. Buildings, constructions, sculptures and other objects are also damaged by e.g. acid rain. 7.1 Substances contributing to the impact categorySubstances are considered to have an acidification effect if they result in (Hauschild & Wenzel, 1998):
The substances normally considered as contributors to acidification are:
The technical report (Hoffmann 2005) summarises the presently available data on emissions of acidifying substances to the Danish and the European environment. The primary contributors are:
7.2 Acidification Potential (AP)In EDIP (Hauschild & Wenzel, 1998), the potential acidification potential is quantified by using acidification potentials (AP) for substances having the same effect as SO2 in reflection of acidification. Acidification potentials are expressed as SO2-equivalents (SO2-eq), i.e. the potentials are expressed relative to the potential of SO2. 7.2.1 Definition of Acidification Potential SO2 is used as a basis for determination of the acidification potential or the equivalence factor. The method of establishing effect factors for acidifying substances is based on stoichiometric considerations and it is internationally accepted. The equivalency factors are determined as (Hauschild & Wenzel, 1998):
where The acidification potential (AP) can be estimated as SO2-equivalents:
where 7.3 Normalisation references and weighting factorsThe normalisation references and the weighting factors for acidification potential are calculated according to the formula presented in Chapter 1, Introduction. Table 7.1 presents the normalisation references and the weighting factors for acidification. Table 7.1 Normalisation references and weighting factors for acidification (Hoffmann 2001; Busch 2001).
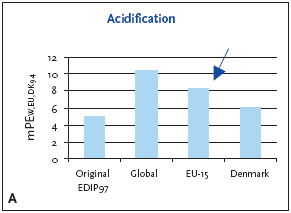
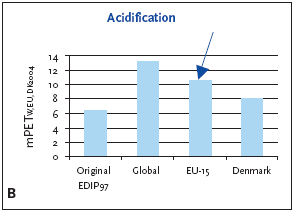
1 Weighting factors have not been established worldwide; the European weighting factors are recommended for impact potentials located outside Europe or at unknown locality 7.3.1 Recommendation for application of normalisation references and weighting factors for acidification For acidification as a regional effect the EU-15 normalisation reference is recommended for impact potentials located in Denmark as well as Europe or the global normalisation reference if the locality is outside Europe or unknown. 7.4 Example of applying normalisation reference and weighting for acidificationBelow an example of applying the normalisation reference and weighting factor for a product (a refrigerator) is presented. Figure 7.1 illustrates the normalised and weighted acidification potential for the product. Figure 7.1 Normalised (A) and weighted (B) acidification potentials for production of a refrigerator at different localities. 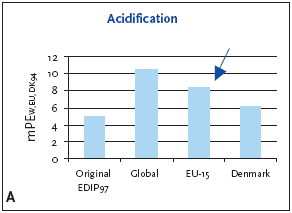 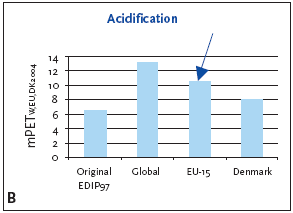
For impact potentials located in Denmark the EU-15 normalisation reference combined with the EU-15 weighting factor for acidification are recommended. Based on an impact potential for the product in question at 0.62 kg SO2-eq./year the actual normalised and weighted values are 8.3 mPEEU94 and 11 mPETEU2004 respectively. As can be deduced from Table 7.1 and seen in Figure 7.1, the normalised result can vary with about 25%, depending on which normalisation references are chosen. In the case of the refrigerator, acidification is more important on the European and global level. This can be explained by the fact that the contribution from the average person is higher in Denmark than in the other regions, but the political weight on the issue is about the same. Please note that a global weighting factor has not been calculated. 7.5 If you would like to know moreBusch, N.J. 2005, Calculation of weighting factors. In Stranddorf, H.K., Hoffmann, L. & Schmidt, A. Update on impact categories, normalisation and weighting in LCA. Environmental Project no. 995, Danish EPA, 2005. EEA 1998a, Europe's Environment:The Second Assessment. Eurostat, European Commission, European Environment Agency. Office for Official Publications of the European Commission, Luxembourg. EEA 1998b,. Europe's Environment: statistical compendium for the Second Assessment. Eurostat, European Commission, European Environment Agency. Office for Official Publications of the European Commission, Luxembourg. Hauschild, M. & Wenzel, H. 1998, Acidification as a criterion in the environmental assessment of products in Environmental assessment of products.Volume 2 Scientific background eds. Hauschild, M. & Wenzel, H. London: Chapman & Hall. Hoffmann, L. 2005. Acidification. In Stranddorf, H.K., Hoffmann, L. & Schmidt, A. Update on impact categories, normalisation and weighting in LCA. Environmental Project no. 995, Danish EPA, 2005. Koch, D. 1998, Air emissions - Annual topic update 1997. Topic Report no.4. European Environment Agency. Ritter, M. 1997, CORINAIR 94 - Summary Report - European Emission Inventory for Air Pollutants. Copenhagen: European Environment Agency. UN-ECE 1979, Convention on Long-range Transboundary Air Pollution. United Nations, Economic Commission for Europe. Available: http://www.unece.org. 8. Nutrient enrichment
The cause of oxygen depletion found in the bottom layers of lakes and coastal waters is nutrient enrichment. Thus, nutrient enrichment can be defined as "an enrichment of the aquatic environment with nutrient salts leading to an increased production of plankton, algae and higher aquatic plants. In time this leads to a reduction in the water quality and in the value of the exploitation, which occurs in the area" (Christensen et al. 1993). The algae sink to the bottom and are broken down consuming oxygen in the bottom layer. If fresh oxygen-rich water from the surface does not reach the bottom layers, the oxygen concentration near the bottom will gradually be reduced until the bottom-dwelling organisms move away or die. The injurious effects of extensive quantities of nutrient salts have been observed regularly in lakes for many years. However, in Denmark the discovery that the bottom of large bodies of water was practically oxygen-free and lifeless in some part of the year came as an unpleasant surprise to many people and triggered serious discussion of nutrient salt emissions and their potential impact on the environment. 8.1 Substances contributing to the impact categoryOne of the two macro-nutrients, nitrogen and phosphorus, is usually the limiting element for the growth of primary producers, and it is therefore reasonable to consider only the elements nitrogen and phosphorus as contributors to nutrient enrichment. In Danish lakes, phosphorus deficiency, or a combination of nitrogen and phosphorus deficiencies, is typically limiting for growth, and their addition promotes algae growth. In Danish coastal waters and seas, nitrogen is often the limiting nutrient. Substances containing nitrogen or phosphorus in a biologically available form are therefore classified as potential contributors to nutrient enrichment. In connection with the 1987 Action Plan on the Aquatic Environment, a Danish nation-wide programme was established to monitor nutrient loading of aquatic areas from point sources, agriculture and the atmosphere to enable the expected reduction in loading to be followed. Most of the nitrogen loading to the aquatic environment is mainly attributable to leaching from the root zone of agricultural land. An important part of the nitrogen loading is related to the use of nitrogen fertilisers and the number of livestock. Apart from the man-made emissions from agriculture an important loading of nitrogen comes from various point sources such as waste water treatment plants, industry, fish farming and from sparsely built- up areas. Most of the phosphorus loading of surface water is attributable to discharges from point sources, especially municipal sewage and industrial effluent. Only a small part of the industrial sector is responsible for the majority of wastewater containing phosphorus. To name just a few important industries the fertiliser industry and other related chemical industries manufacturing products containing phosphorus (e.g. pesticides and detergents), as well as the pulp and paper industry and fish processing industry should be mentioned. However, leaching from agricultural land also plays a significant part. The most important airborne emissions include oxides of NOx that are predominantly emitted from incineration processes, and ammonia, NH3, which is especially emitted from agricultural activities. Since most of the atmosphere consists of free nitrogen, N2, further addition of N2 will not have any effect. N2 is therefore not classified as contributor to nutrient enrichment. 8.2 Nutrient enrichment PotentialIn a tripartite division of environmental impact categories into global, regional and local, nutrient enrichment is regarded as a local as well as a regional impact. 8.2.1 Definition of nutrient enrichment potential The classification step defines nutrient enrichment as the man-made impact on aquatic or terrestrial systems of nitrogen, N, or phosphorus, P. The total nutrient enrichment potential expresses the emissions as an equivalent emission of the reference substance NO3-. The equivalence factor for the total nutrient enrichment equivalent is designated the substance's nutrient enrichment potential. Three equivalence factors are defined for use in the calculation of the potential contributions from a given substance:
From the formula on the average composition of aquatic organisms, it can be seen that the ratio of nitrogen to phosphorus is of the order of 16. If the concentration of bioavailable nitrogen is significantly more than 16 times the concentration of bioavailable phosphorus in an ecosystem, it is thus reasonable to assume that phosphorus is the limiting nutrient and vice versa. 8.3 Normalisation references and weighting factors for nutrient enrichmentThe normalisation references and the weighting factors for nutrient enrichment potential are calculated according to the formula presented in chapter 1, Introduction. The normalisation and weighting factors for nutrient enrichment are presented in Table 8.1. Table 8.1 Normalisation references and weighting factors for nutrient enrichment (Larsen 2005; Busch 2005).
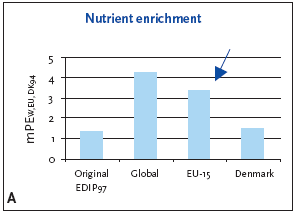
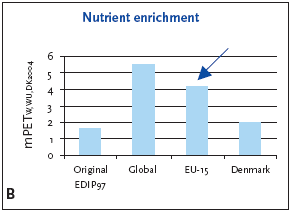
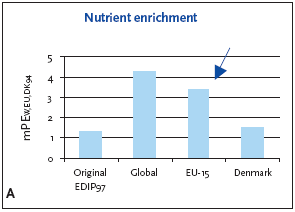
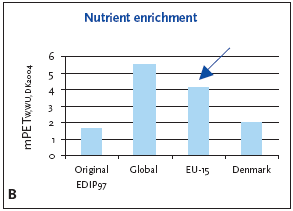
1 Weighting factors have not been established worldwide; the European weighting factors are recommended for impact potentials located outside Europe or at unknown locality 8.3.1 Recommendation for application of normalisation references and weighting factors for nutrient enrichment Nutrient enrichment is considered as both a local and a regional effect. It is recommended to use the EU-15 normalisation reference combined with EU- 15 weighting factor for nutrient enrichment. This recommendation is valid for impact potentials in Denmark as well as in EU-15. For impact potentials located outside Denmark and Europe the global reference is recommended. 8.4 Example of applying normalisation reference and weighting for nutrient enrichmentFigure 8.1 illustrates the normalised and weighted nutrient enrichment potential for the example in Chapter 11. For regional impact potentials like nutrient enrichment, the EU-15 normalisation reference and the EU-15 weighting factor are recommended. Based on an impact potential for the product in question 0.4 kg NO3-eq./year the actual normalised and weighted values are 3.4 mPEEU94 and 4.1 mPETEU2004 respectively. Figure 8.1 Normalised (A) and weighted (B) nutrient enrichment potentials for production of a refrigerator at different localities.
Table 8.1 and Figure 8.1 illustrate that the chosen normalisation reference and weighting factor (for EU-15) put more attention to nutrient enrichment than the Danish values, but on the other hand also put less attention to the issue than the global values. It is therefore recommended to examine whether the impact is important when compared to other impacts, using the Danish or global normalisation references. If so, a more detailed sensitivity analysis can be conducted, investigating the contribution from phosphorous and nitrogen compounds, and if possible distinguishing between point sources and more general contributions. 8.5 If you would like to know moreBusch, N.J. 2005, Calculation of weighting factors. In Stranddorf, H.K., Hoffmann, L. & Schmidt, A. Update on impact categories, normalisation and weighting in LCA. Environmental Project no. 995, Danish EPA, 2005. Christensen, N., Paaby, H., & Holten-Andersen, J. 1993, Environment and society - the state of the environment in Denmark. Professional report no. 93, National Environmental Research Institute. In Danish2 EEA 1998a, Europe's Environment:The Second Assessment. Eurostat, European Commission, European Environment Agency. Office for Official Publications of the European Commission, Luxembourg. EEA 1998b,. Europe's Environment: statistical compendium for the Second Assessment. Eurostat, European Commission, European Environment Agency. Office for Official Publications of the European Commission, Luxembourg. Hauschild, M. & Wenzel, H. 1998c, Nutrient enrichment as a criterion in the environmental assessment of products. In Hauschild M, Wenzel H (eds.). Environmental assessment of products.Volume 2: Scientific background. London: Chapman & Hall. Larsen, J. 2005. Nutrient enrichment. In Stranddorf, H.K., Hoffmann, L. & Schmidt, A. Update on impact categories, normalisation and weighting in LCA. Environmental Project no. 995, Danish EPA, 2005.. Larsen, S.E., Erfurt, J., Græsbøll, C., Kronvang, B., Mortensen, E., Nielsen, C.E., Ovesen, N.B., Paludan, C., Rebsdorf, Aa., Svendsen, L.M. & Nygaard, P. 1995, Ferske vandområder - vandløb og kilder.Vandmiljøplanens overvågnings- program 1994. Danmarks Miljøundersøgelser. Faglig rapport fra DMU, nr. 140. Footnotes2 Most of the reports from the Danish Environmental Protection Agency contain English summaries. 9. Human toxicity
Human toxicity - in LCA context - covers a number of different effects: acute toxicity, irritation/corrosive effects, allergenic effects, irreversible damage/organ damage, genotoxicity, carcinogenic effects, toxicity to reproductive system/teratogenic effects, and neurotoxicity in a single parameter (toxic equivalency factors, EF). The equivalence factors are determined for emission to different compartments: air, water, and soil and exposure via different media: air water, and soil. Human toxicity does not include indoor consumer exposure or work environment. 9.1 Substances contributing to the impact categoryThe substances contributing to human toxicity are numerous and cannot be described by even a finite number of groups. In the calculation of the normalisation references for human toxicity, it has thus been the ambition to find the right order of magnitude. We know that not all activities have been included and therefore the references are expected to be on the low side but they are believed to have the right order of magnitude. The normalisation references for human toxicity include impacts from:
9.2 Human toxicity potentialIn EDIP (Hauschild et al., 1998), the potential human toxicological effects are expressed as critical volume i.e. the volume of a certain media required to absorb a specific emission without resulting in adverse effects. The toxicity potentials are expressed by the following units, referring to the media by which humans are exposed to different substances:
When using this methodology toxic potentials for all kind of substances can be aggregated to a single value i.e. a critical volume of air, water or soil for each component. Toxic equivalence factors (EF) for a number of substances as well as the methodology for calculating EF for other substances can be found in Hauschild et al. (1998). 9.3 Normalisation reference and weighting factor for human toxicityThe normalisation references and weighting factors for human toxicity are calculated according to the general formula in chapter 1, Introduction. Normalisation and weighting factors for human toxicity are presented in Table 9.1. Details on determining normalisation references and weighting factors can be found in Christensen and Hoffmann (2003) and Busch (2003) respectively. Table 9.1 Normalisation references and weighting factors for human toxicity (exposure via air, water and soil) (Christensen & Hoffmann 2003; Busch 2003).
1 Weighting factors have only been established for human toxicity via soil for Europe; the European weighting factor is recommended as default value for impact potentials located in Denmark. 2 Weighting factors have not been established worldwide; the European weighting factors are recommended for impact potentials located outside Europe or at unknown locality. Human toxicity is considered as a local as well as a regional impact. The EU- 15 normalisation references and the weighting factor of EU-15 are in general recommended for impact potentials in Denmark as well as Europe. A possible exception is when the (main) impacts are known to take place in Denmark, e.g. as a result of emissions from specific point sources. In this case, use of Danish normalisation references and weighting factors is recommended. If the location is unknown or outside Europe the global normalisation reference is recommended. It should be noted that the weighting factors for all areas are low, because of lack of specific reduction targets. An international agreement on specific reduction targets or total phase-out of substances like persistent organic pollutants and heavy metals would increase the weighting factor significantly. 9.4 Example of applying normalisation reference and weighting for human toxicityFigure 9.1 - Figure 9.3 illustrate the normalised and weighted human toxicity potentials, using the EU-15 normalisation references combined with the EU- 15 weighting factors as recommended. Based on impact potentials for human toxicity for the product in question the resulting normalised and weighted values are: Human toxicity via air: Human toxicity via water: Human toxicity via soil: Figure 9.1 Normalised (A) and weighted (B) human toxicity potentials, exposure by air for production of a refrigerator at different localities
Figure 9.2 Normalised (A) and weighted (B) human toxicity potentials, exposure by water for production of a refrigerator at different localities.
Figure 9.3 Normalised (A) and weighted (B) human toxicity potential, exposure via soil for production of a refrigerator at different localities.
The figures illustrate that there is a relatively large variation in the toxicity potentials, depending on the chosen normalisation reference. This finding calls for a sensitivity analysis, using other normalisation references and weighting factors, examining the reason for the differences in more detail, and relating them to the environmental conditions on the affected market. Of special interest is perhaps to find a balance between toxicity to air and water, respectively, as the results in these categories point in opposite directions. It should, however, be noticed that the significant decrease in importance in comparison with the original EDIP calculations is due to an increased normalisation factor including the contribution from nmVOC from road transport. This contribution is not included in the calculation of the impact potential. 9.5 If you would like to know moreBusch, N.J. 2005. Calculation of weighting factors. In Stranddorf, H.K., Hoffmann, L. & Schmidt, A. Update on impact categories, normalisation and weighting in LCA. Environmental Project no. 995, Danish EPA, 2005. Christensen, F.M. & Hoffmann, L. 2005. Human toxicity. In Stranddorf, H.K., Hoffmann, L. & Schmidt, A. Update on impact categories, normalisation and weighting in LCA. Environmental Project no. 995, Danish EPA, 2005. EC- TGD 1996, Technical guidance documents in support of commission directive 93/67/EEC on risk assessment for new notified substances and commission regulation (EC) No1488/94 on risk assessment for existing substances (Parts I, II, III and IV). Office for Official Publications of the European Community, Luxembourg. EEA 1998a, Europe's Environment:The Second Assessment. Eurostat, European Commission, European Environment Agency. Office for Official Publications of the European Commission, Luxembourg. EEA 1998b,. Europe's Environment: statistical compendium for the Second Assessment. Eurostat, European Commission, European Environment Agency. Office for Official Publications of the European Commission, Luxembourg. EU 1998, Commission Directive 98/98/EC of 15 December 1998 adapting to technical progress for the 25 time Council Directive 67/548/EEC on the approximation of the laws, regulations and administrative provisions relating to the classification, packaging and labelling of dangerous substances. Available at http://europe.eu.int. Hauschild, M.Z., Olsen, S.I. & Wenzel, H. 1996, Toksicitet for mennesker i miljøet som vurderingskriterium ved miljøvurdering af produkter, i Hauschild, M.Z. (ed.), Baggrund for miljøvurdering af produkter. Miljø- og Energiministeriet, Dansk Industri. København. (in Danish) Hauschild, M.Z., Olsen, S.I. & Wenzel, H. 1998, "Human toxicity as a criterion in the environmental assessment of products", in Environmental assessment of products.Volume 2: Scientific background, eds. Hauschild, M.Z. & Wenzel, H., Chapman & Hall, London. 10. Ecotoxicity
Ecotoxicity - in an LCA context - covers a number of effects as acute and chronic toxicity on different species in soil and water. The fate of the chemical substances (biodegradability, potential bioaccumulation, biodegradability, and distribution between different compartments) is also included in the assessment of the ecotoxicological effects. The fate and effects are aggregated in a single parameter (toxic equivalence factors (EF)). The equivalence factors are determined for emissions to different compartments: air, water, and soil combined with acute and chronic aquatic effects and chronic terrestrial effects. 10.1 Substances contributing to the impact categoryThe substances contributing to ecotoxicity are numerous and cannot be described by even a finite number of groups. In the calculation of the normalisation reference for ecotoxicity, it has thus been the ambition to find the right order of magnitude. It is not possible to include contributions from all activities and the references are therefore expected to be on the low side; but they are believed to have the right order of magnitude. The normalisation references for ecotoxicity include impacts from:
10.2 Ecotoxicity potentialIn EDIP (Hauschild et al. 1998) the potential ecotoxic effects are expressed as critical volume, i.e. the volume of certain media required to absorb a specific emission without resulting in adverse effects. The ecotoxicity potentials are expressed by the following units, referring to the media in which natural organisms are exposed to the different substances:
When using this methodology ecotoxic potentials for all kind of substances can be aggregated to a single value for each effect, i.e. a critical volume. Ecotoxic equivalence factors (EF) for a number of substances as well as the methodology for calculating EF for other substances can be found in Hauschild et al. (1998). 10.3 Normalisation reference and weighting factor for ecotoxicityThe normalisation and weighting factors for ecotoxicity are calculated according to the general formula in chapter 1, Introduction; see Table 10.1 for presentation. Detailed information on the methodology and data sources used in the calculation of normalisation references and weighting factors can be found in Tørsløv (2005) and Busch (2005). Table 10.1 Normalisation references and weighting factors for ecotoxicity (acute aquatic, chronic aquatic and chronic terrestrial) (Tørsløv 2005; Busch 2005).
1 World-wide weighting factors have not been established; the European weighting factors are recommended for impact potentials located outside Europe or at an unknown locality. Ecotoxicity is considered as a local (especially acute ecotoxicity in water) and regional impact and the EU-15 normalisation references and weighting factor are recommended for impact potentials located in Denmark and Europe. If the location is unknown or outside Europe the global normalisation reference is recommended. 10.4 Example of applying normalisation reference and weighting for ecotoxicityFigure 10.1 - Figure 10.2 illustrate the normalised and weighted aquatic ecotoxicity potentials and Figure 10.3 illustrates the normalised and weighted terrestrial ecotoxicity potentials. For impact potentials located in Denmark the EU-15 normalisation reference combined with the EU-15 weighting factor for ecotoxicity are recommended. With the given impact potentials for the product in question, the resulting normalised and weighted values are: acute aquatic ecotoxicity chronic aquatic ecotoxicity chronic terrestrial ecotoxicity Figure 10.1 Normalised (A) and weighted (B) ecotoxicity potential, acute aquatic toxicity for production of a refrigerator at different localities.
Figure 10.2 Normalised (A) and weighted (B) ecotoxicity potential, chronic aquatic toxicity for production of a refrigerator at different localities.
The figures show that the chosen normalisation reference (EU-15) puts Figure 10.3 Normalised (A) and weighted (B) ecotoxicity potential, chronic terrestrial toxicity for production of a refrigerator at different localities.
more attention to acute aquatic toxicity, less to chronic aquatic toxicity and about the same to chronic terrestric ecotoxicity than the Danish normalisation reference. The global normalisation reference is in all three cases higher, but most noteworthy is perhaps the very heterogeneous picture that emerges when comparing the original EDIP values with those obtained by using the new normalisation and weighting factors. The differences may be caused by actual changes in the emissions that are used in calculation of the normalisation references, changes in the political targets in the affected areas, or they may be related to the extrapolation procedure applied in some of the calculations. It is outside the scope of this report to examine the differences in detail, but in practice it is therefore of interest to identify the most important contributions to these impact categories and find out whether there are improvement options that are related to specific concerns on the relevant markets. In other words, the example shows that a sensitivity analysis using different normalisation references can provide additional insight into the examined product system. 10.5 If you would like to know moreBusch, N.J. 2005, Calculation of weighting factors. In Stranddorf, H.K., Hoffmann, L. & Schmidt, A. Update on impact categories, normalisation and weighting in LCA. Environmental Project no. 995, Danish EPA, 2005. Hauschild, M., Wenzel, H., Damborg, A. & Tørsløv, J. 1998, Ecotoxicity as a criterion in the environmental assessment of products in Environmental assessment of products.Volume 2 Scientific background eds. Hauschild. M. & Wenzel. H. London: Chapman & Hall. Tørsløv, J. 2005. Ecotoxicity. In Stranddorf, H.K., Hoffmann, L. & Schmidt, A. Update on impact categories, normalisation and weighting in LCA. Environmental Project no. 995, Danish EPA, 2005. 11. Example: Normalisation and weighting
This chapter presents an example on how to apply normalisation and weighting on the results of a life cycle impact assessment. Normalisation and weighting are performed on the results given as equivalent values, e.g. as GWP (global warming potential) measured in CO2-equivalents. The principles in normalisation and weighting are described in chapter 1, Introduction. Calculation of the normalised impact potential is done as follows:
where: Calculation of the weighted impact potential is done as follows:
where: The example is based on a case from the EDIP97 project (Mose et al., 1997), where the case including inventory data is presented in detail. The functional unit is defined as use of a refrigerator one year (the total lifetime is assumed to be 13 years). The original data are supplemented with arbitrary data for two impact categories to be able to illustrate the consequences of all the established normalisation references and weighting factors. The case presents production of a refrigerator in Denmark. This specific case is chosen as the impact assessment shows results for all the different impact categories except human toxicity via soil and chronic terrestrial ecotoxicity. The example is an old refrigerator containing CFC-11 as well as CFC-12; these ozone depleting substances have afterwards been substituted by other cooling agents. The results of the impact assessment expressed as impacts during the lifetime and per year are shown in Table 11.1. The actual locations of the impact potentials are not known. Obviously, the impacts from most upstream processes are located outside Denmark, while the impact potentials from the use and disposal stages primarily are located in Denmark. However, as the impact categories all contributes on the regional or global scale (no point sources for local impacts are identified in the study), it is chosen to normalise and weight the impact assessment results by using the appropriate EU-15 normalisation and weighting factors for all impact categories except global warming and stratospheric ozone depletion, where the global references are used. The different impact categories are presented and discussed one by one in the following sections. Applying a sensitivity analysis by using other normalisation references is discussed where found appropriate. Table 11.1 Environmental impact potentials related to production of a refrigerator (Mose et al., 1997).
1. These numbers are arbitrary and just used for illustrative purposes. The normalised and weighted impact potentials are shown in Table 11.2. The normalised as well as weighted impact potentials are calculated by using global and EU-15normalisation references and weighting factors, according to the general recommendations:
Table 11.2 Normalised and weighted impact potentials; the primary recommendation for impact potentials in Denmark is indicated by bold types. 11.1 Global warming11.1.1 Normalisation and weighting of global warming The normalisation references as well as the weighting factors are presented in Table 11.3. Table 11.3 Normalisation reference and weighting factors for global warming. Global warming
Global warming is a global effect and therefore a global normalisation reference is recommended.
where: Normalised GWP is the normalised global warming potential for the considered product GWP is the global warming potential for the considered product NormrefGWP is the normalisation reference for global warming Calculation of the weighted impact potential for the considered product is done as follows:
where: Weighted GWP is the weighted impact potential for global warming WFGWP is the weighting factor for global warming The normalisation reference has decreased slightly since 1990 resulting in higher normalised global warming potentials. Figure 11.1 also illustrates the weighted global warming potentials calculated by applying the global, EU-15 and Danish weighting factors. The weighted global warming potentials are decreasing in the above mentioned order. Stronger reduction targets globally than at EU-15 can explain this fact, i.e. Denmark and EU-15 are not far from the reduction target for 2004. 11.1.2 Results Figure 11.1 illustrates the normalised global warming potentials calculated by applying the global normalisation reference. Irrespective of where the impact potential is generated, the global normalisation reference combined with the global weighting factor for global warming are recommended. Based on an impact potential for the product in question at 0.29 ton CO2-eq./year the actual normalised and weighted values are 33 mPEW94 and 37 mPETW2004, respectively. Figure 11.1 Normalised (A) and weighted (B) global warming potentials for production of a refrigerator at different localities.
11.2 Stratospheric ozone depletion11.2.1 Normalisation and weighting of stratospheric ozone depletion Stratospheric ozone depletion is a global effect and therefore a global normalisation reference is recommended. The normalisation reference and weighting factor for stratospheric ozone depletion are presented in Table 11.4. The normalisation reference has been reduced by approximately 50% since 1990 leading to a 100% increase of the normalised ozone depletion potential. The reduction of the normalisation reference can be explained by the fast phase out of consumption of ozone depleting substances. Denmark has decided a total phase-out of ozone depleting substances before 2004, and the weighting factor is therefore "infinite" in principle. In the EU a similar plan is being discussed, but with the current targets the weighting factor can be calculated to 2.46. The global weighting factor has increased from 23 to 63, while the newly developed weighting factor for non-industralised countries is 4.4. Table 11.4 Normalisation reference and weighting factors for stratospheric ozone depletion.
11.2.2 Results Figure 11.2 illustrates the normalised ozone depletion potential calculated by applying the global normalisation reference. Irrespective of where the impact potential is generated, the global normalisation reference combined with the global weighting factor for ozone depletion is recommended. Based on an impact potential for the product in question at 0.046 kg CFC-11-eq./year the actual normalised and weighted values are 448 mPEW94 and 28230 mPETW2004, respectively. Figure 11.2 Normalised and weighted ozone depletion potentials for production of a refrigerator at different localities. 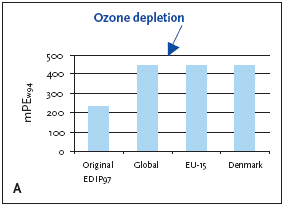 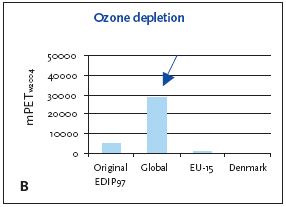
11.3 Photochemical ozone formation11.3.1 Normalisation and weighting of photochemical ozone formation For photochemical ozone formation as a regional effect the EU-15 normalisation reference is recommended for impact potentials located in Denmark as well as Europe or the global normalisation reference if the locality is outside Europe or unknown. The normalisation references and weighting factors for photochemical ozone formation are presented in Table 11.5. Table 11.5 Normalisation references and weighting factors for photochemical ozone formation.
The highest normalisation reference is calculated for EU-15 giving the lowest normalised potential for impact potentials located in Denmark or in Europe. If the impact potentials were located outside Europe or at an unknown location, the normalised impact potential would be slightly higher, about 10%, but this would to some extent be balanced by a lower weighting factor. 11.3.2 Results Figure 11.3 illustrates the normalised photochemical ozone formation potential. For impact potentials located in Denmark the EU-15 normalisation reference combined with the EU-15 weighting factor for photochemical ozone formation are recommended. Based on an impact potential for the product in question at 0.0046 kg C2H4-eq./year the actual normalised and weighted values are 0.18 mPEEU94 and 0.25 mPETEU2004 , respectively. The chosen normalisation reference puts less attention to photochemical ozone formation than if e.g. the global reference was applied. The difference is however small, about 10-15%, and the practical consequences are probably without importance. Figure 11.3 Normalised and weighted photochemical ozone formation potentials for production of a refrigerator at different localities.
11.4 Acidification11.4.1 Normalisation and weighting of acidification For acidification as a regional effect the EU-15 normalisation reference and weighting factor are recommended for impact potentials located in Denmark as well as Europe or the global normalisation reference if the locality is outside Europe or unknown. The normalisation references and weighting factors for acidification are presented in Table 11.6. Table 11.6 Normalisation references and weighting factors for acidification. Acidification
1 Weighting factors have not been established worldwide; the European weighting factors are recommended for impact potentials located outside Europe or at unknown locality The normalisation reference for Denmark has decreased with about 20% since 1990 resulting in an increase of the normalised acidification potential. The EU-15 normalisation reference is between the global and the Danish normalisation reference. 11.4.2 Results Figure 11.4 illustrates the normalised and weighted acidification potential. For impact potentials located in Denmark the EU-15 normalisation reference combined with the EU-15 weighting factor for acidification are recommended. Based on an impact potential for the product in question at 0.62 kg SO2-eq./year the actual normalised and weighted values are 8.3 mPEEU94 and 11 mPETEU2004, respectively. Figure 11.4 Normalised and weighted acidification potentials for production of a refrigerator at different localities.
As can be deduced from Table 11.6 and seen in Figure 11.4, the normalised result can vary with about 40%, depending on which normalisation reference is chosen. In the case of the refrigerator, acidification is more important using the European and global reference. This can be explained by the fact that the contribution from the average person is higher in Denmark than in the other regions, but the political weight on the issue is about the same. 11.5 Nutrient enrichment11.5.1 Normalisation and weighting of nutrient enrichment Nutrient enrichment is regarded as a local as well as a regional impact. The EU-15 normalisation reference is recommended for impact potentials located in Denmark and in Europe. For impact potentials located outside Denmark and Europe the global reference is recommended. The normalisation and weighting factors for nutrient enrichment are presented in Table 11.7. Table 11.7 Normalisation references and weighting factors for nutrient enrichment. Nutrient enrichment
1 Weighting factors have not been established worldwide; the European weighting factors are recommended for impact potentials located outside Europe or at unknown locality The Danish normalisation reference for nutrient enrichment has decreased slightly since 1990 giving an increase in the normalised potential. The EU-15 normalisation reference is less than half of the Danish reference probably due to significant differences in area distribution between land and water surface. Due to the applied extrapolation methodology the global reference is below the EU-15 reference giving a higher normalised nutrient enrichment potential for impact potentials located outside Europe or with unknown locality. 11.5.2 Results Figure 11.5 illustrates the normalised and weighted nutrient enrichment potential for the product. For a regional impact category like nutrient enrichment, the EU-15 normalisation reference and weighting factor are recommended. Based on an impact potential for the product in question 0.4 kg NO3-eq./year the actual normalised and weighted values are 3.4 mPEEU94 and 4.1 mPETEU2004, respectively. Figure 11.5 Normalised (A) and weighted (B) nutrient enrichment potentials for production of a refrigerator at different localities.
Table 11.7 and Figure 11.5 illustrate that the chosen normalisation reference and weighting factor (for EU-15) put more attention to nutrient enrichment than the Danish values, but on the other hand also put less attention to the issue than the global values. It is therefore recommended to examine whether the impact is important when compared to other impacts, using the Danish or global normalisation references. If so, a more detailed sensitivity analysis can be conducted, investigating the contribution from phosphorous and nitrogen compounds, and if possible, distinguishing between point sources and more general contributions. 11.6 Human toxicity11.6.1 Normalisation and weighting of human toxicity Human toxicity is considered as a local as well as a regional impact and the EU-15 normalisation reference and weighting factors are recommended for impact potentials located in both Denmark and Europe. If the location is unknown or outside Europe the global normalisation reference is recommended. The normalisation and weighting factors for human toxicity are presented in Table 11.8. Table 11.8 Normalisation references and weighting factors for human toxicity (exposure via air, water and soil).
1 Weighting factors have not been established world-wide; the EU weighting factors are recommended for impact potentials located outside Europe or at unknown locality. 2 Weighting factors have only been established for human toxicity via soil for Europe; the European weighting factor is recommended as default value for impact potentials located in Denmark. The Danish normalisation reference for human toxicity via air is lower than the EU-15 reference. The consequence is that normalising the toxicity potential with Denmark as reference results in a higher normalised potential than when using the EU-15 reference. For human toxicity via water and soil the highest normalisation reference is found for Danish conditions. The figures show the highest normalised potentials for impact potentials located outside Europe. 11.6.2 Results Figure 11.6 - Figure 11.8 illustrate the normalised and weighted human toxicity potentials. For a regional/local impact category like human toxicity, the EU-15 normalisation references and the EU-15 weighting factors are recommended. Based on impact potentials for human toxicity for the product in question the normalised and weighted impact potentials can be calculated for different media: via air: via water: Figure 11.6 Normalised (A) and weighted (B) human toxicity potentials, exposure by air for production of a refrigerator at different localities.
Figure 11.7 Normalised (A) and weighted (B) human toxicity potentials, exposure by water for production of a refrigerator at different localities.
Figure 11.8 Normalised (A) and weighted (B) human toxicity potential, exposure via soil for production of a refrigerator at different localities.
via soil: The figures illustrate that there is a large variation in the toxicity potentials, depending on the chosen normalisation reference. This finding calls for a more detailed sensitivity analysis examining the reason for the differences in more detail, e.g. by applying Danish normalisation references and weighting factors. Of special interest is to find a balance between toxicity to air and water, respectively, as the results in these categories point in opposite directions. It should be noticed that the significant decrease in normalised and weighted values is due to nmVOC from road transport being include in the new normalisation reference, but not in the calculation of the impact potential of the refrigerator. 11.7 EcotoxicityNormalisation and weighting of ecotoxicity Ecotoxicity is considered as a local (especially acute ecotoxicity to water) as well as a regional impact and the EU-15 normalisation reference and weighting factors are recommended for impact potentials located in both Denmark and Europe. If the location is unknown or outside Europe the global normalisation reference is recommended. The normalisation and weighting factors for ecotoxicity are presented in Table 11.9. Table 11.9 Normalisation references and weighting factors for ecotoxicity (acute aquatic, chronic aquatic and chronic terrestrial).
1 Weighting factors have not been established world-wide; the EU-15 weighting factors are recommended for impact potentials located outside Europe or at an unknown locality. For aquatic ecotoxicity the highest normalisation reference is found for Danish conditions. The figures show the highest normalised potentials for impact potentials located outside Europe. For terrestrial ecotoxicity the highest normalisation reference is found for Europe and the lowest reference for Denmark. 11.7.2 Results Figure 11.9 -Figure 11.10 illustrate the normalised and weighted aquatic ecotoxicity potentials and Figure 11.11 illustrates the normalised and weighted terrestrial ecotoxicity potentials. For impact potentials located in Denmark the EU-15 normalisation reference combined with the EU-15 weighting factor for ecotoxicity are recommended. With the given impact potentials for the product in question, the resulting normalised and weighted values are: acute aquatic chronic aquatic chronic terrestrial Figure 11.9 Normalised (A) and weighted (B) ecotoxicity potential, acute aquatic toxicity for production of a refrigerator at different localities.
Figure 11.10 Normalised (A) and weighted (B) ecotoxicity potential, chronic aquatic toxicity for production of a refrigerator at different localities.
Figure 11.11 Normalised (A) and weighted (B) ecotoxicity potential, chronic terrestrial toxicity for production of a refrigerator at different localities. 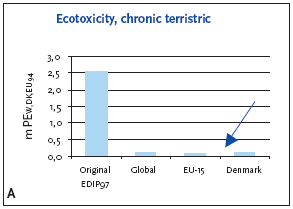 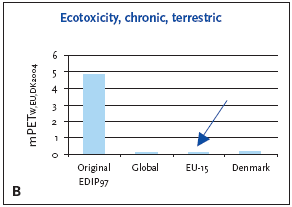
The figures show that the chosen normalisation reference (EU-15) puts more attention to acute and chronic toxicity than the Danish normalisation reference, but less than the global normalisation reference does. It is therefore of interest to identify the most important contributions to these impact categories and find out whether there are improvement options that are related to specific concerns on the relevant markets. In other words, the example shows that a sensitivity analysis using different normalisation references can provide additional insight into the examined product system. 11.8 General conclusionsThe primary purpose of the example is to show the LCA-practitioner the recommended choices of normalisation references and weighting factors in a specific case. At the same time, the example shows what the outcome would have been if other choices had been made. In this way the extended methodology can be seen as a binding element between the final steps in the impact assessment and important steps in the interpretation of the LCA, e.g. in the form of a sensitivity analysis. It is however stressed that it is not compulsory to neither use the extended possibilities, nor that it should be the first step in the interpretation. It is outside the scope of this report to discuss the findings in the example in detail, but it is obvious that the increased number of possibilities for choosing can provide a more balanced view of the life cycle impacts in the life cycle of a product. At the same time, however, the increased amount of information can also cause additional questions to be asked. Exactly which questions that will emerge cannot be determined at this moment, but it is a general recommendation that they should concentrate on those issues where significant changes are observed. In the specific case this would for example be to determine whether nutrient enrichment would be one of the important impact categories if the Danish or Global normalisation references were applied instead of the EU-15 reference. The first effort would be to look at the worst-case scenario for nutrient enrichment and compare the normalised/weighted result with that for the other impact categories. If the impact from nutrient enrichment is low in this comparison, the LCA- practitioner will know that it is a robust finding and that only little attention should be devoted to the impact category in the interpretation of the results. The improved possibilities for normalisation and weighting have not been utilised in "real" LCA so far. LCA-practitioners will most probably quickly find a way to use the possibilities, e.g. as a part of the sensitivity analysis. The efforts needed in doing so will decrease significantly when the first experiences have been gained.
|
|||||||||||||||||||||||||||||||||||||||||||||||||||||||||||||||||||||||||||||||||||||||||||||||||||||||||||||||||||||||||||||||||||||||||||||||||||||||||||||||||||||||||||||||||||||||||||||||||||||||||||||||||||||||||||||||||||||||||||||||||||||||||||||||||||||||||||||||||||||||||||||||||||||||||||||||||||||||||||||||||||||||||||||||||||||||||||||||||||||||||||||||||||||||||||||||||||||||||||||||||||||||||||||||||||||||||||||||||||||||||||||||||||||||||||||||||||||||||||||||||||||||||||||||||||||||||||||||||||||||||||||||||||||||||||||||||||||||||||||||||||||||||||||||||||||||||||||||||||||||||||||||||||||||||||||
