|
Environmental Shareholder Value 6 Introduction to Shareholder Value6.1 Calculation of Shareholder Value Shareholder Value was originally introduced by A. Rappaport in 1986. The philosophy behind Shareholder Value is simple - it deals with maximising the long-term returns to the shareholders of the company. Returns to shareholders correspond to the development in the market value of the company (stock-exchange price) and the regular dividends paid. Therefore, the company's management must primarily make decisions that create the greatest possible value for shareholders - ie. Shareholder Value. Traditionally, companies have defined their strategic goals as, for example, growth in revenue and accounting profit. Key figures for their success would be accounting key figures such as earnings per share. The problem with this approach is that growth in revenue and profits show accounting values, but not necessarily economic values. From an economic perspective, the income statement is not a complete picture of the actual operating value the company is adding or the value the company will add in the future. Therefore there is a need for other key figures to illustrate Shareholder Value. 6.1 Calculation of Shareholder ValueRappaport uses future free cash flow in his model as a figure for Shareholder Value. The model examines the specific plans and investments arising from the company's strategy and the cash flows in and out of the company these will imply in the future. The balance between cash flows in and out of the company is termed "free cash flow". The total of all future cash flows leads to the total value of the company (Blumberg et al., 1996). Overall the calculation looks like this: Shareholder Value = Value of company (Corporate Value) - debt Where the value of the company according to A. Rappaport's model (1986) is calculated as follows: Corporate value = Capital value of the free cash flow in the budget period + Capital value of the free cash flow after the budget period + Market value of non-operating assets at the start of the budget period The Corporate Value is dependent upon the following seven Value Drivers:
According to the Shareholder Value philosophy, management will choose between alternative strategies in order to maximise the free cash flow and thus the capital value of the cash flow which can be transferred to investors (Elling et al., 1998). There are several methods of calculation stemming from the Shareholder Value philosophy. Therefore, there is no single figure that unequivocally shows the Shareholder Value of a company, but the philosophy is basically the same with focus on free cash flow and an assessment of the future opportunities to increase investors' returns. The following sections 6.2-6.4 describe selected key figures for Shareholder Value, and these will be analysed in relation to environmental conditions in chapter 13. The analysis have been completed in relation to these key figures as these figures are typically those investors and financial analysts have access to and examine in company reports. 6.2 Economic Profit (EP)Economic Profit (EP) [2] is one of the methods which in recent years have become more widespread for management of Shareholder Value. EP shows the financial added value created by a company in a single year. If EP is positive, financial value has been added, while a negative EP means value has been lost (Madsen & Barslev, 2002). EP is composed of three main components:
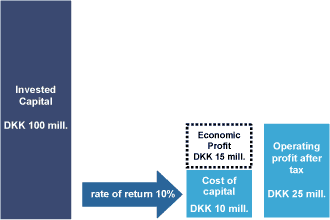
Economic Profit is calculated using the following formula: For example, assume that a company has a net profit after tax (NOPAT) of DKK 25 million. Is a NOPAT of DKK 25 million good or bad? This depends on the amount of capital invested and the return required by investors. If, as in example A, investors have a required rate of return of 10 per cent, and they have invested DKK 100 million, then there is a cost of capital of DKK 10 million. When the cost of capital is deducted from the operating result of DKK 25 million, the economic value added is DKK 15 million. Thus the company has been able to make a higher rate of return on the capital than the rate required by the investors (Madsen & Barslev, 2002). Example A: Positive Economic Profit (Madsen & Barslev, 2002)
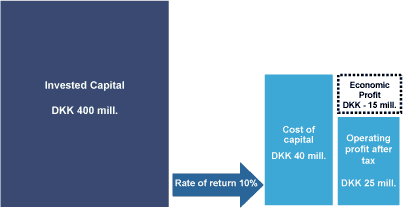
Alternatively, if investors invest DKK 400 million with the same required return, the economic value added will be - DKK 15 million. Thus, the company does not meet the return required by investors. Example B: Negative Economic Profit
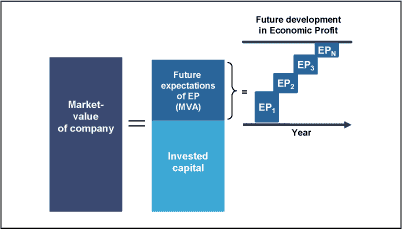
Therefore, EP is a good measure of whether the company is living up to investors' required rate of return, which is crucial for Shareholder Value, measured as dividends and the market value of shares. Expectations for the future EP of a company are reflected in the market value of the company. The present value of all the future Economic Profits is also called the Market Value Added (MVA). In theory, the market value of a company is the present value of all the future Economic Profits - or MVA - plus the capital the company has invested. This relationship is illustrated in the figure below:
Figure 3: Relationship between the market value of a company and the future Economic Profit (Madsen & Barslev, 2002). Management to maximise future Economic Profits is therefore management to maximise market value. EP is improved when:
6.3 ROCEROCE stands for Return On Capital Employed. ROCE is calculated as the profit before financial items divided by the average capital employed, and it is expressed as a percentage. Average capital employed is total liabilities less non-interest bearing liabilities.
Unlike Economic Profit, ROCE cannot show whether a company is adding or loosing value for its investors. Despite this, it remains an important key figure, because it is an expression of whether the company is developing efficiently. If the company becomes more efficient, ROCE will increase. For example, operating efficiency can indicate whether or not an excessive amount of money is tied up in stock. 6.4 Profit margin before depreciation - EBITDA%EBITDA stands for Earnings Before Interest, Taxes, Depreciation and Amortisation. When EBITDA is compared with net revenue, the resulting profit margin before depreciation is also called the EBITDA%. The operating profit margin is one of the seven Value Drivers in Rappapport's Shareholder Value concept, and it is also one of the key figures in the assessment of Shareholder Value. The EBITDA% is calculated as the profit before financial items and depreciation divided by the net revenue, and it is expressed as a percentage.
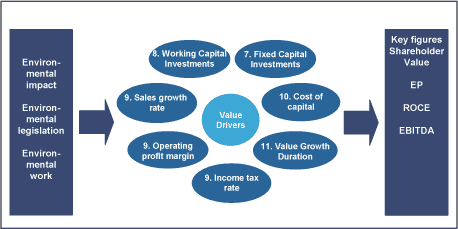
In everyday language, the EBITDA% can be expressed as: how much do I earn on each monetary unit of sales? 6.5 Relationship between the environment and Shareholder ValueShareholder Value is a good concept relating to the environment because it takes a forward-looking accounting view contrary to backward-looking accounting, which is the traditional view (Schaltegger & Figge, 2000). This harmonises with the company's environmental work where the effect is not usually seen until well beyond the accounting year. Traditionally, the environment has only been regarded as a cost imposed on the company through legislation and requirements of different interest groups. However, this report will illustrate that environmental work results in both costs, savings and income and must therefore be controlled as any other financial activity of the company. This requires an understanding of how the environment affects Value Drivers and key figures in order for management to have a decision-making basis. The following chapters describe the interplay between the environment and the seven Value Drivers and the key figures for Shareholder Value.
Figure 4: Overview of the analysis of the interplay between environment, Value Drivers and key figures The figures shown next to each Value Driver refer to the subsequent chapters. Footnotes[2] EP is also known as Economic Value Added, EVATM, and this is a trademark of Stern Stewart & Co.
|


