|
| Front page | | Contents | | Back | | Printing instructions |
Colorants in transferable picture tattoos for the skin

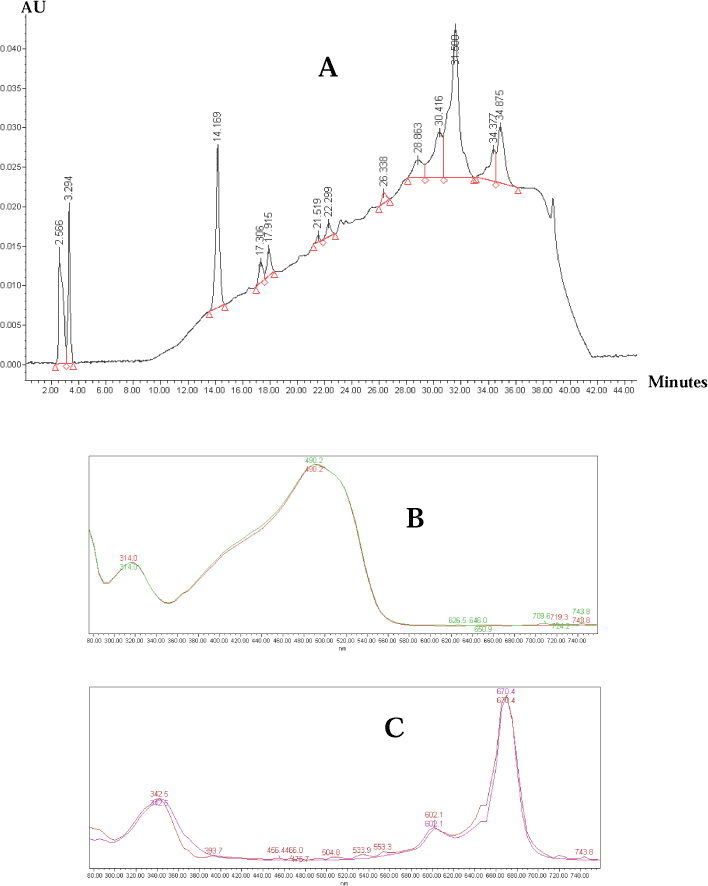
Figure 3: Identification of colorants in THF extract of sample no. 226-2. A: HPLC chromatogram, B: spectrum of 14,169 min chromatographic peak with the spectrum of CI 15850, C: spectrum of 21,519 min chromatographic peak with the spectrum of CI 74180.
| Front page | | Contents | | Back | | Printing instructions |
Version 1.0 August 2005, © Danish Environmental Protection Agency
|