|
| Front page | | Contents | | Previous | | Next |
Mapping and development of alternatives to chlorinated lubricants in the metal industry (KLORPARAFRI)
6 Technical assessment of non-chlorinated lubricants
6.1 Introduction
The objective of chapter 6 is to describe the methods and results of the testing of proposed lubricants in technical tests and in production at Danfoss A/S, in addition to a discussion of the test results.
6.2 Test methods
Below is a description of the test methods used to evaluate the technical performance of the proposed lubricants for heavy-duty metal forming, which passed step 1of the technical selection sequence
described in chapter 3. A description of the used reference lubricants is also enclosed.
Simulative test:
In previous projects involving the Technical University of Denmark as a co-worker, several qualified test methods to evaluate the performance of lubrication were identified. Figure 6.1 shows different
simulative tests (A-H) to be used for characterization and scaling of the performance of a lubricant. The most critical partial processes are: B) ”bend under tension” and H) ”strip reduction”. Strip reduction is
mainly a cold forging operation, but is part of the deep drawing process. H) ”strip reduction” is chosen as the simulative test method.
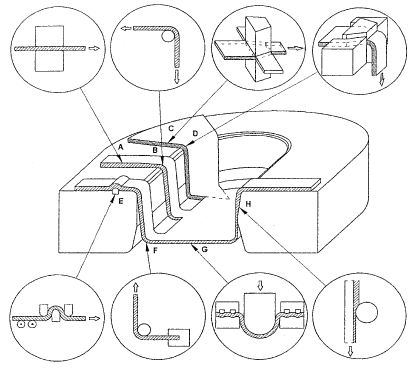
Figure 6.1 Simulative technical test: Identified partial processes.
The equipment for strip reduction is shown in figure 6.2. Strip reduction is carried out by pressing a tool with a polished surface (Ra = 0,01 mm) into a sheet material (strip) to a certain depth. The strip is
pulled, while the tool is being pressed into it, and the thickness of the strip is being reduced. The cylindrical tool is not rotating during the reduction. In table 6.1, the most important test parameters are
summarized.
Table 6.1 Parameters for strip reduction
| Tool material |
ASP23 |
| Specimen material |
W.no. 1.4401 |
| Dimension of specimen |
Length: 500 mm
Width: 15 mm
Thickness: 1,25 mm
|
| Process speed |
80 mm pr. second |
| Travel length |
0-300 mm |
|
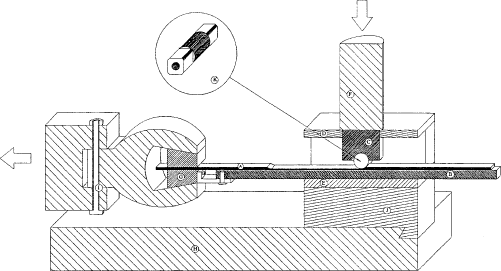
Figure 6.2 Set-up for strip reduction. (A) Strip, (B) Hardened steel rod, (C) Pressing block, (D) Distance sheet, (F) Vertical piston, (G) Horizontal piston with claw, (K) Tools
When the lubricant is breaking down in strip reduction, the strip and tool will cold weld, and the soft material from the strip is welded to the hardened tool. This material causes severe scratches in the strip
parallel to the pull direction. Few scratches can occur even with a good lubricant, but if the performance of the lubricant is not satisfactory under the specific test conditions, these scratches are developed
due to a rise in temperature. The rise in temperature will breakdown the lubricant further, and the scratches will develop to a larger band on the strip.
Figure 6.3 shows strips reduced in strip reduction. On the top of the figure a good lubricant is used and in the bottom, a bad lubricant is used. In the bottom of the figure is seen that the scratches develop into
to a wide band (marked with the grey area). The band formation is defined as the position from the start of the reduction (left side in figure 6.3) to the position where the individual scratches cannot be
separated under a stereo microscope.
The performance in strip reduction of different lubricants are determined by comparing the results of a well known bad lubricant (pure mineral oil) and a good lubricant (chlorinated paraffin). The lubricants
are scaled according to performance in the individual tests.

Figure 6.3 Strips reduced in strip reduction from left to right. In the top is seen some scratches in the strip. In the bottom the scratches have developed to a wide band (marked with a grey area)
Process technical test:
A deep drawing test is carried out with the selected lubricants using a press and tool. This test includes severe process parameters. The test, which is called backwards can extrusion, is carried out. A can is
created by pressing a blank over a punch. This process is illustrated in figure 6.4.
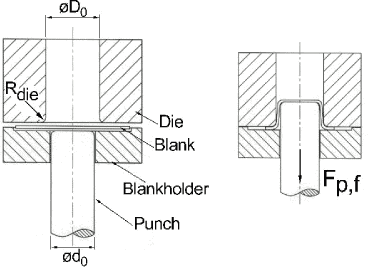
Figure 6.4 Backwards can extrusion. To the left is shown a situation before forming and to the right is shown the forming operation with the die pressing the blank over the punch.
The ratio between the diameter of the punch and the blank is called the draw ratio and the larger the draw ratio the more stressing for the lubricant. The most important parameters for the tests are shown in
table 6.2.
Table 6.2 Parameters for backward can extrusion.
| Tool material |
ASP23 |
| Specimen material |
W.no. 1.4401 |
| Dimension of work piece |
Diameter: 90 or 100 mm
Thickness: 2 mm
|
| RadiusRundingsradius ( matrice/punch ) |
6 mm / 6 mm |
| Pressing speed |
40 mm pr. second |
| Draw ratio |
1,8 or 2,0 |
During the entire operation (forming and following separation of the tool and can) the affecting power is collected to computer. In this forming operation, lubricant breakdown between the outer of the can
and the die will occur often, whereas it will occur more seldom between the inner side of the can and the punch. The collected powers are:
| Fp,f |
Forming force due to plastic deformation of the blank. Limited sensitivity to lubricant breakdown, as changes in friction do not influence the forming force. |
| Fd,w |
Withdrawal power between can and die after forming. Very sensitive to lubricant breakdown, due to critical tribological conditions. |
| Fp,w |
Withdrawal force between can and punch after forming. Secondary parameter, due to critical tribological conditions. |
| Fd,ej |
Ejection force. Often is the can located on the punch after forming but if the friction is very large, the work piece can be locked in the die when the die is withdrawn. The ejection power is the force removing the can from the die. |
During normal process conditions, the can will often stay on the punch after forming, but in case of severe lubricant breakdown, the can may be dragged off the punch when the die is withdrawn. In this case,
the force measurement Fd,w (withdrawal force between can and die after forming) will actually be measured as Fp,w (withdrawal force between can and punch after forming). In these cases the Fd,ej
(ejection force between can and die) is the sensitive force measurement. When dry film lubricants are used, it is observed that the can is often located in the die after forming, which is probably due to a liquid
viscose lubricant causing the can to be sucked on the punch.
To evaluate the development of the involved forces and the development of lubricant breakdown, a number of cans (more than 3) are formed. Scaling of the performance for the tested lubricants will primarily be based on the mentioned force measurements, and secondary (if needed) on a visual inspection of the cans.
Full scale production test:
In this project, the lubricants showing the best performances in the simulative and the technical test are tested in full scale production at Danfoss A/S (Nordborg, Denmark). In the production test, the
lubricants are tested in a multi stage tool forming a work piece as shown in figure 6.5. The work piece is produced in seven process steps, including deep drawing, extrusion and punching without any
annealing of the work piece between each step.
As seen to the right in figure 6.5, the middle hole is flanged, which causes a reduction of the thickness of the sheet. Danfoss A/S has identified this flanging as the most critical process in the production of the
shown flange, because the rim is torn off the work piece if lubricant breakdown occurs.
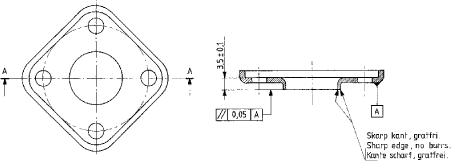
Figure 6.5 Flange of stainless steel (W. no. 1.4301) produced by Danfoss A/S using of lubricants containing chlorinated compounds. Shown in real size.
During the flanging process, the thickness of the sheet is reduced approximately 50%.
Scaling of the efficiency of the lubricants is based on number of produced work pieces at a given production speed before a lubricant breakdown occurs.
Reference lubricants:
For the simulative test is chosen a well known bad lubricant, a pure mineral oil mixture without any additives. The mixture contains 50 wt% Sunoco Sun 60N (low viscosity naphthenic mineral oil) and 50
wt% Houghton Plunger CR5 (high viscosity paraffinic mineral oil). A viscosity of 60 cSt at 40°C (8 cSt at 100°C) is obtained from this mixture. The lubricating properties of this mineral oil mixture is only due
to a physical separation of tool and work piece and removal of heat from the deformation zone.
For both the simulative and the process technical tests is chosen a well known good lubricant, Castrol Iloform TDN 81 containing 80% of a medium-chained chloroparaffin with a chlorination degree of
50%.
In the full scale production test at Danfoss A/S, a chlorinated lubricant (Holifa HFF 13) is chosen as reference. This lubricant is usually used in the production at Danfoss A/S. Holifa HFF 13 contains a
medium-chained chloroparaffin with an average degree of chlorination of 20%.
Table 6.3 Reference lubricants.
| Product |
Chain length |
Degree of chlorination |
Viscosity |
| |
|
|
40°C |
100°C |
| Sunoco Sun 60N |
unknown |
- |
10 cSt |
3 cSt |
| Houghton Plunger CR5 |
unknown |
- |
660 cSt |
35 cSt |
| Castrol Iloform TDN 81 |
C14-17 |
40% |
161 cSt |
11 cSt |
| Holifa HFF 13 |
C14-17 |
20% |
75 cSt |
- |
6.3 Test results
Simulative test:
As mentioned in section 6.1, simulative test, the performance of a lubricant can be evaluated in the simulative test ”strip reduction” by comparing the result with the results of a bad and a good lubricant. In
this test, the performance of the lubricant is evaluated from two visual criteria, namely the distance to lubricant breakdown (band formation) from the beginning of the reduction and the amount of scratches at
the end of the reduction (sliding length = 300 mm).
In strip reduction, a reduction of 45% (a strip is reduced 45% in thickness) is the limit for the chosen test materials and this is only obtained when applying the best lubricants. As a starting point, the
lubricants are tested with 30% reduction, because this reduction is large enough to reject some lubricants to further testing. In strip reduction, each lubricant was tested three times, except lubricant no. 12, 39
and 40. The performance of these particular lubricants was so bad that a repetition was not advisable.
For the simulative test, all results are presented as an average of the three measurements for each lubricant with a standard deviation incorporated. Figure 6.6 shows the distance (in mm) from the start of the
reduction until band formation is visually observed in the stereo microscope for the reference lubricants (MO - mineral oil mixture, CP1 - Castrol Iloform TDN 81 and CP2 - Holifa HFF 13) and the tested
lubricants. On the figure, the top limit is 300 mm (sliding length = 300 mm), which is the assigned value, if reduction has occurred without band formation.
From the first three columns in figure 6.6 (the reference lubricants) it is seen that the mineral oil mixture (well-known bad lubricant) breaks down after a reduction length of 169±57 mm, and the two
chlorinated lubricants (well-known good lubricants) can be reduced in the entire length (300 mm) without band formation.
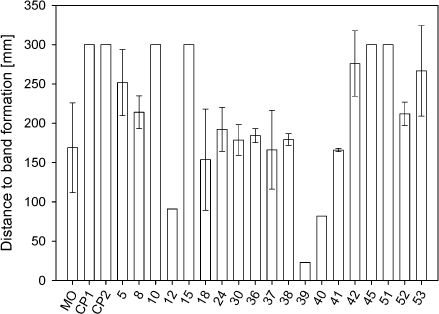
Figure 6.6 Distance to band formation of the tested lubricants at 30%'s reduction.
It is seen from figure 6.6 that lubricant numbers 10, 15, 45 and 51 can be reduced in the entire length (300 mm) without band formation, whereas the remaining lubricants break down between 140 to 276
mm. Lubricants only tested once (lubricant numbers 12, 39 and 40) all break down and create band before 100 mm sliding.
From appendix 1 it is seen that lubricant numbers 42 and 53 only create band in one of the three measurement, but since band formation is due to a severe lubricant breakdown, these two lubricants were
not chosen for further tests in the project. Lubricant numbers 10, 15, 45 and 51 are the only lubricants, which were identified by the strip reduction test as having good enough performance to continue testing
in the project.
A visual evaluation of the amount of scratches after reduction is only possible for lubricants, which have not created band during the test. Figure 6.7 shows the result of the counted scratches after 300 mm's
reduction for the tested lubricants.
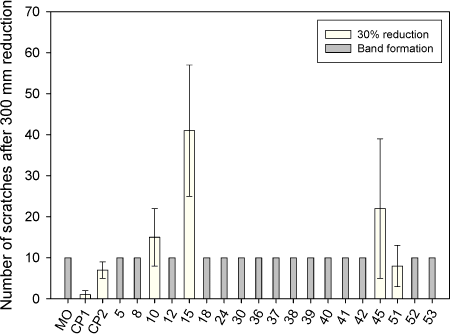
Figure 6.7 Result of the simulative test: Number of scratches after 300 mm's reduction of 30%.
From figure 6.7 it is seen that after 300 mm's reduction, only few scratches were observed on strips reduced with CP1 (Castrol TDN81) compared to the strips reduced with CP2 (Holifa HFF13). The
fewer scratches are probably due to the higher degree of chlorination of the CP1 chlorinated compound (see table 6.3, section 6.2). The figure clearly shows that the number of scratches in the tested
lubricants, which do not create band is quite large (8 to 41 in average). Figure 6.7 also shows that the performance under the specified test conditions is good for lubricant number 10 and especially lubricant
number 51 compared to the two chlorinated lubricants.
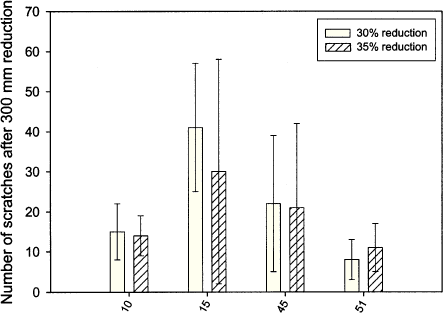
Figure 6.8 Result of the simulative test: Number of scratches after 300 mm reduction (30 and 35 %) for lubricant numbers 10, 15, 45 and 51.
To further separate, and thereby scale, the performance of the four lubricants, which did not create band at 30 %'s reduction, two additional measurements were carried out in strip reduction with each of the
four lubricants at 35 %'s reduction. Even at 35 %'s reduction, none of the four tested lubricants created band. The results from counting number of scratches after 300 mm's reduction are shown in figure 6.8.
From the figure it is seen that the amount of scratches reduces at increased level of reduction for lubricant number 10, 15 and 45 and increases a bit for lubricant number 51. It is not expected that the amount
of scratches are falling at 35% reduction compared to 30% reduction, since an increased reduction should cause more critical condition for the lubricant and thereby more locally lubricant breakdown
(increased amount of scratches). The test result may be due to statistical uncertainty in the reductions. Another explanation could be that in case of very good EP additives, in the lubricants, a change
(increase) in pressure and temperature may cause an increased activity of the EP additive, and consequently – an improved performance of the lubricant.
A further increase of the reduction to e.g. 40 % in order to improve scaling of the performance of these four lubricants is not advisable, since other conditions may interfere with the results when approaching
the technical limit (45% reduction).
The performance of lubricant numbers 10, 15, 45 and 51 is far better than the other tested lubricants. The performance of these four lubricants under the chosen test conditions is quite good, not better,
however, compared to the two chlorinated reference lubricants. The performance of lubricant number 10 and 51 is slightly better than lubricant number 15 and 45.
Process technical test:
From the experiments carried out in the simulative test it was decided that lubricant numbers 10, 15, 45 and 51 were to be tested in the process technical test ”backwards can extrusion” where a deep
drawing is carried out.
It was decided to test the lubricants with a draw ratio of 1.8 and 2.0. From section 6.2 other process parameters can be found. It was decided to form ten cans in the testing of each of the four lubricants.
In a previous investigation, lubricant number 15 has shown quite good performance in backwards can extrusion. Therefore, it was decided not to test this lubricant with a draw ratio of 1.8.
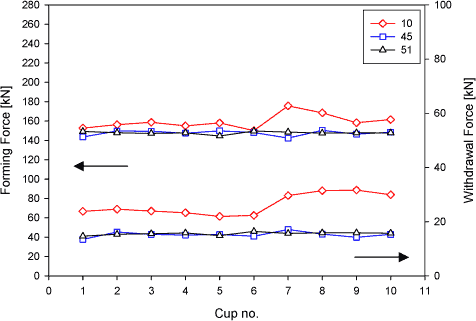
Figure 6.9 Result of the process technical test
The upper graphs in figure 6.9 shows the development of the forming force for lubricant numbers 10, 45 and 51, and the lower graphs show the development of the withdrawal force at a draw ratio of 1.8 in
backwards can extrusion (see section 6.2 for a description of the mentioned forces).
The forming force for the three tested lubricants at this draw ratio (1.8) starts at the same level (about 150 kN). However, when more cans are drawn, the forming force for lubricant number 10 is seen to
increase up to about 180 kN. at can number seven. The forming force for the other two lubricants (numbers 45 and 51) does not increase within the number of drawn cans.
The withdrawal force (lower graphs in figure 6.9) shows the same tendency in force development, also here, an increase in force is observed for lubricant number 10, but not for lubricant numbers 45 and
51. The lubricant film breaks down for lubricant number 4 at the seventh drawn can. The maximum number of cans, which can be drawn at a draw ration of 1.8, is six for lubricant number 10. Lubricant
numbers 45 and 51 can draw all 10 cans without any lubricant film breakdown at this draw ratio.
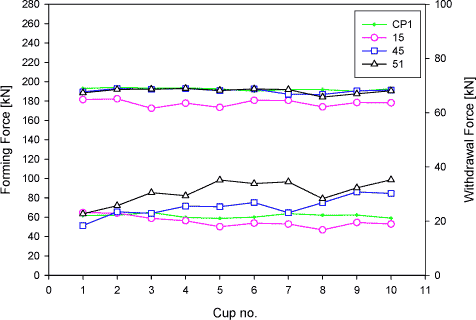
Figure 6.10 Result of technical test. Forming (upper graphs) and withdrawal force (lower graphs) in backwards can extrusion for CP1 and lubricants number 6, 18 and 19 at a draw ratio of 2.0
At the draw ratio of 2.0, lubricant numbers 15, 45 and 51 and the chlorinated reference lubricant, CP1, are tested. The results from this test are shown in figure 5.10.
The forming force for CP1 and the lubricants numbers 45 and 51 are even about 190 kN and does not increase with the number of drawn cans. The forming force for lubricant number 15 is not as stable as
the other lubricants, but in return, the forming force are about 10 kN (about 5%) lower than for the other lubricant. This observation is most likely due to the nature of lubricant number 15, since this is a dry
film lubricant, lubricating with a very low viscous film and a efficient EP additive. The forming force for other liquid lubricants (also lubricants tested outside this project) are almost independent of the viscosity
at the same level at the same test parameters.
From figure 6.10 it is observed that the withdrawal force for CP1 and lubricant number 15 are at an even level (about 60 kN), whereas the withdrawal force for lubricant numbers 45 and 51 is less stable
and increases slightly with the number of cans drawn, but without any sudden increase in force. The only explanation for the slight increase in withdrawal force for lubricant number 45 and 51 is that the
lubricating limit for these lubricants is a draw ratio of approximately 2.0
The result of the technical test is that the performance of lubricant number 15 is equal to the chlorinated reference lubricant under the test conditions. The performance of lubricant numbers 45 and 51 is
slightly worse, although not critical, but force development, which indicates that the lubrication limit is reached at a draw ratio of 2.0 for these lubricants is observed. Lubricant number 10 breaks down at a
draw ratio of 1.8.
Full scale production test:
Lubricant number 15 has previously been tested in full scale at Danfoss A/S in another project without showing good performance. It was concluded that the bad performance was due to its nature (dry film
lubricant), as previously discussed. Therefore, this type of lubricants is not suitable for operations, such as punching, where lubricants need to be pulled with the tool. Lubricant number 18 is a liquid variant of
number 15 (same producer and same EP additive) and since lubricant number 15 has shown good performance in both preliminary tests, it was decided to test lubricant number 18 instead of number 15 in
the full scale production test.
In the full scale production, a work piece (described in section 6.2) is formed in a progress tool at a production speed of 60 work pieces per. minute. The usual production speed at Danfoss A/S is 120
work pieces per minute when using lubricants containing chlorinated compounds.
The progress tool is adjusted, thus lubricant break down cause an emergency stop. Unnecessary war of the tools is hereby avoided.
Under the chosen test conditions none of the four lubricants (numbers 10, 18, 45 and 51) could produce more than 40 work pieces before lubricant break down occurred. This caused an automatic
emergency stop of the test in all cases. The attached pick-up to the tool prevented further automatic production with the test lubricants, but it was possible to continue manual production of more work pieces
with all lubricants. This manual production (slow and piece by piece) probably prevented elevated temperature (automatic work temperature) and thereby continued building of pick-up on the tool.
Due to the bad performance of the tested lubricants in the full scale production test, it was not possible to scale the lubricants individually.
6.4 Conclusions
The strip reduction test used to evaluate the lubricating performance of proposed lubricants in this project causes severely demanding conditions due to large surface expansion, high temperature and low
speed. From the results in the strip reduction test (30% reduction), it may be surprising that only four lubricants (numbers 10, 15, 45 and 51) out of 20 tested showed satisfying lubricating properties since all
20 lubricants were proposed by suppliers based on a thorough description of test methods, test conditions and test materials (both tool and sheet material). The results of the strip reduction test indicate that
it is difficult to design a lubricant to be used under severe conditions even for a single forming operation.
Four lubricants (numbers 10, 15, 45 and 51) continued to the process technical test where they all demonstrated more or less the same lubricating properties.
In the full scale production test at Danfoss A/S, lubricants are stressed further than in the simulating and the process technical tests due to several subsequent forming operations. In this test, lubricant number
18 was tested instead of number 15. Number 18 is a liquid variant of number 15. Number 15 had been tested in the full scale production at Danfoss A/S in another project without demonstrating a good
performance, probably due to the fact that number 15 is a dry lubricant. Even though three of the four lubricants tested in the full scale production test demonstrated promising results in the simulative
technical and the process technical tests, neither of the lubricants could be used in the full scale production test.
Thus, none of the lubricants tested in this project demonstrated satisfying lubricating performance in the full scale production test where a chlorinated lubricant is currently used.
As mentioned in the introduction in chapter 1, non-chlorinated alternatives to chlorinated lubricants already exist for use in less demanding metal working operations such as drilling and milling.
For metal forming operations such as sheet forming, rolling and extrusion, the demands on the lubricant are greatly influenced by the process conditions including the degree of deformation, speed,
temperature and other not as easily identifiable parameters. Experience shows that under moderate or less severe metal forming conditions, some non-chlorinated lubricants developed for forming operations
such as sheet forming, rolling and extrusion show adequate lubricating properties. However, the limits for these non-chlorinated lubricants are that they are specially designed for a certain forming operation
and therefore only work under a narrow set of technical conditions. The lubricants are mainly developed from the knowledge of the performance of existing non-chlorinated EP additives present in
commercially available lubricants and are rarely produced with new types of additives.
The demands from the industry to produce faster and cheaper (material and energy savings) with better tolerances causes more severe process conditions and naturally greater demands on the lubricant.
Often a production line involves more than one single metal working operation such as cutting, bending, stamping, deep drawing etc. to produce a specimen with the desired shape. The process conditions
for all the single forming operations can individually be gentle and non-chlorinated substitutes may be available even though difficult materials such as stainless steel and titanium are used. However, the
successive forming operations in a production line demands that the lubricant has to exhibit good lubricating performance not only in the individual forming operations but also during the entire process. Thus,
the lubricant film formed on the surface of the material has to be able to sustain the entire process or rebuild in the same rate as it is degraded.
The only way to obtain this high performance from a lubricant during very severe process conditions is to use a proper (very effective) EP additive. So far, chlorinated paraffins have shown superior
performance in severe metal forming operations compared to other tested EP additives. Other kind of additives such as polar additives only have a minor impact on the lubricating properties though large
synergy effects sometimes improve the lubricity.
It is obvious from the technical tests that at the present state there are no non-chlorinated lubricant alternatives commercially available for use in severe metal forming operations.
Other metal forming operations such as cold forging cause severe conditions for the lubricant due to large plastic deformation rates (with simultaneous higher energy release). At Danfoss A/S, steel tubes are
produced by forming of a steel rod in a cold forging operation. The lubrication in this particular forming operation on steel is conducted by a carrier layer of phosphate applied underneath a soap. Due to a
demands to form these tubes in stainless steel, this lubrication technique was tested on stainless steel. However, the phosphate layer did not attach to the surface of stainless steel. In order to solve the
problem, a collaboration between Danfoss A/S and Department of Chemistry (DTU) was established with the purpose of developing an electrochemical technique capable of applying a phosphate carrier
layer on stainless steel. This collaboration resulted in the development of a technique called the Extreme Pressure Lubricant System (EPL). The EPL technique has previously demonstrated very good results
in the strip reduction test and the backwards can extrusion test described in section 6.2, in addition to in a full scale production test (tube forming) at Danfoss A/S. The EPL method was not tested in this
project due to failure to comply with the testing equipment in this project.
Danfoss A/S assess their own production to be too small to build equipment to make use of the EPL method as a standard technique. A marked inquiry by Danfoss AS/ to sell surface treated stainless steel
has demonstrated surprisingly low or no interest in the metal industry.
Based on test results of the EPL method, it is expected that the lubricating method is a true alternative to chlorinated lubricants, at least for some heavy-duty metal forming operations.
| Front page | | Contents | | Previous | | Next | | Top |
Version 1.0 October 2005, © Danish Environmental Protection Agency
|