Series title and no.
Nature & Environment
– Green responsibility
Contents
Green responsibility – the sooner the better
Feel free to walk on the grass – using and caring for nature
We take the bike for short errands – but also the car
- 6 Intensity of passenger traffic by transportmode
- 7 Energy efficiency of new cars
- 8 Price changes for transport
- 9 Transport sector co² emissions
We save water, but at the same time we are european champions at resource consumption
- 10 Energyconsumption for heating in homes
- 11 Electricity, water and waste consumption in homes
- 12 co² emissions fromhomes
- 13 co² emissions per capita
- 14 Consumption and recycling of glass and paper
Danish and global water resources
Making green choices should be easy
Preface
Connie Hedegaard,
Minister for the environment
In autumn 2005, the ministry of the environment campaign "Green responsibility – making a difference" brought attention to the personal responsibility we all share for diverse nature and a clean environment and to the options available to us for meeting this responsibility in our everyday lives. Fortunately, nine out of ten Danes want to be good stewards of the environment, and many of them are. However, understanding what one can do to help is sometimes difficult and it is not always easy to do the right thing during a hectic workday. But there is no getting around it; we must all be better at meeting our personal responsibility for the environment, if Denmark is to meet its international environmental commitments, such as the climate objectives of the Kyoto Protocol.
"We need much more information about what we can do to take account of the environment." this was the foremost priority for 1,800 citizens when asked what they felt was needed to increase their interest in making environmental considerations part of their everyday life. emphasis was on making it as easy and convenient as possible.
With this focus leaflet, we want to show how you can change the world just a little through care and consideration and simple means.
The politicians make decisions regarding the frameworks and regulations that aim at protecting our environment and nature. as individuals we can make our own choices and act differently within in these frameworks and the effect on the environment and nature will vary accordingly. the politicians therefore have an overall environmental responsibility which we as individuals can choose to share as consumers.
This leaflet sheds light on the opportunities and limitations available to us for taking personal responsibility for the environment and nature, and it illustrates through selected environmental indicators the significance of our actions in relation to more complex environmental problems.
With this leaflet we hope to explain how your personal "green" responsibility is about more than saving money. How, for example:
• do energy savings link to the prevention of climate change;
• does water consumption link to the groundwater cycle;
• do modes of transport link to both health and environmental impacts?
This leaflet also contains text boxes with good and simple advice.
Introduction
International climate negotiations are high politics. Decisions in this field are extremely important. However, they are not worth much without what one could call the everyday environmental politics, the small, but equally important choices all of us make on a daily basis: when we shop for groceries, when we commute to and from work, when we wash our clothes, and when we work on our home and our garden.
Our daily actions contribute to Denmark having one of the world's highest emissions of Co², with annual emissions of more than 13 tonnes of Co² per capita. many of the things we do daily and when we design our homes have significance for the environment, and if we show consideration, we can all help make a difference.
Taking the bike for short errands instead of the car can save the environment from almost 1kg of Co². replacing a 60-watt light bulb with an energy-saving light bulb will reduce our annual Co² emissions by 14kg from only one hour's use per day. the difference between the estate-type, multi-purpose vehicle (mPv) or sports utility vehicle (Suv) with the poorest petrol consumption and the vehicle with the best consumption is an emission of almost 1 tonne Co² annually, for 20,000 km. in other words, we can make a real difference when we choose car, also on our personal finances by saving on petrol expenses.
The world's environmental ministers take important decisions and set ambitious goals. However, if the political decisions are not followed up by people in their everyday comings and goings, the goals will become very hard and expensive to fulfil. this applies not only to the fight against climate change, but also to the fight for clean air, clean water and diverse nature.
Green responsibility – the sooner the better
It is easier to take environmental responsibility if it seems the natural thing to do; if it is a part of our upbringing.
This way, taking responsibility for the environment is not something we have to constantly remind ourselves about, but it is a knowledge and an understanding naturally integrated with our actions. But how can we learn at an early stage to take nature and the environment into consideration in our daily errands, if our parents, for instance, are not being good examples in this regard?
Green responsibility first became a serious ingredient in Danish schools in 1992 when the subject “nature and technique” was introduced. Subsequently, this was replaced by examinations in more natural science subjects, and many schools have special subject weeks focusing on cross-disciplinary subjects, for example about the environment and nature. an internet portal has been established containing information for teachers teaching in this field. Furthermore, for several years now the ministry of the environment has been running a competition for school children called "Clean week", in which 5th and 7th graders compete to create
the best newspaper about waste. at the same time, nature schools and the Nature Guide Service offer supplementary teaching within the field of nature and the environment.
It turns out that it is the parents who learn about correct environmental behaviour from their children, and that the children are a good starting point if you want to change the behaviour of the entire family.
In recognition that the greatest danger to the environment is environmentally harmful behaviour by people stemming from ignorance, international environmental organisations have long been promoting education and training as essential means to achieve less environmental impacts. the culmination was an international united Nations Decade of education for Sustainable Development launched in 2005.
1 Environmental education
Source: The Danish Outdoor Council
Environmental education in primary and lower-secondary schools. this indicator shows the trend in the number of eco-Schools in the past 11 years. an eco-School is a school that has completed one or several eco-Schools programmes and flies a green flag as a symbol of their green initiatives. eco-School themes include water, energy, waste, nature, environmental audit and eco-labelling.
The number of green flags has increased more than tenfold in ten years, from 19 in 1994 to 210 in 2004. the eco-Schools programme is unique in that it involves the entire school in the process. Not only do the students acquire new knowledge, the whole school changes behaviour and real resource savings are achieved.
2 Collaborations with local agenda 21
Source: The Ministry of the Environment, Spatial Planning Department
The number of counties and municipalities which have started working with Local agenda 21.
Taking green responsibility very much coincides with the work of many municipalities and counties in connection with Local
agenda 21. this includes efforts by municipalities and counties for green areas, urban ecology, water and energy savings, waste separation and traffic planning. it is important that local authorities live up to their environmental responsibility and for example include environmental considerations in their procurement. in this way, municipalities and counties can serve as a role model and the physical evidence of their initiatives can inspire their inhabitants to make environmental considerations
as well.
3 Access to green areas
Source: The Danish Forest and Landscape Research Institute
The proportion of the population in Copenhagen and aalborg that have access to a green area within 15 minutes walking-distance from where they live.
The existence of green areas in the local environment is an important factor for everyday recreation. Studies have shown that green areas that are not within 500 meters of where one lives are not used during normal weekdays. Daily visits to green areas also help create better understanding of nature.
The majority of the Danish population lives in cities and is therefore dependent on the possibilities offered by green areas to experience nature. the demand for nature experience is increasing steeply. the conversion of old industrial areas, urban renewal and regeneration of neighbourhoods etc. holds
a possibility for improving the green element in densely built-up urban areas.
Feel free to walk on the grass
– using and caring for nature
Outdoor recreation is of great importance to our physical and mental well-being. the landscape and urban green areas play an important part: more than 95 per cent of the adult population goes for longer or shorter trips to the countryside at least once a year. most recent calculations from the Danish Forest and Landscape research institute show that forests and beaches receive about 75 and 54 million visits respectively each year.
Being in nature and experiencing flora and fauna gives us joy and influences us in a positive way. our perspective on nature is about our perceptions and experience of nature and landscapes. our perspective on nature is a part of our value basis and aesthetics and it holds our understanding of what nature is and how we should behave in it. our perspective on nature defines, whether directly or indirectly, the strategies according to which we choose to use or protect nature. Furthermore, the more we use nature, the more we understand it and want to safeguard it.
We also have a need and a responsibility for the quality of the nature close to us every day. this applies for example to our own gardens and the nature available to us in residential areas, industrial areas, along roads and pathways, as well as other green areas close to the city. Here, we can do more for the wild animals and plants.
The discharge of nitrogen to nature is a problem that affects plants and thus also animals in the worst way.
Our actions also affect nature far from us, for example when we buy products manufactured from tropical wood. if the wood is not produced legally and in a sustainable manner, as consumers we could be contributing to clearing the tropical rainforest, which is already under dire threat. therefore, we should make sure the wood has been manufactured in an acceptable manner by buying, for example, FSC-certified wood.
4 Number of visits to forests
Source: The Danish Forest and Landscape Research Institute
This indicator shows the number of visits to Danish forests in 1976/77 and 1993/94. the number of forest visits was calculated at about 40 million annually in 1976/77 and about 50 million annually in 1993/94. an increased recreational use
of the forests is assumed to promote welfare and health and is therefore a good trend with regard to forest use in Denmark. at the same time, access to nature is a fundamental building block for sustainable behaviour and outdoor recreation.
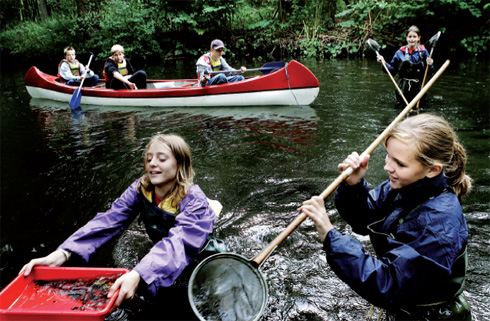
5 Number of nature guides
Source: The Danish Forest and Nature Agency
Nature guides carry out activities in nature with the objective of enhancing people's understanding of nature and disseminating knowledge about environmental conditions in nature. there is an increasing demand to experience nature. at the same time, more and more people are recognising nature guidance
as an excellent way of creat
ing an increased understanding of nature which can make the experience of nature stronger.
The number of nature guides is increasing steadily, from 128 in 1994 to 286 in 2004. Nature guides run about 26,000 activities annually with a total of about 850,000 participants. Nature guidance can help create a better understanding of nature and increased awareness of the environment. Nature guidance can also be seen as an important tool to promote green responsibility.
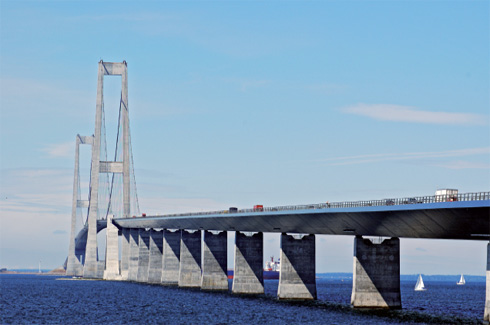
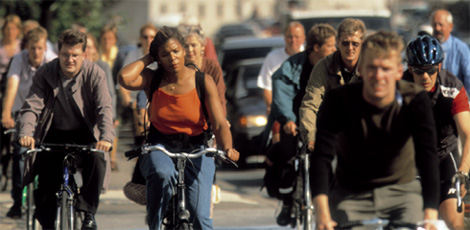
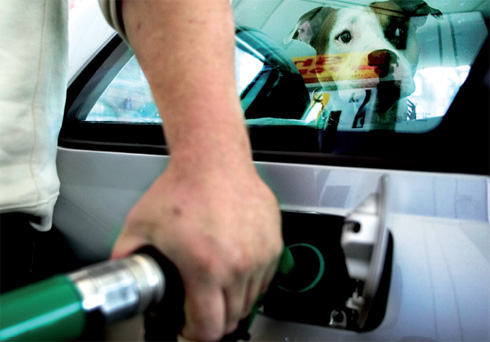
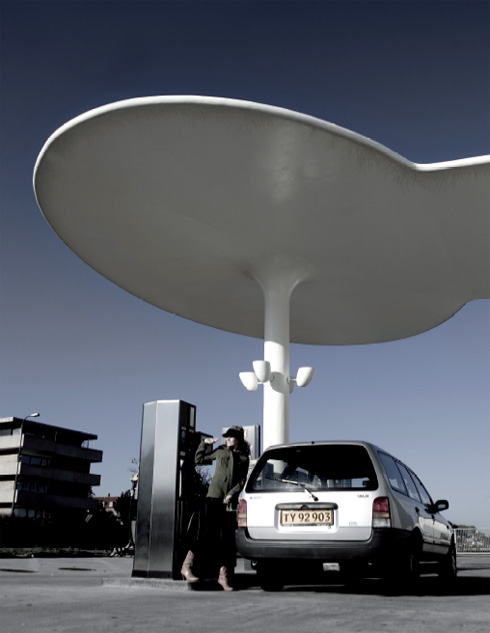
We take the bike for short errands – but also the car
- 6 Intensity of passenger traffic by transportmode
- 7 Energy efficiency of new cars
- 8 Price changes for transport
- 9 Transport sector co² emissions
The transport sector is one of the sectors causing the greatest environmental impact; and transport continues to increase. the way society is developing has caused rapidly increasing demand for transport in step with the economic development. With continued economic development, we can expect more passenger and freight transport, if the present trend continues. mobility in many ways is a prerequisite for development. But at the same time, this prerequisite for continued growth can be undermined if the growth in traffic leads to congestion or deterioration of the urban environment.
The transport sector consumes non-renewable resources and is dependent on oil. Half of Denmark's total oil consumption today stems from transport.
The transport sector causes about 30 per cent of Co² emissions, and this share is increasing. air pollution from traffic also causes regional and local problems. the discharge of nitrogen oxides, for example, contributes to acidification of lakes and watercourses.
Six out of ten households have a car, but the best thing you can do for cleaner air and less noise is to leave your car at home. take the bike or use public transport as often as possible. there is no sense in taking the car to soccer practice or the local fitness centre close to where you live. the same applies for other small errands you do in your spare time, such as fetching bread from the baker's. it is the short trips in your car on a cold engine that pollute the most. even if you cannot get around using the car, there is still a lot you can do for the environment. You can make environmental considerations a part of your driving behaviour and at the same time save petrol, or you can arrange a carpool with others.
If you follow this advice, you will avoid or minimise air pollution that can harm human health and pollute nature. You help reduce global warming, road noise and the risk of traffic accidents.
6 Intensity of passenger traffic by transportmode
Source: Transport 2000, Statistics Denmark and the Road Directorate
Overall passenger traffic intensity has increased from 1990 to 2001 by almost 17 per cent. Since 1996, passenger traffic by train has increased relatively steeply, partly because of the opening of a fixed link between the islands of Funen and Zealand.
Common sense in traffic gives more life
• If you take the train or bus instead of the car to work or school for an entire year, and the distance is about 20 km each way, you will spare the environment from 800 kg of Co², corresponding to 300 l of petrol.
• If you avoid taking the car on short trips and use the bike or walk instead, you spare the environment for almost an entire kilo of carbon dioxide per trip. Plus you get some exercise as well.
• Each time you leave the car at home, you avoid polluting the air with particles. Particle pollution is one of the major environmental problems. Particles come mostly from the exhaust of diesel cars, but certain types of petrol cars also emit particles. Furthermore, both petrol and diesel cars contribute to particle pollution from tear on brakes, tyres and the road. the smallest particles are the most harmful; since they are so small they can travel far down into the lungs without being coughed up. Here they may harm the lungs or they may enter the bloodstream and cause cardiovascular disease. the particles can also carry other pollutants, for example the tar substances PaHs which are carcinogenic. Particles are the cause of cardiovascular diseases, respiratory disorders, allergies and cancer. in Denmark alone, about 3,400 people die prematurely each year due to particle pollution.
• Each time you leave the car at home, you also avoid creating the nitrogen compounds that can lead to acidification of watercourses and lakes. Hydrocarbons and nitrogen compounds can also irritate the respiratory system, and some hydrocarbons are carcinogenic.
• Each time you leave the car at home, you also reduce emissions of Co² to the atmosphere, one of the most important reasons for climate change. the transport sector alone accounts for about 30 per cent of overall emissions.
• Each time you leave the car at home, you moreover reduce noise pollution and the risk of road accidents. Car traffic in the cities is a substantial source of noise, and noise can lead to problems in the form
of stress, high blood pressure and reduced ability to function for the people exposed to the noise. according to a conservative estimate, road noise causes 200-500 premature deaths annually (from cardiovascular disease and high blood pressure).
7 Energy efficiency of new cars
Source: The Ministry of Transport and Statistics Denmark
Energy efficiency is an indicator for the resource consumption as well as the Co² emissions of passenger cars. the better the energy efficiency of the car, the fewer grams of Co²/km it will emit. Despite the fact that the weight of cars continues to increase slightly, the average energy efficiency of new cars has gone up.
Newly registered diesel cars still take the lead. their energy efficiency has increased from
17.3 km/l in 1998 to 19.8 km/l in 2003, which corresponds to an increase of 14.5 per cent.
The development in the average energy efficiency of newly registered petrol cars has not been nearly as favourable, with an increase of about 5 per cent, from 13.3 km/l in 1998 to 13.9 km/l in 2003.
In the period 1998 to 2003, the proportion of diesel cars of the total number of new cars sold increased from about 6 per cent to 20 per cent. this means a reduction in total Co² emissions. in 2003, the average emissions of Co² from new diesel cars was 141 g/km, which is very close to the goal of 140 g/km in 2008 agreed between the european Commission and the car industry. However, diesel cars are not an unmitigated success, since diesel cars have higher emissions of Nox and particles than petrol cars. therefore, an exclusive favourisation of diesel cars will mean a reduction in effects on the climate, but will increase the impact on the local environment.
8 Price changes for transport
Source: Statistics Denmark
This graph illustrates the changes in the costs of private cars and public transport during the period 1994 to 2004. the trend is compared against the general price development (average consumer price index). the cost of petrol rose considerably in the late 1990s, and prices remained stable at this level in the years 2000-2003. Between 2003 and 2004, petrol prices went up markedly, mainly due to the general global increase in oil prices.
The cost of maintaining a car has increased steadily and more than the average consumer price
Index over the whole period 1994-2004. the cost of acquisition, however, has not risen nearly as much as general prices. From 2002, prices of cars show a more steep increase.
The price index for public transport has been higher than the average consumer price index since 2001. one of the reasons is that the state removed the subsidy for public transport ticket prices with effect from 2004. at the eu Summit in Gothenburg in 2001, it was concluded that the cost of transport should more accurately reflect the costs which it imposes on society.
9 Transport sector co² emissions
Source: The National Environmental Research Institute
This indicator describes the transport sector's Co² emissions. the transport sector accounts for more than 30 per cent of Denmark's total emissions of greenhouse gases (Co²). transport sector emissions increased by about 14 per cent from 1990-2001. in 2001, road transport accounted for more than 90 per cent of the transport sector's overall Co² emissions.
Furthermore, other environmental impact by the transport sector covers several different types of emission. in Danish cities, traffic makes up the largest source of air pollution. the acidifying substances from traffic are primarily nitrogen oxides (Nox), volatile organic compounds
(NmvoCs), sulphur dioxide (So²), as well as particles and carbon monoxide (Co).
Despite increasing traffic, emissions of Nox, NmvoC and Co have dropped. this is due partly to the 1990 requirement for catalytic converters on new petrol cars, and partly to the introduction of cleaner fuels. in the period 1988 to 1998, the proportion of cars with catalytic converters rose from zero to more than 50 per cent of cars.
We save water, but at the same time we are european champions
at resource consumption
- 10 Energyconsumption for heating in homes
- 11 Electricity, water and waste consumption in homes
- 12 co² emissions fromhomes
- 13 co² emissions per capita
- 14 Consumption and recycling of glass and paper
Many of the things you do as a natural part of your everyday life can harm the environment: for example, when you wash clothes, clean, carry out do-it-yourself work on the house, and many other domestic tasks. When washing clothes you use both electricity and water, and you release detergents into the environment. at home, it’s all about being aware of the little things and making just a few simple changes which together make a difference for the environment.
We are becoming more and more wealthy in Denmark. the extra money is being spent in particular on transport, communication, sports and leisure equipment, travel and entertainment. Households account for more than half of Denmark's consumption of goods and services. Private consumption affects the environment by taking up space for housing and sports and leisure activities, through consumption of energy and resources, by the discharge of substances harmful to the environment and by generating waste. in addition, there are a number of indirect effects from extraction of raw materials, manufacture of industrial products and processing of food products. Furthermore, private consumption leads to extensive transportation of goods between producers, shops and consumers.
Consumer attitudes and life styles are significant for the impact on the environment that we each cause. if we use our bikes, remember to turn off the light when we leave the room, save on water and eat lots of bread and vegetables, we put less pressure on the environment than if we use the car for short distances, leave the computer on and eat steak and roast.
For many years, Danes have been good at saving electricity and water. For the sake of the environment, but especially to save money, as the cost of electricity and water has increased. We care as much about saving money as saving the environment when we choose electricity-saving bulbs and use the light-flush button in the toilet.
10 Energyconsumption for heating in homes
Source: The Danish Energy Authority and Statistics Denmark
Energy consumption for heating per m² went down 28.9 per cent during the period 1980 to 2003. this drop can be explained partly by improved insulation in older houses and partly by old boilers having been replaced by newer, more efficient natural-gas boilers and district-heating installations. there is also the fact that new houses have lower energy consumption than existing ones. Potential for further efficiency improvement of energy consumption in houses still exists.
Energy consumption for heating has gone down from 179.6 Pj in 1980 to 156.5 Pj in 2003, corresponding to a drop of 12.9 per cent. this decrease has occurred even though the total heated area in the period has gone up 22.6 per cent. the drop in energy consumption occurred from 1980 to 1990. Since then consumption has been fairly stable.
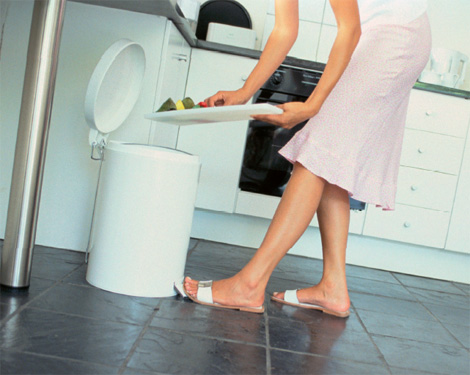
11 Electricity, water and waste consumption in homes
Source: The Danish Energy Authority and the Danish Environmental Agency
This indicator describes resource consumption in homes. the graph shows an index for household consumption of water and electricity from 1990-2003 and waste arisings 1994-2003 in relative figures.
Consumption of drinking water by households has been falling markedly. this should, amongst other things, be considered in the context of the 1993 tax reform which introduced a tax on water of DKK 1.00 per m³ in 1994 increasing gradually up to DKK 5 per m³ in 1998. Danish water consumption per capita is low in relation to comparable countries.
Electricity consumption per capita has by and large remained constant for a ten-year period. Waste arisings from households showed a steady increase until 2002, after which arisings dropped until 2003. the increase up to 2002 was 22 per cent, more than economic growth in the period.
Water consumption by households has been successfully reduced and stable electricity consumption has been maintained despite an increase in wealth. on the other hand, waste arisings from households have increased.

Keep check on heating and save money
• Keep the temperature at 18-21°C. this corresponds to setting the temperature control on the radiator at about three.
• always have more than one radiator on at the time. make sure the radiators within the same room are set at the same level.
• always keep the heat on in all rooms, including those that you do not use. Set the temperature control at one, corresponding to about 12°C. the same should apply when you leave on holiday.
• turn the radiators off when you air the room. air rooms by opening many windows for a short period of time.
• When following the above advice, you save heat and contribute to the reduction of global warming and pollution of the air by environmentally harmful sulphur and nitrogen compounds.
• Lowering the room temperature in your house by as little as one degree, can spare the environment for emissions of about 230 kilos of carbon dioxide in a year, if you live in a house of 130 m². at the same time, you save about DKK 500 annually.
• When you save heat, you help reduce global warming and pollution of the air with sulphur and nitrogen compounds that are poisonous for plants and animals. Heat is often produced in ways that lead to emissions of Co² (carbon dioxide) and sulphur and nitrogen compounds. Carbon dioxide in the atmosphere is one on the most significant causes of manmade climate change.
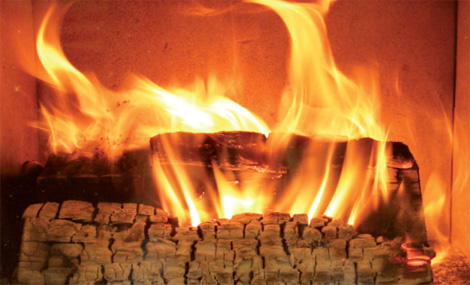
Burn clean – for the sake of the environment and public health
Supplementing your heating system with a wood-burning stove may seem attractive from a private-economic point of view. However, even though firewood is a renewable energy source which reduces emissions of carbon dioxide, there are many examples showing that incorrect use of wood-burning stoves is very detrimental to the local environment.
Particulate matter air pollution has long been known to have negative health effects, especially in terms of respiratory disorders and cardiovascular disease. as a result, we die earlier than we otherwise would.
a significant source of particulate matter air pollution is burning wood for heating. around half of Danish emissions of particles actually stem from wood-burning stoves and boilers. mostly because of incorrect use. When you burn your wood correctly (complete combustion), you minimise the resulting air pollution. the Danish environmental Protection agency has therefore drafted four easy clean-burning recommendations.
1. Use clean and dry wood
Wet wood leads to poor combustion and a lot of smoke. Never burn waste – for example advertising matter, magazines, milk cartons, cardboard, or painted or treated wood.
2. Make sure there is plenty of air
Not enough air leads to many particles in the smoke that are harmful to health. Start the fire with kindling wood, firelighters or some newspaper, so that the fire lights up quickly and properly. Do not lower the air control until the flames are bluish in tone.
3. burn small amounts of wood
The fire needs to catch so that a high temperature is reached quickly. Whenever you put new wood on the fire, you should increase the air ventilation until the dark-yellow flames are gone.
4. Check the smoke coming out of your chimney – it should be almost invisible
if there is too much smoke and it smells bad, then it is likely you are not burning correctly. ask your chimney sweep for advice.
12 co² emissions fromhomes
Source: The National Environmental Research Institute
In the period 1990-2003 household emissions of Co², which in 2002 accounted for 6 per cent of overall Danish emissions fell by 15 per cent, primalrily as a consequence of energy efficiency improvements and conversion from oil heating to heating by natural gas or district heating.
13 co² emissions per capita
Source: The International Energy Agency
The prospect of harmful climate change in this century is a global problem. international cooperation is therefore pivotal, if we are to tackle this challenge as effectively as possible. manmade emissions of greenhouse gases, such as Co², methane and nitrous oxide etc., contribute to global climate change. We can do something about this through international cooperation and international regulation.
Under the Kyoto Protocol, the eu is obligated to reducing its emissions of greenhouse gases by an average of 8 per cent in the period 2008-2012 relative to 1990. an underlying principle in the eu's climate strategy is that requirements to member States differ depending on conditions such as the member State's energy consumption and economic capabilities. the eu's total reduction obligation under the Kyoto Protocol was distributed among the 15 'old' eu
member States through burden sharing. the eu burden sharing agreement means that this objective is central to Danish climate policy.
The result of negotiations in the eu was large differences in the requirements to the individual countries. Denmark and Germany, for example, need to reduce emissions by 21 per cent, while countries such as Greece and Portugal in the same period are allowed to increase their emissions by 27 per cent and 25 per cent respectively.
The development in Denmark, according to the iea’s calculations, shows a fall of 4.3 per cent. For the eu as a whole, there is a drop in emissions per capital of 0.6 per cent covering such large differences as e.g. a growth of 34 per cent in Spain and of 47 per cent in Portugal and a drop in Germany of 15 per cent and in the united Kingdom of 6 per cent. For eastern europe and the former USSR states, reorganisations in the 1990s have led to a marked fall in greenhouse gas emissions, which is also reflected in a drop in emissions per capita, with, for example a drop of 33 per cent in the former USSR.
Emissions per capita in developing countries are still significantly lower than those of the industrialised countries but are expected to increase in the future as total emissions show large increases in for example China (+ 36.0 per cent) and
india (+ 71.4 per cent). For the world as a whole, there is a drop in emissions per capita of 1.8 per cent, covering an increase in total emissions of 15 per cent and an increase in population of about 17 per cent.
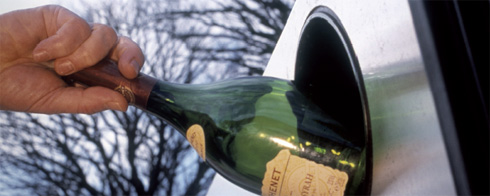
14 Consumption and recycling of glass and paper
Source: The Danish Environmental Protection Agency
Source: The Danish Environmental Protection Agency
Consumption of glass generally increased from 1990 to 2002. on the other hand, recycling of glass also increased steadily throughout the period, reaching 135,000 tonnes in 2002. this corresponds to a recycling rate of 70 per cent.
Paper consumption generally increased during the period. the collection trend for paper and cardboard for recycling also increased throughout the period, although from 1990 collection amounts accelerated, reaching 752,000 tonnes in 2002. this corresponds to a recycling rate of 55 per cent of the total volume of paper and cardboard.
Cardboard and paper must be separated as prescribed by the municipality. often they must be separated from each other because the fibres in paper are longer than in cardboard and may be used for other products than cardboard and paperboard. the fibres can be reused up to ten times.
Every day, year round, the individual Dane generates about 7 kg of waste. much of this waste may be recycled, which means we can save the energy which would otherwise have been required to break down the products and produce new ones. For example, lots of energy is required to produce new glass, but when you hand in glass for recycling, it will be remelted.
In this way you help reduce the resources used for glass production.
recycling makes waste a resource
• Remember that the municipalities are responsible for waste management in Denmark. Find out what you are required to do with your waste in your local municipality.
• Hand in glass and bottles for recycling. Window glass, light bulbs and fluorescent tubes must not be put in the glass container.
• Hand in cardboard and paperboard for recycling. For example in a container for cardboard or at the recycling station nearest to you.
• Hand in newspaper, adverts, weeklies and envelopes for recycling.
• Compost your garden waste, or take it to the recycling station.
• Hand in batteries according to the municipality’s instructions, for example at the recycling station or with the mobile waste collector. the greatest problem with environmentally dangerous batteries and button cell batteries is the contents of cadmium and mercury. Cadmium damages the kidneys and reproduction ability in humans and animals and therefore must not be spread to the environment. Cadmium can be recycled.
• If there is a waste scheme for biowaste where you live, all your kitchen waste must be separated from the remaining waste and put in a separate waste bin.
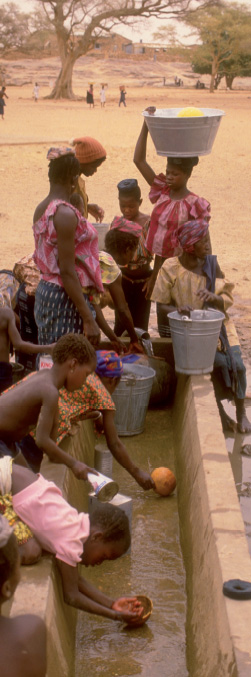
Danish and global water resources
We consume water every day: for drinking, for cooking, for sanitation. the quality of this water matters greatly to our health. in Denmark, we get almost all of our drinking water directly from the groundwater. Water is also an important part of nature and is habitat for many plants and animals. Protecting our water resources is not merely a question of ensuring enough and good drinking water. We use water bodies for recreational purposes and house prices reveal that we gladly pay extra for a house with a view over water. However, clean water is not an inexhaustible resource. therefore, it is important that we safeguard our water resources, by limiting our consumption and by protecting the water from pollution.
all water bodies, throughout the world, are interlinked in a cycle. through precipitation, leaching, run-off and evaporation, water is being transported continuously between groundwater, soil, lakes, watercourses and rivers, oceans, glaciers, ice caps and the atmosphere. the water in the world's rivers is exchanged about 22 times during a year. manmade impacts on one part of the cycle have consequences for the entire water cycle. For example, pollution of the groundwater due to use of fertilisers and pesticides by agriculture will impact the condition of water in both lakes, water courses and the sea.
The size of resources
Calculations from 2003 and subsequent model calculations have revealed that Denmark has less groundwater available than expected. the water available in Denmark for exploitation comes to 1.0 billion m³ annually, taking into account e.g. measures aimed to protect watercourses. this is almost 50 per cent less than in 1992, when total water resources were calculated at 1.8 billion m³ annually. the new statement includes the entire freshwater cycle and takes account of the fact that the impact on watercourses and nature limits the amounts that can be extracted from the groundwater.
Percolating contamination, which impairs the quality of the upper groundwater, has also meant that part of this resource cannot be utilised for a number of years. as annual consumption in recent years has been between 0.6 and 0.7 billion m³, there is enough groundwater at national level to cover the need. However, the water resources are not always where the need for water is greatest, for example around large cities, and regional distribution of water resources may be necessary in future. During dry summers, agriculture, among others, will exploit existing irrigation licenses to the full and during droughts, when licenses for using water for field irrigation are exploited to the limit, in many places in Denmark more groundwater will be used than is actually available.
The water supply in Denmark consists of many small and some large water works, nearly all of which supply the population with clean and untreated water. Danish drinking water supply is unique, as 98 per cent of the water stems from groundwater reservoirs. in most other european countries a large part of the water is treated surface water, which is not nearly as well protected against contamination. in Denmark, therefore, treatment of drinking water has not been necessary to any great extent, although within the past 10-20 years more contaminated wells and reservoirs have been observed. However, the water we get today is cleaner than it was ten years ago. this is because the water works are now extracting deep-lying groundwater which has not been contaminated by e.g. pesticides. matters are far worse in large parts of the world where two billion people today are without clean drinking water.
15 Water consumption and prices
Source: Danva and the Danish Environmental Protection Agency
This indicator shows changes in household water consumption (litres per person per day) in relation to changes in the average water price paid by consumers (DKK per m³). From 1993 to 2002 there was an unbroken fall in household water consumption. in this period, consumption went down by about one quarter. this means that the rise in consumption in 2003 is the first since 1989.
The price of water increased by more than 150 per cent between 1993 and 2003, i.e. the price of one m³ water has become 2.5 times more expensive over a decade. the correlation between increasing water prices and the fall in household water consumption confirms the effect of green taxes as an incentive to save water. in the coming years, further increases in water prices are to be expected. reasons include greater expenditures for water works, as they will have to pay compensation for limitations on land use to protect the groundwater.
16 Pesticides in the water
Source: The Geological Survey of Denmark and Greenland
The trend in observations of pesticides in the period 1990-2004 in groundwater monitoring. the figure shows the proportion of wells where pesticides
or breakdown products from these have been observed in the national groundwater monitoring system.
In 2004, pesticides or breakdown products from pesticides were observed in every third groundwater intake examined. the limit value for drinking water was exceeded in more than every ten groundwater intakes.
The rising curve reflects the fact that up through the 1990s water samples have been analysed for more substances. overall, pesticides have been found in almost half of the wells examined, and in about 17 per cent of the wells the limit value for drinking water was exceeded.
17 Pesticide observations by soil depth
Source: The Geological Survey of Denmark and Greenland
By far the majority of the substances observed stem from upper groundwater located 0-40 metres below ground level and they may, in time, influence the groundwater located further down. By far the majority of the observed pesticides are today subject to regulations or have been banned.
The graph shows the development in the number of wells where pesticides have been observed at three depth intervals (0 to 30 metres below ground level). From 2000 to 2004, there is a slight, steady increase in intakes impacted by pesticides at all three levels, even though the number of substances analysed was constant. the increase in the 1990s is due to expansion of the analysis programme.
Making green choices should be easy
As a conclusion to the first part of the campaign "Green responsibility – making a difference", an idea panel gave their recommendations as to what should be included in future work to underpin green responsibility. the idea panel, amongst other things, pointed out that feeling and taking responsibility for the environment should be part of everyone's upbringing, and that it should be easy.
Eco-labelled and environmentally certified goods and services send a clear signal which it is easy for the consumer to relate to. From an environmental perspective, labelled products are from the best part of the market. this means that they have been manufactured in a way that puts less pressure on the environment than other, similar products. moreover, they also lead to less environmental damage when you get rid of them. often, the least environmentally harmful products are also the ones that are the least harmful to the health of you and your family. What is more, you can even save money on, for example, your water or electricity bill.
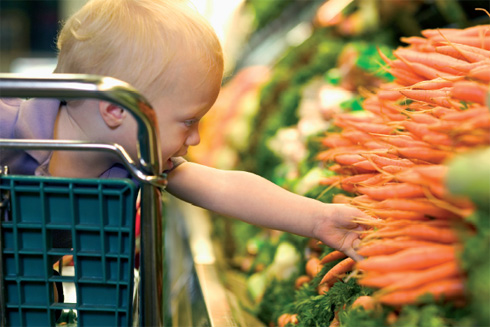
However, this may be difficult when there are conflicting interests. For example, when economic considerations pull in one direction and environmental or health considerations in another direction. this can be a dilemma when you are considering what to place in your shopping cart, or when you are tempted, against all good advice, to burn waste in your wood-burning stove in order to get cheap heat.

There are more than 3,000 eco-labelled products and services on the Danish market.
The Flower is a european eco-label, whereas the Swan is Nordic. the labels are a guarantee that the products do the least possible harm to the environment. the same requirements to quality and effect apply to eco-labelled products as to other products.
In order to qualify for the Swan or the Flower, a kitchen towel brand must be made from recycled paper or paper originating from wood from sustainable forestry. the paper must be produced in a way consuming the least possible energy and polluting air and water as little as possible. Likewise there is a requirement for limited use of chemicals that can accumulate in the food chain or which have endocrine disrupting effects. Furthermore, the paper towel must have the proper quality.
It is also possible for a hotel to get "an overnight stay" eco-labelled. in other words, eco-labels go across all of the many products and work processes that are part of a hotel. Hotels can get the european Flower, the Nordic eco-label the Swan and the Green Key.
Twenty per cent of the world's largest travel agencies have joined in a uN initiative that makes it possible to choose a travel destination where the local authorities are doing something for the environment. in this way you help ensure that you own stay is less burdensome on the environment.
economic tools
In addition to eco-labels, making it easier to do the right thing for the environment can be achieved by reducing the conflict between environmental considerations and economic considerations, or by making the right choices more attractive. When large public procurement activities promote the market for environmentally friendly goods, prices fall. the
polluter pays principle (PPP), which is part of the eu's new strategy for sustainable development, means that an enterprise, amongst other things, must pay for the environmental impact associated with manufacturing its product. We are familiar with this from taxes on water and energy. When the products that are least friendly to the environment become more expensive, the consumers will choose the more environmentally friendly solutions. a third way is to put a tax on the least environmentally friendly products. For example, plastic carrying bags in supermarkets. this encourages consumers to reuse the bags or bring their own canvas bag and thus help the environment. these tools have an effect irrespective of whether we see the link between our actions and the impact they have on the environment.
environment on the move
The Green Key is an environmental diploma given to hotels, hostels, holiday and conference centres, camping sites, holiday homes, restaurants and sports facilities which fulfil a number of environmental criteria.
In order to achieve the Green Key, the enterprise must comply with a number of specific environmental requirements. the Green Key is a guarantee that the enterprise is working, amongst others, to:
• reduce consumption of water, heat and electricity
• separate and reuse waste
• use environmentally friendly cleaning products
• offer and refer to "green" activities
• incorporate employees and suppliers in environmental-management work.
18 Eco-tourism
Source: The Danish Environmental Protection Agency
This indicator shows the trend in environmental initiatives within tourism in the form of participation in the Green Key eco-labelling scheme. other schemes include Destination 21, emaS, the Flower, iSo 14001 and the Swan.
A few tourist attractions are labelled with iSo 14001 or emaS. the eu label, the Flower, commenced in 2004 with five hotels, and more are on the way. the eco-labels contribute to upgrading and improving the environmental standard of tourist areas and facilities. the generally declining participation in eco-labelling schemes since 2000 is reversing with new labels such as the Flower and an increasing number of eco-labelled holiday homes.
19 Eco-labelled products on the danish market
Source: Eco-labelling Denmark
This indicator illustrates developments in the number of eco-label licenses and the number of eco-labelled products on the Danish market. the figures describe Swan and Flower-labelled products. one license can apply to many trade names, sold to different retailers.
During the period 1998 to 2004, the number of widely available eco-labelled products rose steadily. the most commonly seen eco-label is the Swan label,
but the Flower is making good progress. in 1999, two products bore the Flower, and in 2000 the corresponding number was seven. However, in 2004 the Flower label accounted for almost 10 per cent of eco-labelled products on the market. the increase in the number of products bearing the Flower really picked up with the eco-labelling campaign initiated in 2001; and with the Flower campaign in a large part of the eu during october 2004 the number of products on the market reached 210.
The decrease in the number of product licenses from 2000 to 2001 is due to a drop in the number of Swan licenses for paper for printing, as the major manufacturers no longer thought
The number of eco-label licenses for paper for printing is, at present, 124, and the number is expected to grow.
Every three to five years, eco-label licenses for a given product area must be renewed due to a tightening of regulations. most often this gives rise to a drop within the area in question. apart from the reduction in Swan label licenses on paper for printing in 2001, trends are positive for the other product groups. this goes to show that tightened regulations are working as intended. the aim is that as many products as possible
of the top third or quarter of products on the market are eco-labelled, so that the market can support a sustainable development.
20 Organically farmed food
Source: The Ministry of Food, Agriculture and Fisheries
The Danish Ø-label indicates that the product is guaranteed by state-control to be organically farmed. the label can apply to agricultural commodities farmed according to the eu's regulations for organic farming, including a number of special Danish provisions, or according to Danish regulations for organic livestock farming. Foreign organic food can obtain the label, if it is packaged and inspected in Denmark.
Organic means that no pesticides have been used in the production, except for a few exceptions (e.g. sulphur). artificial fertilisers are prohibited, and
as a general rule fertiliser from non-organically produced livestock must not be used. organic livestock are not given growth enhancers and at least 80 per cent of their feed is organic (90 per cent for cattle, sheep and goats). Bone meal and genetically modified organisms (Gmos) are also not allowed. Ø-labelling is a voluntary scheme. the Danish ministry of Food, agriculture and Fisheries ensures that regulations are complied with.
The graph shows that the overall area of organically farmed farmland has increased significantly since the mid-1990s. in 2003, organic farmland made up 165,622 ha. this development, however, has stagnated in the past couple of years.
In 2003 there were a total of 3270 organic farms in Denmark, corresponding to 6.7 per cent of all Danish farms, and 6.2 per cent of the total area of farmland. in relative terms, organic farming in Denmark is among the largest in europe.
Summary
Green responsibility is about seeing possibilities and understanding consequences. it is about knowing that we can make a difference and influence the environment each time we make a simple everyday choice. For example, when we shop, when we move about in traffic, when we discard and buy new things, or when we work on our home or garden.
The greatest threat to the environment is when we make wrong choices based on ignorance of the consequences they have on the environment.
These many simple choices are closely linked to the national and global challenges that are part of, for example, international climate negotiations. the way to taking responsibility for the environment is all about understanding how our daily activities are important for both the local and the global environment.
The earlier in our lives we understand the significance of our actions for the environment, the better we will be at adopting good environmental habits. therefore, school children are the target of the greatest efforts. No one teaches parents to take green responsibility better than children and young people.
Outdoor recreation and access to green areas are vital factors for well-being and for understanding how things are interlinked in nature and in the environment. in the company of a nature guide in the countryside, we can experience and learn how plants and animals are influenced by our emissions of Co².
We live in a busy society. People and goods move and are moved about. the transport sector is large and burdensome on the environment and human health, especially for the air in cities. unfortunately, many of us have acquired habits that exacerbate the problem. many of us own big cars which pollute the air with harmful particles and utilise huge amounts of petrol or diesel. at the same time, we use the car for short trips far too often, rather than taking our bikes or public transport.
In Denmark, we have become richer and our increased consumption means we spend many resources. However, we have also become better at saving resources; for example, we have become better at recycling glass and paper. things are progressing best in saving water, the price of which tripled from 1993 to 2003. However, we can save even more. Danish groundwater resources come to one billion cubic metres annually and consumption is 6-700,000 million cubic metres, but the resources and needs do not always match, so it is difficult to cover the needs of the entire country from local groundwater resources. of course, the situation is far worse in the many parts of the world where a total of one billion people are without clean drinking water.
It is important that making the right environmental choices is easy and convenient for consumers. eco-labels indicating that a good or service is less environmentally harmful than most alternatives are one way of achieving this. tourism is a new field where we can take account of the environment, both in Denmark and when we travel to distant tourist destinations. in addition to eco-labels, making it easier to make the right environmental choices can be done by making them more attractive. For example, the market for environmentally friendly products can be promoted if the public sector shows the way through green procurement. in this way, the price of environmentally friendly products will fall. alternatively, the government can put a tax or charge on environmentally harmful products. thus the polluter pays principle (PPP) means that an enterprise must pay for the environmental load associated with production of its good.
In the final analysis, we can show green responsibility through the way we live our lives, the way we shop, and through our daily behaviour and routines. Furthermore, the better we understand the connection between high politics about the environment and our daily actions, the better we will understand the significance of making the right choice and showing the right responsibility.
Version 1.0 July 2007, © Danish Environmental Protection Agency