Nature & Environment
Danish and global water resources
We consume water every day: for drinking, for cooking, for sanitation. the quality of this water matters greatly to our health. in Denmark, we get almost all of our drinking water directly from the groundwater. Water is also an important part of nature and is habitat for many plants and animals. Protecting our water resources is not merely a question of ensuring enough and good drinking water. We use water bodies for recreational purposes and house prices reveal that we gladly pay extra for a house with a view over water. However, clean water is not an inexhaustible resource. therefore, it is important that we safeguard our water resources, by limiting our consumption and by protecting the water from pollution.
all water bodies, throughout the world, are interlinked in a cycle. through precipitation, leaching, run-off and evaporation, water is being transported continuously between groundwater, soil, lakes, watercourses and rivers, oceans, glaciers, ice caps and the atmosphere. the water in the world's rivers is exchanged about 22 times during a year. manmade impacts on one part of the cycle have consequences for the entire water cycle. For example, pollution of the groundwater due to use of fertilisers and pesticides by agriculture will impact the condition of water in both lakes, water courses and the sea.
The size of resources
Calculations from 2003 and subsequent model calculations have revealed that Denmark has less groundwater available than expected. the water available in Denmark for exploitation comes to 1.0 billion m³ annually, taking into account e.g. measures aimed to protect watercourses. this is almost 50 per cent less than in 1992, when total water resources were calculated at 1.8 billion m³ annually. the new statement includes the entire freshwater cycle and takes account of the fact that the impact on watercourses and nature limits the amounts that can be extracted from the groundwater.
Percolating contamination, which impairs the quality of the upper groundwater, has also meant that part of this resource cannot be utilised for a number of years. as annual consumption in recent years has been between 0.6 and 0.7 billion m³, there is enough groundwater at national level to cover the need. However, the water resources are not always where the need for water is greatest, for example around large cities, and regional distribution of water resources may be necessary in future. During dry summers, agriculture, among others, will exploit existing irrigation licenses to the full and during droughts, when licenses for using water for field irrigation are exploited to the limit, in many places in Denmark more groundwater will be used than is actually available.
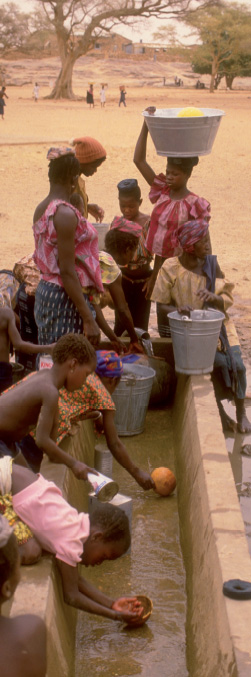
The water supply in Denmark consists of many small and some large water works, nearly all of which supply the population with clean and untreated water. Danish drinking water supply is unique, as 98 per cent of the water stems from groundwater reservoirs. in most other european countries a large part of the water is treated surface water, which is not nearly as well protected against contamination. in Denmark, therefore, treatment of drinking water has not been necessary to any great extent, although within the past 10-20 years more contaminated wells and reservoirs have been observed. However, the water we get today is cleaner than it was ten years ago. this is because the water works are now extracting deep-lying groundwater which has not been contaminated by e.g. pesticides. matters are far worse in large parts of the world where two billion people today are without clean drinking water.
15 Water consumption and prices
Source: Danva and the Danish Environmental Protection Agency
This indicator shows changes in household water consumption (litres per person per day) in relation to changes in the average water price paid by consumers (DKK per m³). From 1993 to 2002 there was an unbroken fall in household water consumption. in this period, consumption went down by about one quarter. this means that the rise in consumption in 2003 is the first since 1989.
The price of water increased by more than 150 per cent between 1993 and 2003, i.e. the price of one m³ water has become 2.5 times more expensive over a decade. the correlation between increasing water prices and the fall in household water consumption confirms the effect of green taxes as an incentive to save water. in the coming years, further increases in water prices are to be expected. reasons include greater expenditures for water works, as they will have to pay compensation for limitations on land use to protect the groundwater.

16 Pesticides in the water
Source: The Geological Survey of Denmark and Greenland
The trend in observations of pesticides in the period 1990-2004 in groundwater monitoring. the figure shows the proportion of wells where pesticides
or breakdown products from these have been observed in the national groundwater monitoring system.
In 2004, pesticides or breakdown products from pesticides were observed in every third groundwater intake examined. the limit value for drinking water was exceeded in more than every ten groundwater intakes.
The rising curve reflects the fact that up through the 1990s water samples have been analysed for more substances. overall, pesticides have been found in almost half of the wells examined, and in about 17 per cent of the wells the limit value for drinking water was exceeded.
17 Pesticide observations by soil depth
Source: The Geological Survey of Denmark and Greenland
By far the majority of the substances observed stem from upper groundwater located 0-40 metres below ground level and they may, in time, influence the groundwater located further down. By far the majority of the observed pesticides are today subject to regulations or have been banned.
The graph shows the development in the number of wells where pesticides have been observed at three depth intervals (0 to 30 metres below ground level). From 2000 to 2004, there is a slight, steady increase in intakes impacted by pesticides at all three levels, even though the number of substances analysed was constant. the increase in the 1990s is due to expansion of the analysis programme.
Version 1.0 July 2007, © Danish Environmental Protection Agency