Waste Statistics 2005
Preface
ISAG
The ISAG (Informations System for Affald og Genanvendelse - information system for waste and recycling) was used for the first time in 1993. The 2005 report is the thirteenth consecutive report.
The ISAG is based on statutory registration and reporting from Danish waste-treatment plants for all waste entering or leaving the plants. Information concerning waste in the previous year must be reported to the Danish Environmental Protection Agency each year, no later than 31 January.
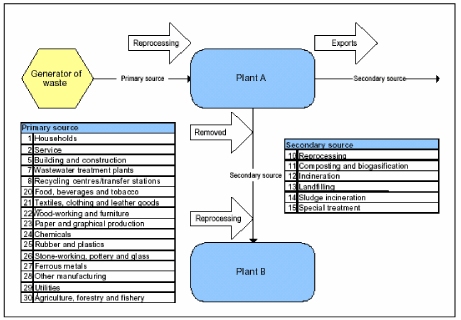
In order to avoid double reporting, it is important to distinguish between waste from direct (primary) sources and waste from plant (secondary) sources. The principle behind registration in the ISAG is shown below.

The Danish EPA carries out quality assurance of the information it receives and collects additional information from sector organisations and other sources. Each year the Danish EPA prepares a publication called "Waste Statistics", which gives an overview of waste composition and waste arisings in Denmark.
The publication also calculates the quantities of waste recycled, incinerated, and landfilled relative to the total waste amounts. Information is analysed between commercial sources and waste types.
New methods
Since 2001 data have been reported according to new rules set out in Statutory Order No. 619 of 27 June 2000 on waste (Statutory Order on Waste). These new rules have entailed a number of changes to the ISAG. For example, the source "manufacturing etc." was discontinued, so that since 2001 breakdown of industrial waste has been divided between 11 sectors.
Since 2001 there has been a shift between sectors in that waste volumes from industry have been falling, while waste volumes from the service sector have been rising. Waste volumes from industry thus fell by 37 per cent in the period 2000 to 2005, whereas in the service sector volumes increased by 65 per cent. From 2004 to 2005 waste volumes from industry and the service sector remained unchanged. That waste volumes from these two sources changed in the previous years may be due to faulty reporting as the source "manufacturing etc." was discontinued from 2001.
Structural changes, i.e. the fact that society is changing from an industrial to a knowledge society, may be another reason for the shift between the two sectors. The shift could be supported e.g. by the fact that from the early 1990s to 2003, the number of enterprises in traditional industry went down, while the number of new enterprises in the knowledge services industry increased dramatically.[1]
Packaging waste is a fairly new waste type in the ISAG and it does not yet reflect the total amount of cardboard and plastic packaging waste collected for recycling in Denmark. Parties reporting to the ISAG are therefore encouraged to be especially aware of this reporting possibility.
The principles for categorising waste from recycling centres/transfer stations with regard to the fractions glass and paper and cardboard have likewise been changed compared to the years 1994 to 2000. See Annex 2 for a more detailed explanation of the principles for this re-categorisation.
Please note that the changes to the way data is reported to the ISAG mentioned above, mean that care should be taken when comparing waste arisings at sector level from 2001 and later with waste arisings from previous years.
The government's Waste Strategy 2005-2008 presents a shift in focus from use of waste arisings as the only indicator for target fulfilment, to the supplementary use of new waste indicators for resource loss and environmental impacts.
Reading guide
Waste Statistics 2005 follows the same structure as previous reports: Chapter 1 describes general trends in waste generation, while Chapter 2 deals with waste recycling.
Chapter 3 deals with generation and treatment of hazardous waste, and Chapter 4 describes developments in imports and exports, both for ordinary waste and waste subject to mandatory notification.
Chapter 5 describes developments in waste arisings and treatment of waste from individual sources. Furthermore, this Chapter assesses the level of achievement of targets for treatment in the Danish government's Waste Strategy 2005-2008.
Chapter 6 presents the latest figures for the number of Danish incineration plants and landfills.
In Chapter 7 the trend in waste arisings is compared with overall economic growth to show how these relate to each other. Furthermore, this chapter takes a look at expected future waste arisings.
For the first years, tables and figures will show figures for every second year; whereas for the most recent years, there will be figures for each year. This is due to visual scope and to make it possible to present the tables in a format big enough to read.
[1] Statistical Ten-Year Review 2006. Statistics Denmark.
Version 1.0 September 2007, © Danish Environmental Protection Agency