Waste Statistics 2005
7 Economic development and projection of waste arisings for incineration
- 7.1 Waste arisings and economic development
- 7.2 Projection of waste arisings
- 7.3 Baseline projection of waste arisings 1994 to 2020
7.1 Waste arisings and economic development
Waste generation is a result of all activities in society. The challenge is to decouple the increase in waste volumes from general economic growth. Responsibility for solving the problem of increasing volumes of waste is shared by all sectors of society. The initial goal is thus to ensure that the increase in waste generation does not occur at the same rate as the increase in economic development.
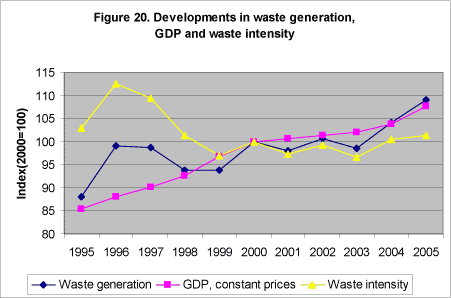
Figure 20 shows that total waste arisings increased faster than economic growth in the period 1995 to 1996. This was followed by a decline in arisings, and yet another increase during 1999 to 2000. Danish waste arisings remained fairly stable in the period 2000 to 2003, but increased dramatically in 2004 and 2005, e.g. due to increased amounts of construction and demolition waste.
If total waste generation is shown in proportion to gross domestic product (GDP), it provides an indication of the waste intensity in society.

The figure shows the relative development of gross domestic product in constant prices[25] (GDP) and waste production and waste intensity, illustrating the ratio between the relative development of waste production and the relative development of GDP. As can be seen from the figure, waste intensity declined until 1999 (decoupling) and has subsequently remained relatively constant, apart from slight increases in 2004 and 2005. This means that, by and large, the growth in waste arisings has corresponded to the growth in GDP since 1999, however with a slight upward trend in waste intensity. This development, therefore, does not indicate a decoupling; rather it indicates a fairly stable relationship between growth in waste volumes and economic growth, stated as GDP.
Since waste arisings in a number of sectors are increasing, it is important to continue to work towards reducing the volumes of waste. Forecasts for future waste generation show that waste volumes will increase, unless active efforts are made to reduce them. This can be seen, for example, in the European Environment Agency's report, "Environment in EU at the turn of the century".
As the basis for future waste planning, it is therefore necessary to have an idea of the increase in waste arisings in future. A model projection of waste arisings up to 2020 is presented in the following.
7.2 Projection of waste arisings
The following is a baseline projection of waste arisings up to 2020. The so-called FRIDA model has been used for this projection[26].
The projection is based on the Ministry of Finance’s projection of economic growth Finansredegørelse 2006 (budget statement 2006), the Danish Energy Authority's most recent projection of coal consumption from 2005[27], and waste data from ISAG for the period 1994 to 2004.
FRIDA describes the trend in waste arisings for the individual fractions and sources in ISAG in relation to economic development. FRIDA is therefore a hybrid of a scenario model and an econometric model. For the large waste streams, the relationship between economic development and developments in waste arisings is identified by performing an econometric analysis of the period 1994 to 2003. This means that for these waste streams, an analysis is performed which determines the connection between trends in waste arisings and economic activity in society. Subsequently, the development in waste arisings is projected on the basis of the assumption that the relationship between the economy and waste arisings will be remain the same in future as in the period 1994 to 2003. The analysis thus takes into account the fact that production technologies may have changed over time, as may the relationship between consumption and production. Other factors may also be of significance. The large waste fractions include:
- Various combustible
- Various non-combustible
- Paper and cardboard
- Organic waste
- Ferrous metal
- Construction waste
For the other waste streams, developments are described in a scenario model which assumes constant waste coefficients. That is, the model assumes a constant relationship between waste arisings and economic development.
The FRIDA model is used to project waste arisings up to 2020.
7.3 Baseline projection of waste arisings 1994 to 2020
The waste prognosis is based on the Ministry of Finance’s ADAM projection from 2006. In the period 2004 to 2020, total production (in constant prices) is expected to increase by about 29 per cent, and private consumption is expected to increase by about 37 per cent. Figures on coal consumption by industry and power plants from the Energy Authority are on the assumption that consumption by power plants will drop towards 2020, while consumption by industry will go up.
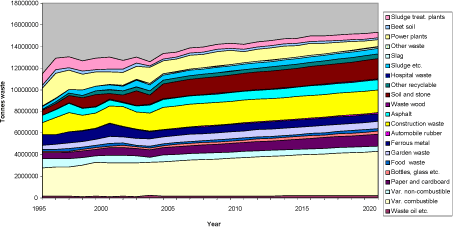
Actual waste arisings increased from 1994 to 2004 by around 20 per cent (see Table 1). A projection of primary waste amounts 2004 to 2020 gives an increase in arisings of around 14 per cent, from around 13.4 million tonnes of waste in 2004 to an overall waste volume of around 15.3 million tonnes in 2020, cf. Figure 21[28].
A comparison of the increase in waste arisings with the increase in production and consumption respectively gives a projection in which waste arisings will increase less than the economic growth. One important reason for the smaller increase in waste arisings is falling coal consumption by power plants, which means that the amount of slag and ashes etc. from the power plants is at least expected to halve.
Figure 21. Trends in primary waste arisings

As can be seen from Figure 21, the baseline projection shows a significant increase in the amounts of various combustible, paper and cardboard, construction and demolition waste and soil and stone. The most important reason for this increase can primarily be traced to the projection of private consumption, which is expected to increase by around 37 per cent up to 2020. In contrast, a drop in the amount of non-combustible waste from power plants is anticipated.
About 50 per cent of combustible waste originates from households. This rate has been decreasing over recent years, whereas there has been a dramatic increase in the amount of combustible waste from the service sector. The amount of combustible waste from industry has shown a downward trend. However, there is uncertainty as to the development of waste arisings from industry and the service sector in particular (cf. Chapter 1). In the projection it is therefore assumed that the increase in service-sector waste volumes is unlikely to continue at the same pace, but that it will increase in step with economic growth. Amounts of waste from industry are assumed to continue in step with economic growth. The amount of combustible waste from households, on the other hand, is not assumed to increase in step with economic growth; here a decoupling from the economic development is expected.
From 1994 to 2004 the total amount of collected waste paper and cardboard will increase by about 92 per cent, amongst other things due to expansion of the collection scheme (see Table 5). It is however assumed that the consumption of paper and cardboard by households, the service sector and industry will follow the economic development.
Amounts of construction and demolition waste have fluctuated over time. From 1994 to 2004, amounts increased by 85 per cent, however (see Table 3). As can be seen from Figure 21, construction and demolition waste volumes are expected to increase up to 2020. The main reason for this increase is that building and construction activities are assumed to follow the economic development. With expected greater consumption, construction and demolition waste must be expected to increase as well.
The amount of various non-combustible waste decreased significantly from 1994 to 2004. This is due e.g. to increased source separation and, consequently, an increased amount of waste being recycled. It is uncertain whether this trend will continue or whether there is actually a saturation point for how much can be separated for recycling etc. However, in the model this trend is assumed to continue up to 2020.
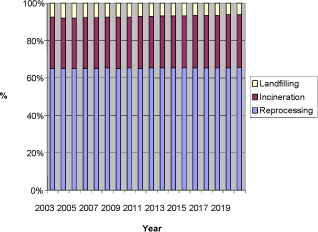
As can be seen from Figure 22, no great changes are expected in the amount of waste for recycling. Where about 65 per cent was recycled in 2004, it is expected that 65.5 per cent will be recycled in 2020. Where 26 per cent was incinerated in 2004, it is expected that about 28.3 per cent will be incinerated in 2020. The rate of waste led to landfill is expected to drop from 8 per cent in 2004 to 6.2 per cent in 2020.
Figure 22. Trends in the breakdown of treatment options

[25] Constant prices are prices for the year adjusted for inflation, and are thus an indicator of real growth.
[26] En model til FRemskrivning af ISAG DAta. FRIDA (FRIDA, a model for projection of ISAG), Working Report No.35, 2006, from the Danish EPA.
[27] Energy Strategy 2025, the Danish Ministry of Transport and Energy.
[28] Note that e.g. amounts of paper and cardboard are not an expression of the total potential of this fraction, but merely state the amount of paper and cardboard separated for recycling. The fraction combustible waste thus may also contain paper and cardboard and other recyclable fractions.
Version 1.0 September 2007, © Danish Environmental Protection Agency