Working Report No. 28, 2007
Practical tools for value transfer in Denmark – guidelines and an example
Contents
2 National and international value transfer: Methodological issues and validity
- 2.1 Value transfer methods
- 2.2 Unit value transfer
- 2.3 Function transfer
- 2.4 Validity of spatial value transfer
- 2.5 Currency Conversion
- 2.6 Differences in income between countries
- 2.7 Differences in culture between countries
- 2.8 Should values be the same in Denmark as EU average values?
- 2.9 Extent of the market
- 2.10 Adjusting values over time
3 Policy use and practices for value transfer
- 3.1 Policy use
- 3.2 Databases of valuation studies
- 3.3 Guidelines for primary studies and value transfer
- 3.4 Acceptable transfer errors
4 A Practical Value Transfer Guide
5 Applying the guidelines – An illustrative example
Appendix A:
Table of Danish primary valuation studies on priority environmental goods
Appendix B:
List of Danish valuation studies on priority environmental goods
Appendix C:
Review of databases for environmental valuation studies
Appendix D:
Summary of evaluation of selected
environmental valuation databases
Appendix E:
List of Danish valuation studies in EVRI
Appendix F:
Table of Swedish Studies from ValueBaseSWE
Appendix G:
Summary of value transfer validity tests for priority environmental goods
Appendix H:
Consumer Price Index (CPI) for Denmark, Norway
and Sweden
Appendix I:
Surface Water Quality Eutrophication Classification System for Norway
Preface
This report is written on behalf of Miljøstyrelsen (Danish Environmental Protection Agency). The main aim is to develop simple and user friendly, practical guidelines for value transfer, which are also scientifically defensible. Since value transfers most often occur both in time and space, the guidelines will address both these dimensions.
Robert Heidemann has been the contact person from Miljøstyrelsen throughout the project and provided very useful comments and guidance in this project.
The reference group, which has helped identify Danish valuation studies and provided helpful and constructive comments, has consisted of the following persons:
Mikael Skou Andersen, Damarks Miljøundersøgelser (National Environmental Research Institute)
Berit Hasler, Danmarks Miljøundersøgelser
Katja Birr-Pedersen , Damarks Miljøundersøgelser
Alex Dubgaard, Fødevareøkonomisk Institut, KVL (The Royal Veterinary and Agricultural University, Denmark)
Bo Jellesmark Thorsen, Skov og Landskab, KVL
Thomas Bue Bjørner, Det Økonomiske Råds sekretariat (Secretariat of the Danish Economic Council)
Lars Hoepfner Trier, Skov- og Naturstyrelsen (Danish Forest and Nature Agency)
Camilla K. Damgaard, Miljøstyrelsen
Jørgen Schou, Miljøstyrelsen
Mr. Jan Atle Liodden at Sweco-Grøner a.s. has proofread the report and prepared appendices A, B, F, H and I; in co-operation with his colleague Mr. Yngve Trædal.
I would like to thank all of you listed above for your valuable contribution to this report. The final report is, however, the sole responsibility of the author.In particular it should be noted that some members of the reference group have expressed different views on how to apply the guidelines in the Skjern River example in chapter 5, but all members agree on the general benefit transfer guidelines
The appendices are updated by December 2005.
Ståle Navrud
Drøbak
February 2007
Summary and conclusions
Practical guidelines for value transfer in Denmark
Based on the current state-of-the-art in validity of value transfer, simple unit value transfer is recommended instead of the theoretically more appealing value function transfer from a single primary valuation study (benefit function) or multiple studies (meta-analysis). A seven-step practical guideline is recommended for future value transfers. These guidelines should lead to more consistent, reliable and acceptable treatment of use and non-use values of environmental goods in economic analyses, e.g. cost-benefit studies.
Background and aim
This report is written on behalf of the Danish Environmental Protection Agency. The main aim is to develop simple and user-friendly, practical guidelines for transfer of economic estimates of changes in environmental goods from previous studies to current cases that are also scientifically defensible. Since value transfers most often occur in both time and space, the guidelines address both these dimensions.
The study
This report is written by Ståle Navrud with assistance from Jan Atle Liodden at Sweco-Grøner. The project manager Robert Heidemann and the project reference group have provided very valuable comments and input especially in terms of making the list and description of Danish valuation studies (see appendices A and B) as complete as possible.
Main conclusions
The main output from this project is the practical guidelines for value transfer, and an example illustrating how these guidelines can be applied both to use as well as non-use values of environmental goods. As a good basis for national value transfer, appendices A and B describe the primary Danish valuation studies on the priority environmental impacts for this report, which are: surface water quality, groundwater quality, marine and coastal areas, soil quality, landscape (aesthetics, cultural heritage and recreation aspects of e.g. forests and moorland), ecosystem functions and biodiversity. Due to the limited number of primary Danish valuation studies for most of these goods, and the diversity in valuation methodologies and site–specificity of forest areas (for which many studies exist), it is not justifiable to construct general unit values for transfers. However, reviews and data bases of Danish and European primary valuation studies can be used together with the suggested step-by-step guidelines to perform value transfer, as illustrated by the transfer of use and non-use values for the Skjern River restoration project. This case study shows that the suggested step-by-step practical guidelines simplify the value transfer exercise, avoid arbitrary assumptions (which are easy to criticise), and use assumptions that rather underestimate rather than overestimate the environmental values. This is expected to improve the reliability and acceptability of cost-benefit analyses involving the priority environmental goods.
Results
Unit value transfer is recommended as the simplest and most transparent way of transfer both within and between countries. This transfer method has generally also been found to be just as reliable as the more complex procedures of value function transfers and meta-analysis. This is mainly due to the low explanatory power of willingness-to-pay (WTP) functions of Stated Preference studies and the fact that methodological choice, rather than the characteristics of the site and affected population, has a large explanatory power in meta-analyses. When making unit transfers of values from a Danish primary study over time, the Danish Consumer Price Index (CPI) should be used as an approximation to convert values for environmental goods into 2005-DKK (see appendix I for CPI for Denmark). For transfer from primary valuation studies from other countries, countries with a similar cultural, legal and institutional structure should be chosen; which in practice would mean to look for Nordic studies first, then studies from other European countries and finally the US. For unit transfers between countries, the differences in currency, income and cost of living between countries should be taken into account by using exchange rates adjusted for Purchase Power Parity (PPP); see http://www.oecd.org/dataoecd/61/56/1876133.xls . Values from the primary study should be converted to DKK at the time of the collection of data, and then converted to 2005-DKK using the Danish CPI.
The recommended units of transfer for use and non-use values are:
i) use value: Consumer surplus per activity day of recreation. Consumer surplus per year (or per visit) per visitor could also be used, but then the average number of activity days per year (or per visit) should be the same at the study and policy sites.
ii) non-use value: WTP/household/year, and not converted to a “per hectare” basis, as WTP does not vary proportionally with the area of e.g. an ecosystem. Rather, WTP/household-values should be transferred from a site of about the same size with similar type environmental goods of the same level of uniqueness (in terms of being a site of local, regional, national or global importance).
The proposed practical guidelines have the following seven steps:
1) Identify the change in the environmental good to be valued at the policy site
(i) Type of environmental good
(ii) Describe baseline, magnitude and direction of change in environmental quality
2) Identify the affected population at the policy site
3) Conduct a literature review to identify relevant primary studies
4) Assess the relevance and quality of study site values for transfer
(i) Scientific soundness; the transfer estimates are only as good as the methodology and assumptions employed in the original studies
(ii) Relevance; primary studies should be similar and applicable to the “new” context
(iii) Richness in detail; primary studies should provide a detailed dataset and accompanying information
5) Select and summarise the data available from the study site(s)
6) Transfer value estimate from study site(s) to policy site
(i) Determine the transfer unit
(ii) Determine the transfer method for spatial transfer
(iii) Determine the transfer method for temporal transfer
7) Calculate total benefits or costs
The use of these guidelines is illustrated by applying them to the Skjern River nature restoration project.
Other sources of information
For further reading, we would recommend the in-depth treatment of value transfer, with an application to health and environmental effects from air pollution:
Desvousges, W.H, F. R. Johnson and H.S. Banzhaf 1998: Environmental Policy Analysis with Limited Information. Principles and Applications of the Transfer Method. New Horizons in Environmental Economics. Edward Elgar, Cheltenham, UK and Northampton, MA, USA.
For a review of applications of value transfer to use and non-use values of the priority environmental goods of this report and detailed descriptions of selected validity tests see:
Navrud, S. and R. Ready (eds.) 2007: Environmental Value Transfer: Issues and Methods. Springer , Dordrect, The Netherlands.
1 Introduction
1.1 Value transfer
Due to limited time and resources when decisions have to be made, new environmental valuation studies often cannot be performed, and decision makers try to transfer economic estimates from previous studies (often termed study sites) of similar changes in environmental quality to value the environmental change at the policy site. This procedure is most often termed benefit transfer, but could also be transfer of damage estimates. Thus, a more general term is value transfer, which will be used throughout this report to cover transfer of both benefits and costs/damages.
The practice of value transfer can be traced back to be the calculation of lost recreational value from the Hell´s Canyon hydroelectric project 30 years ago (see Krutilla and Fisher 1975; chapters 5 and 6). The first large-scale user of value transfer, however, was the USDA Forest Service. In preparation for the 1980 Resource Planning Assessment (RPA) the Forest Service launched a large-scale effort to collect data on the economic values associated with recreational use of forestlands, in order to balance these against timber production and other uses. These early examples of value transfer were, however, conducted in an uncritical manner, often lacking sound theoretical, statistical and empirical basis, and did not question the validity of the transferred values. The validity of value transfer was placed firmly on the agenda more than ten years ago in a set of papers in a special section of a 1992- issue of Water Resources Research (vol. 28, no. 3). Since then there has been a steady growth in the literature on testing validity of benefit transfer, the development of transfer methods and statistical techniques, and applications of these to environment and health. A general review of these development can be found in Desvousges et al. (1998) and Navrud and Ready (2007).
1.2 Aim
The main aim of this project is to develop simple and user friendly, practical guidelines for value transfer, which are also scientifically defensible. Since value transfers most often occur both in time and space, the guidelines will address both these dimensions. A list of methodological issues and criteria for acceptable value transfer will be developed into a practical value transfer guide. The use of the guide will be illustrated by a “how to do it” – example for a selected policy case.
We will examine whether it is defensible to construct general unit prices for use values and non use values, based on existing valuation studies (and meta-analyses of these primary studies) of the environmental goods that Miljøstyrelsen gives priority to (excluding noise, and health and ecosystem impacts from air pollution, which will be covered in other projects). The environmental goods considered here include:
- Surface water quality (recreational (use) value, suitability for drinking water, and non-use value)
- Groundwater quality (suitability for drinking water and non-use value)
- Marine and coastal areas (recreational value and non-use value)
- Soil quality (use and non-use value)
- Landscape, e.g. woodland, moorland (aesthetics, cultural heritage and recreation)
- Ecosystem functions and biodiversity
Since we expect smaller transfer errors within a country we will first review the Danish valuation studies of these priority environmental goods. However, since the number of primary valuation studies in Denmark is rather limited, we will look into the possibilities and validity of international value transfer from studies from all Nordic countries and other countries available in databases and bibliographies of valuation studies.
The main focus of the guidelines for value transfer will be Contingent Valuation (CV) studies and other Stated Preferences (SP) surveys, but also the Revealed Preference (RP) approaches of Travel Cost (TC) and Hedonic Price (HP) studies (especially for national transfers as housing markets vary widely internationally) will be considered. Avertive costs, replacement costs and direct impacts on marketed goods (e.g. commercial fisheries and agricultural production) are regarded as outside the scope of this report, as these methods can often be based on site specific evidence of the magnitude of the impacts and the market prices at the policy site.
There are four basic requirements for performing effective and reliable value transfers:
- A complete, searchable database of primary environmental valuation studies; with access to the primary reports/ journal papers including the grey (unpublished) literature
- A list of “best practice” criteria for assessing the quality of primary valuation studies
- Guidelines for value transfer
- Decision rules for definition of acceptable transfer errors for different policy uses of the estimates
Each of these four basic requirements will be discussed in terms of the trade-off between what is theoretically correct and what can be used in practical decision-making. The report is organized as follows: Chapter 2 describes the value transfer methods, methodological issues and validity tests of transfers. Since the number of Danish studies is limited, chapter 2 also discusses international value transfer. Moving from national to international transfers could improve our basis for transfer in terms of the number of valuation studies we can transfer values from, but it also raises some additional methodological issues. Chapter 3 describes the different policy uses of environmental valuation estimates; databases for valuation studies, current guidelines and practices in value transfer, and ways towards determining the level of acceptable transfer errors in cost-benefit analyses. Chapter 4 describes the main steps of a practical value transfer guide, and chapter 5 illustrates the use of the guide.
Appendices A and B list and review the Danish valuation studies for the selected environmental goods based on best practice criteria for assessing the quality of primary valuation studies. Appendix H provides the Consumer Price Index for Denmark, used to adjust values in Appendix A into 2005-DKK. Appendices C and D review the databases and bibliographies of valuation studies, and evaluates their use for Miljøstyrelsen in Denmark. Appendix E lists all the Danish studies in the database EVRI, while appendix F reviews relevant Swedish studies from the database VALUEBASESWE, and provides a link to OECD’s Purchase Power Parity (PPP) corrected exchange rates. Appendix G reviews results from several spatial value transfer validity tests.
2 National and international value transfer: Methodological issues and validity
- 2.1 Value transfer methods
- 2.2 Unit value transfer
- 2.3 Function transfer
- 2.4 Validity of spatial value transfer
- 2.5 Currency Conversion
- 2.6 Differences in income between countries
- 2.7 Differences in culture between countries
- 2.8 Should values be the same in Denmark as EU average values?
- 2.9 Extent of the market
- 2.10 Adjusting values over time
2.1 Value transfer methods
There are two main approaches to value transfer (Navrud 2004):
1. Unit Value Transfer
i) Simple unit transfer
ii) Unit Transfer with income adjustments
2. Function Transfer
i) Benefit Function Transfer
ii) Meta-analysis
2.2 Unit value transfer
Simple (or naïve) unit transfer assumes that the well being experienced by an average individual at the study site is the same as will be experienced by the average individual at the policy site. Thus, we can directly transfer the benefit estimate, often expressed as mean willingness-to-pay (WTP) per household per year.
For the past few decades this procedure has routinely been used in the United States to estimate the recreational benefits associated with multipurpose reservoir developments and forest management. The selection of these unit values could be based on estimates from only one or a few valuation studies considered to be close to the policy site (both geographically and in terms of the good valued), or based on an average WTP estimate from literature reviews of many studies. Walsh et al. (1992, table 1) present a summary of unit values of a day spent in various recreational activities, obtained from 287 Contingent Valuation (CV) and Travel Cost (TC) estimates. Rosenberger and Loomis (2001) updated this for the USDA Forest Service and provide an annotated bibliography of studies from 1967 to 1998 (covering 21 recreational activities plus a category for wilderness recreation) with a total of 163 individual studies referenced, providing 760 benefit measures. They also provide value transfer guidelines and a decision tree to determine how to obtain values for recreational activities.
The obvious problem with this transfer of unit values for recreational activities is that individuals at the policy site may not value recreational activities the same as the average individual at the study sites. There are two principal reasons for this difference. First, people at the policy site might be different from individuals at the study sites in terms of income, education, religion, ethnic group or other socio-economic characteristics that affect their demand for recreation. Second, even if individuals´ preferences for recreation at the policy and study sites were the same, the recreational opportunities (substitute sites and activities) might not be. Unit values for other use values, e.g. groundwater and surface water for drinking, should be based on WTP/household/year (as this is often paid as an annual water fee, which is also the payment vehicle used in many SP studies).
Unit values for non-use values[1] of e.g. ecosystems from CV studies might be even more difficult to transfer than recreational (use) values for at least two reasons. First, the unit of transfer is more difficult to define. While the obvious choice of unit for use values (typically from Travel Cost studies or Contingent Valuation surveys) is consumer surplus (CS)[2] per activity day (defined as one individual performing the activity for some period of time during one day), there is greater variability in reporting non-use values from CV (and other Stated Preference (SP) methods), both in terms of WTP for whom, and for what time period. WTP is reported as per household or per individual, and as a one-time payment, annually for a limited time period, annually for an indefinite time, or even monthly payments. Second, the WTP is reported for one or more specified discrete changes in environmental quality, and not on a marginal basis. Therefore, the magnitude of the change at the study and policy sites should be close, in order to get valid transfers of estimates of mean, annual WTP per household. Also the initial levels of environmental quality should be close if one should expect non-linearity in the benefit estimate or underlying physical impacts. Since WTP to avoid a loss in environmental quality typically would be valued higher than a similar gain in environmental quality due to loss aversion (and there is no general estimate of the difference in value), the direction of environmental change should be the same at the policy and study sites. If the selected study for transfer values a gain while the policy question involves a loss of similar magnitude, we could still use the transferred estimate as a lower estimate. In the opposite case, we know that the transferred estimate is an overestimate, but unfortunately not by how much.
Mean WTP is the correct welfare measure, but since estimated mean WTP from dichotomous choice (DC) contingent valuation is very sensitive to distributional assumptions, median WTP could be used in a sensitivity analysis as a lower, conservative estimate. Mean WTP from open-ended (OE) questions should be corrected for protest zero answers before being transferred to avoid underestimation of WTP.
Since CV studies value discrete rather than marginal changes, attempts have been made to construct unit value expressed e.g. pr ha of an ecosystem. The results from a CV survey in terms of WTP/household/year would then be multiplied by the number of “affected” households, and then divided by the e.g. area of the ecosystem preserved. The size of the area in question could be calculated manually or using GIS; see e.g. the approach developed by the EcoValue project at the University of Vermont http://ecovalue.uvm.edu. In Choice Experiment (CE) studies similar marginal values are calculated more directly from the CE model based on the choices respondents make, but respondents still choose between discrete changes in the environmental good. In addition to the uncertainty in conversion from discrete to marginal values, there is a need to develop ways to adjust for differences in population density when transferring unit values pr. ha across sites. Therefore, at the present, unit transfers in terms of WTP/household/year for a specified change in environmental quality seem to be the only defensible way to transfer non-use values.
Although some economists have raised awareness of the need to pay attention to the spatial and ecological characteristics of sites in relation to transfers (Bateman et al 2002; Eade & Moran 1996; Lovett et al 1997; Ruijgrok 2001), practitioners in the field have not yet effectively standardized the decomposition of transfers into spatially homogeneous units, which are widely recognized as being similar at different locations. Since ecologists have developed such classifications (i.e., land cover types), it is useful to explore whether it is possible to determine the economic values for the ecological goods and services provided by similar ecosystem types, and then transfer those values from one location to another using basic ecological principles (de Groot et al. 2002; Farber et al. 2002) [3]. The valuation step is often a part of a damage function approach (DFA; see figure 1). Therefore, a linkage has to be developed between the units of the endpoints of dose-response functions, and the unit of the economic estimates. This has been done successfully for e.g. visibility changes at US national parks (measured as percentage change in miles of visibility; see Smith and Osborne 1996[4]), health impacts (Alberini et al. 2004, Ready et al. 2004, EC DG Environment 2000), and annoyance from road transportation noise (Navrud 2002; EC DG Environment 2002).
Figure 1. Damage Function Approach (DFA) applied to water quality
For water quality a co-ordinated international classification of eutrophication of surface water taking into consideration different natural conditions and based on the suitability for drinking water and different recreational activities is now being developed. However, contingent valuation studies of national classifications of eutrophication levels in terms of the four levels: ”Drinkable”, ”Swimmable”, Fishable”, and ”Boatable” have already been conducted in e.g. Norway, Germany, UK, Poland and the Czech Republic; see appendix I for the classification used in CV-studies in Norway. These classifications are based directly on the levels of biological and chemical oxygen demand (BOD and COD). These levels correspond to the endpoints (resulting maximum and minimum levels of BOD and COD) when dose-response functions between increased concentration of nitrates and phosphates in the water bodies from increased depositions of these nutrients, and the resulting level of BOD and COD, are applied for a relevant range of deposition levels.
A similar type, five-level classification system has been developed for general ecological status of water quality within the EU Water Framework Directive (WFD). The concept of ”ecological status" and its five levels have not been defined in detail yet, but it is clear that it represents a wider set of parameters than the chemical and biological measures of water quality (e.g. euthrophication indices like Biological and Chemical Oxygen Demand). Recently, Danmarks Miljøundersøgelser has developed a similar five-level system for the state of terrestrial ecosystems. If these classification systems for the state of aquatic and terrestrial ecosystems can be linked to pollutants and other environmental pressures through dose-response functions (or expert assessments), and people understand the differences between the levels in the classification system, they can be used in Stated Preference studies and value transfer exercises in CBAs of measures to achieve improved ecological status. Hanley and Wright (2003) present an application to aquatic ecosystems using this classification system. They performed a Choice Experiment to value improvements to the ecology of two rivers in the UK, chosen as broadly representative of the kind of water bodies in the UK where moderate improvements in water quality are likely to be needed in order to meet ”Good Ecological Status” according to the WFD.
The simple unit value transfer approach should not be used for transfer between countries with different income levels and costs of living. Therefore, unit transfer with income adjustments has been applied.
The adjusted value estimate Vp' at the policy site can be calculated as
Vp' = Vs (Yp / Ys) β (1)
where Vs is the primary value estimate from the study site, Ys and Yp are the income levels at the study and policy site, respectively, and β is the income elasticity of demand for the environmental good in question. There is, however, little empirical evidence on how the income elasticity of demand β for different environmental goods and health impacts varies with income.
The primary assumption in adjusting WTP values in proportion to some measure of income is that the income elasticity of WTP is 1.0. However, there is no reason to think that WTP for environmental quality varies proportionally with income.
When we lack data on the income levels of the affected populations at the policy and study sites, Gross Domestic Product (GDP) per capita figures have been used as proxies for income in international benefit transfers. However, Barton (1999) clearly shows how this approach could give wrong results in international value transfers when income levels at the study and/or policy site deviates from the average income level in the countries.
2.3 Function transfer
Transferring the entire benefit function is conceptually more appealing than just transferring unit values because more information is effectively taken into account in the transfer. The benefit relationship to be transferred from the study site(s) to the policy site could be estimated using either revealed preference (RP) approaches like TC and HP methods or stated preferences (SP) approaches like the CV method and Choice Experiments (CE). For a CV study, the benefit function can be written as:
WTPij = b0 + b1Gj + b2 Hij + e (2)
where WTPij = the willingness-to-pay of household i at site j, Gj = the set of characteristics of the environmental good at site j, and Hij = the set of characteristics of household i at site j, and b0 , b1 and b2 are sets of parameters and e is the random error.
To implement this approach the analyst would have to find a study in the existing literature with estimates of the constant b0 and the sets of parameters b1 and b2. Then the analyst would have to collect data on the two groups of independent variables G and H at the policy site, insert their mean values in equation (1), and calculate households´ WTP at the policy site.
The main problem with the benefit function approach is due to the exclusion of relevant variables in the WTP (or bid) function estimated in a single study. When the estimation is based on observations from a single study of one or a small number of recreational sites or a particular change in environmental quality, a lack of variation in some of the independent variables usually prohibits inclusion of these variables. For domestic benefit transfers researchers tackle this problem by choosing the study site to be as similar as possible to the policy site.
Benefit functions enable the calibration of the function to differences between the study site for which the function was developed and the policy site to which the function is applied (Loomis 1992; Parsons and Kealy 1994; Bergland et al. 1995; Kirchhoff et al. 1997 (for the bird-watching model only)). Although theoretically superior to unit transfer, the validity transfer tests (see appendix G for a review) suggest that in practice function transfers do not perform better than unit transfers. This is mostly due to the fact that very often benefit functions have low explanatory power due to omitted variables. This is especially true from Stated Preference methods, and less so for Travel Cost models for recreational activities and Hedonic Price models. Thus, unit transfer might work just as well, or even better, for both use and non-use values from Stated Preferences studies
Instead of transferring the benefit function from one selected valuation study, results from several valuation studies could be combined in a meta-analysis to estimate one common benefit function. Meta-analysis has been used to synthesize research findings and improve the quality of literature reviews of valuation studies in order to come up with adjusted unit values. In a meta-analysis, several primary studies are analysed as a group, where the result from each study is treated as a single observation in a regression analysis. If multiple results from each study are used, various meta-regression specifications can be used to account for such panel effects.
The meta-analysis allows us to evaluate the influence of a wider range in characteristics of the environmental good, the features of the samples used in each analysis (including characteristics of the population affected by the change in environmental quality), and the modelling assumptions. The resulting regression equations explaining variations in unit values can then be used together with data collected on the independent variables in the model that describes the policy site to construct an adjusted unit value. The regression from a meta-analysis would look similar to equation 2), but with one added independent variable; Cs = characteristics of the study s (and the dependent variable would be WTPs = mean willingness-to-pay from study s).
Smith and Kaoru’s (1990) and Walsh et al.´s (1990, 1992) meta-analyses of TC recreation demand models using both summary of TC and CV studies for the USDA Forest Service’s resource planning program were the first attempts to apply meta-analysis to environmental valuation. There have also been applications to CV studies of both use and non-use values of water quality improvements (Magnussen 1993), CV studies of groundwater protection (Boyle et al 1994), TC studies of freshwater fishing (Sturtevant et al. (1995), CV studies of visibility changes at national parks (Smith and Osborne 1996), CV studies of endangered species (Loomis and White 1996), CV studies of environmental functions of wetlands (Brouwer et al. 1997), CV studies of landscape changes (Santos 1998), CV studies of WTP for waste water treatment in coastal areas (Barton 1999), and outdoor recreation (Shrestha and Loomis 2001).
Many of these meta-analyses of relatively homogenous environmental goods are not particularly useful for value transfer even within the US where most of these analyses have been conducted, because they focus mostly on methodological differences. Methodological variables like "payment vehicle", "elicitation format", and "response rates" (as a general indicator of quality of mail surveys) in CV studies, and model assumptions, specifications and estimators in TC and HP studies, are not particularly useful in predicting values for specified change in environmental quality at the policy site. This focus on variables describing the methodological choices is partly due to the fact that some of these analyses were not constructed for benefit transfer (e.g. Smith and Karou 1990, Smith and Huang 1993, and Smith and Osborne 1996). Another reason is that insufficient and/or inadequate information was reported in the published studies with regard to characteristics of the study site, the change in environmental quality valued, and income and other socio-economic characteristics of the sampled population. Particularly, the last class of variables would be necessary in international value transfer, assuming cross-country heterogeneity in preferences for environmental goods.
In most of the meta-analyses secondary information was collected on at least some of these initially omitted site and population characteristics variables, or for some proxy for them. These variables make it possible to value impacts outside the domain of a single valuation study, which is a main advantage of meta-analysis over the benefit function transfer approach. However, often the use of secondary data and/or proxy variables introduces added uncertainty. An example is a meta-analysis of recreational value of fishing using income data for the overall regional population in lack of income data for fishermen at the study site. On the other hand, the secondary data are more readily available at the policy site without having to do a survey of the fishermen at the policy site.
Most meta-analyses caution against using them for adjusting unit values due to potential biases from omitted variables and specification/measurement error of included variables. To increase the applicability of meta-analysis for value transfer, one should limit the scope of the analysis by selecting studies that are as similar as possible with regards to methodology, and thus be able to single out the effects of site and population characteristics on the value estimates. However, it is a problem that there are usually so few valuation studies of a specific environmental good that one cannot to do a statistically sound analysis.
2.4 Validity of spatial value transfer
Transfer errors arise when estimates from study sites are adapted to policy sites. These errors are inversely related to the degree of correspondence between factors describing the study site and the policy site. The degree that any of these factors affects value transfer accuracy is an empirical question. However, the greater the correspondence (or similarity) of the policy site with the study site, the smaller the expected error (Boyle and Bergstrom 1992; Desvousges et al. 1992).
In the value transfer validity tests, two or more parallel valuation studies are conducted at different sites. Then an imaginary transfer is conducted from a study site (or a pooled data set from several study sites) to a policy site where we have also performed an original study. The transferred value, WTPT, is then compared to the value estimated in the primary valuation study at the policy site, WTPP. The transfer error (TE) is calculated as the percent difference between the transferred estimate and the policy site primary estimate:
 (3)
(3)
Ready et al. (2004) show in their transfer tests of CV estimates of respiratory illnesses in five European countries that even if the distribution of WTP had been the same in all countries, they would have measured an average transfer error of 16%. Thus, they point out the average transfer error of 38 % they did find between should be assessed relative to this background level of random sampling error.
Much academic work has taken place in the past 10 years, testing the validity in of alternative value transfer methods for different environmental goods. However, even fairly small transfer errors can be rejected using the classical statistical tests (usually t-tests with null hypotheses of transferred value being equal to the original value). Bergland et al. (1995, 2004) rejected value transfers statistically in cases of average transfer errors of less than 20 % in two CV studies performed simultaneously of similar water quality improvements in two closely located and similar lakes. However, the standards of accuracy required in academic work may exceed those viewed as tolerable by policy-makers, especially in cost-benefit analyses like those likely to be performed at the national level e.g. in relation to the the EU Water Framework Directive to prioritize alternative investments in water quality and to show disproportionate costs. Kristofersson and Navrud (2005) suggest the use of equivalence testing as more appropriate and a clear compliment to the shortcomings of the classical tests. Equivalence tests test the null hypothesis of difference between the original and transferred value estimates (which is in most cases what we would expect rather than similar values). Equivalence tests also combine the concepts of statistical significance and policy significance into one test, by defining an acceptable transfer error prior to the validity test[5]. For applications of these tests see Kristofersson and Navrud (2003) and Muthke and Holm-Mueller (2004).
Appendix G shows that errors in individual transfers vary a lot, both within and between different validity tests and for all transfer methods. Since some of the transfer validity tests are performed under ideal conditions (i.e. same SP survey instrument used on a similar good in a nearby location at the same point in time; e.g. Bergland et al. 1995) they might underestimate transfer errors in practical transfer exercises. However, surprisingly many of these validity tests are performed under less than ideal conditions, and probably reflect quite well the transfer errors in practical value transfers. Brouwer (2000) surveyed seven of these value transfer studies and found that the average transfer error is around 20-40% for unit value transfers, and as high as 225% for benefit function transfers. Ready et al. (2004), however, found an average transfer error of 38% in a multi-country transfer test both for unit and function transfer. Shrestha and Loomis (2001) found an average transfer error of 28% in a meta-analysis model of 131 US recreation studies. Santos (1999) found that an international meta-analysis of CV estimates of landscape features could obtain less than 30% transfer error in 26% of cases; and less than 50% transfer error in 44% of cases.
Several of the studies listed in Appendix G support the hypothesis that the greater the correspondence, or similarity, between the study site and the policy site, the smaller the expected error in benefit transfers. Lower transfer errors resulted from in-state transfers than from across-state transfers (Loomis 1992; Van den Berg et al. 2001). This is potentially due to lower socioeconomic, socio-political, and socio-cultural differences for transfers within states, or political regions, than across states. In the Loomis et al. (1995) study, their Arkansas and Tennessee multi-site lake recreation models performed better in benefit transfers between the two regions (percent errors ranging from 1% to 25% with a nonlinear least squares models and 5% to 74% with the Heckman models) than either one when transferred to California (percent errors ranged from 106% to 475% for the nonlinear least squares models and from 1% to 113% for the Heckman models). This suggests that the similarity between the eastern models implicitly accounted for site characteristic effects.
Van den Berg et al. (2001) show accuracy gains when they transfer values and functions within communities that have shared experiences of groundwater contamination than transferring across states, within states, or to previously unaffected communities.
Brouwer (2000) suggests that if non-use values are motivated by overall commitment to environmental causes, they may tend to be relatively constant across populations and contexts. In a contingent valuation survey of the national populations in all Nordic countries Kristofersson and Navrud (2005) found that transfer errors are consistently smaller for the non-use value of a preservation plan for Nordic freshwater fish stocks. The results for a non-use value scenario by non-anglers in Norway and Sweden produced average transfer errors below 20 %. Use values for anglers showed higher transfer errors. It may be that non-use value in these two countries is motivated by similar factors and is relatively context independent, while use value is more context specific. Clearly, this could be different for other environmental goods, particularly if the good has higher cultural significance in one country (or part of a country).
To summarize, the transfer validity studies conducted to date show that the average transfer error for spatial value transfers both within and across countries tends to be in the range of 25% - 40%. However, individual transfers could have errors as high as 100 - 200%. Function transfer does not seem to perform better than unit value transfer. Meta-analyses could also produce high transfer errors, and only those with a limited scope in terms of similar type environmental goods and similar type, state-of-the-art methodology, should be used. The validity tests also support the hypothesis that it is preferable to find a study site located close to the policy site of interest. The closer the study site is to the policy site, the more likely that both the good being valued and the user population affected will be similar, and therefore the transfer errors would be lower. Transfer validity tests also suggest that transfer errors are smaller if people have had experience with the environmental good in question. Current evidence from CV studies, however, is not clear whether transfer errors for use values are lower than for non-use values, at least not between countries. [6]
2.5 Currency Conversion
The first issue that must be addressed when conducting international benefit transfer is the conversion to a common currency. As will be shown, even in situations where the same currency is used in more than one country, there is still an issue related to currency conversion between countries.
Using the official exchange rates to convert the currency at the study to the currency of the policy site does not reflect the true purchasing power of currencies, since the official exchange rates reflect political and macroeconomic risk factors. If a currency is weak on the international market (partly because it is not fully convertible), people tend to buy domestically produced goods and services that are readily available locally. This enhances the purchasing powers of such currencies on local markets. To reflect the true underlying purchasing power of international currencies, the World Bank´s International Comparison Program (ICP) has developed measures of real Gross Domestic Product (GDP) on an internationally comparable scale. The transformation factors are called Purchasing Power Parities (PPPs); see also OECD’s list of PPPs at http://www.oecd.org/dataoecd/61/56/1876133.xls
Consider two individuals living in two different countries with the same preference structure over consumption of market goods, x, and the level of public goods available, Q. Under what circumstances would we expect these two individuals to have the same willingness-to-pay (WTP) for a change in the level of the public good? The individual in Country A has WTP for a change from Q0 to Q1 defined by the indirect utility function V:
V(IA, pA, Q0) = V(IA-WTPA, pA, Q1) (4)
where IA is income in Country A and pA is the price of market goods in Country A. If the exchange rate between the currency in Country A and the Currency in Country B is given by β, what do we know about WTPB relative to WTPA?
Because indirect utility functions are homogeneous of degree 0, we know that:
V(β*IA, β*pA, Q0) = V(β*IA- β*WTPA, β*pA, Q1) (5)
Therefore, the individual in Country B will have willingness to pay WTPB= β*WTPA only if he has income IB= β*IA and faces prices pB= β*pA. This last point is critical. Identical individuals using different currencies will have the same real WTP only if they have the same real income and face the same real prices. Thus, the appropriate exchange rate for converting values into a common currency is the exchange rate that equalizes market prices (see also Pattanayak et al. 2002).
This type of exchange rate is called a purchasing power parity (PPP) adjusted exchange rate. The Penn World Table includes a list of PPP-adjusted exchange rates for 168 countries, based on price surveys conducted by the OECD and the World Bank. PPP-adjusted exchange rates can differ markedly from financial exchange rates (the conversion rates offered in international financial markets). This issue has not disappeared as a result of currency unification with the EU. Even though e.g. both the Netherlands and Portugal now use the euro, there remain differences in market prices between the two countries. An individual living in the Netherlands with an annual income of 50,000 euros has a very different standard of living than an individual with identical preferences with the same income in Portugal, and will likely have different WTP for public goods.
When the policy site is smaller than an entire country, the analyst may need to worry about differences in prices even within a country; e.g. prices for market goods in Lisbon were 45% higher than the national average for Portugal. When city or regional PPP indices are available, those should be used to account for local differences in prevailing prices. This is true whether the benefit transfer is being conducted between countries or within a country. In the U.S., the American Chamber of Commerce Research Association (www.accra.org) calculates cost of living indices for more than 300 cities.
A more difficult issue is differences among countries in in-kind income. In many countries, health care, college tuition and retirement income are provided free of charge to all residents. These represent a supplement to the real income of the citizens in those countries. Citizens of these countries need to save less money for college expenses and retirement needs, and consequently can afford to pay more for public goods. The challenge is to quantify these types of in-kind income, so that total income can be measured in consistent ways across different countries.
To conclude, even if PPP adjusted exchange rates can be used to adjust for differences in income and cost of living in different countries, this will not correct for differences in individual preferences, cultural and institutional conditions between countries (or even within different regions of a country). An alternative is of course to restrict international benefit transfer to countries that are relatively similar with regards to in-kind income and most of the institutional setting; e.g. the Nordic countries.
2.6 Differences in income between countries
The most striking issue in international value transfer is differences in the level of incomes across countries. Even within the EU, average per capita Gross Domestic Product (GDP) measured in PPP terms varies by over a factor of five between the richest and the poorest countries. Because most existing valuation studies were conducted in the U.S. or Western Europe, international benefit transfer often involves transfer of a value from a high-income country to a low-income country. One common, simple approach to dealing with income differences between the study country and the policy country is to multiply unit values by the ratio of income in the policy country to income in the study country (or per capita GDP). This approach assumes that WTP varies proportionally with income, an assumption that is typically not found to hold within individual studies. Studies conducted within one country more typically show that WTP for environmental goods increases with income, but at less than a proportionate rate. Thus, using the income ratio as an adjustment will tend to undercorrect for income differences when the policy country is much richer than the study country.
A conceptually better approach is to apply a benefit function, i.e. WTP as a function of income. In order to estimate such a function, variability in income is needed in the source data. This variability typically comes from variation within the sample of users surveyed at the study site. For example, we may discover that WTP for a public good valued at a study site is higher for users with higher income. We use this variation to estimate a benefit function. If the average income at a policy site is higher or lower than that at the study site, the benefit function adjusts for that difference. A simple benefit function might include only income as the explanatory variable, and assume constant income elasticity of WTP. However, the benefit function could account for other measurable characteristics, and could take other forms (see chapter 2.4).
The value function approach is probably defensible when the difference in measurable characteristics between the study site and the policy site is small, so that the average at the policy site falls well within the range of observations at the study site. However, when conducting international benefits transfer, this may not always be the case. A valuation survey conducted in Northern Europe will include respondents with varying levels of income. However, few respondents will have incomes as low as those found in some developing countries. Simply plugging the average user characteristics from a low-income policy site into a value function estimated in a high-income country can lead to serious problems:
First, there is the familiar problem of extrapolating outside the range of the data. Particularly in socialized economies, the range of income within which most of the respondents fall may be fairly narrow. The variability in the data may not be sufficient to identify curvature in the relationship between income and WTP. But small changes in curvature have big implications when transferring the value function to a policy country where average incomes may be one tenth those of the study country.
The second issue is that the source of the variability, variation among individuals within the study country, is different from variation among countries. The implicit assumption is that two individuals in different countries will have the same WTP if they have the same income (appropriately converted). It is not clear, however, that a very wealthy individual in a poor country will necessarily have the same WTP for the public good as a poor individual in a wealthy country, if those two individuals have the same absolute real income. Relative income may matter as well. This is an issue that can only be adequately addressed by comparing value functions estimated from wealthy countries to value functions estimated from poorer countries. A related type of problem arises when transferring values from countries with large variations in income level, e.g.. USA, to Denmark and other Nordic countries with much less variation in income (and social security systems securing everybody a certain minimum level of income). This could easily make transfer from the US to Denmark more uncertain than transfers from other Nordic countries and European Countries with a more equal income distribution than the USA.
2.7 Differences in culture between countries
Not all factors that are important in determining values are measurable. Cultural heritage, shared values and shared experiences can also affect values for public goods. Values for cultural heritage goods and landscapes are probably especially sensitive to culture and shared experience. A highly-valued traditional landscape in Denmark may not evoke similar values in France and vice versa. A restored ecosystem in Norway would probably be valued lower than a similar restoration project in Denmark, due to both differences in cultural heritage and preferences for undisturbed nature and the higher availability of relatively undisturbed wilderness areas in Norway.
Even differences in attitudes might be captured by additional questions (for example Likert-type agree/disagree questions) in the original study, though the same problem mentioned earlier in the context of income differences, i.e. the use of variability within a country to predict differences in values between countries, is likely to arise.
More difficult to deal with are differences among countries in characteristics that do not vary within each country, e.g. health care quality does not vary much across individuals (the U.S. being a notable exception). A survey of e.g. WTP to avoid health impacts from poor drinking water quality conducted in Denmark, where everyone has access to care of similar quality, cannot reveal how individuals will value health in a country with better or poorer access or quality of care. It is perhaps possible to take advantage of variation in health care quality across countries, and estimate a value function from values estimated in multiple countries. However, the data need to do this is large. When considering factors that vary by country but that do not vary within each country, surveys in many countries are needed in order to get sufficient degrees of freedom to work with to include the factors that vary by country and affect WTP for health.
2.8 Should values be the same in Denmark as EU average values?
One issue that has not received much attention in the value transfer literature is the issue of whether values should be adjusted when transferring from one jurisdiction to another, or from one population of users to another. Should we use a recommended EU average unit value (e.g. as suggested by DG Environment of the European Commission for Value of a Statistical Life (VSL) and noise), in Denmark directly, or should we adjust it?
The answer depends on the purpose of the analysis. First imagine that Denmark is considering an investment in water quality control in Denmark. Obviously, Denmark should use its own unit values in evaluating that investment, rather than adopting an EU average value.
However, imagine that the EU was deciding which investments it should make in e.g. Denmark and Greece. If it uses Denmark`s values to value improved water quality in Denmark, and uses Greece’s values for improved water quality in Greece, it would direct more resources to improving Danish water quality than to Greek water quality. It is politically (and probably morally) more defensible to use a common value for the same water quality change in all member countries.
2.9 Extent of the market
Much of the focus in the value transfer literature has been on the validity of transferring per household or per user estimates of value. At least as important is the issue of how many households the value should be applied for to get aggregate costs or benefits of a new project or policy. Whenever a benefit transfer is conducted, it is critically important to determine the geographic extent of the population holding values for the environmental good. Consider a typical local environmental good such as a beach, lake or park. We would usually observe distance decay in value for such a site. If the population of users surveyed at the study site lives close to the site, then the transferred value will be valid only for the population living close to the policy site. In contrast, if the good has national significance (e.g. a national park), and the transferred value estimate comes from a national sample, then the relevant population at the study site is the entire nation.
When conducting international benefit transfer, however, there are added complexities. A single type of landscape, park, or river may have national significance in a geographically small country that has few such assets, while a similar good in a larger country has only regional or local significance. This could make it difficult to transfer use and non-use values for forest areas from the other Nordic countries to Denmark, where forest areas are scarce. Further, the issue of which goods are of local importance and which are of national importance is often cultural as much as geographic. The analyst needs to be careful when determining the extent of the market for the good.
2.10 Adjusting values over time
The usual procedure for temporal value transfer is to use the national consumer price index (CPI) to update the estimates to e.g. 2005-DKK, which implicitly assumes that individuals´ valuation of environmental goods increases at the same rate as the valuation of the private goods the CPI is based on. If the study is transferred from another country the recommended procedure for temporal transfer (e.g. in the ENVALUE database) is to convert the estimate to DKK using PPP (Purchase Power Parity) – corrected exchange rates of the time of the data collection at the study site, and then to update to 2005-DKK using the CPI of Denmark. However, the value of environmental goods over time could increase relative to private goods due to increased scarcity of environmental goods. Also, with increased income over time people would place a higher relative value on environmental goods compared to the private goods in the CPI. The empirical analysis of Kriström and Riera (1996) indicates that the income elasticity of environmental goods is in fact probably (slightly) smaller than one.
Several tests of the validity of temporal value transfer have been performed. Bergland et al. (1996) found stable preferences over a 4-year period for the recreational value of elk hunting in Oregon, USA. Brouwer and Bateman (2005) investigated the temporal stability over a 5-year period of WTP responses from two large-scale CV surveys on flood protection and wetland conservation, respectively. They found a significant difference across this longer period. However, tests of model transferability indicate that simple models, based solely upon variables derived from economic theory, are transferable across this period. This suggests that underlying relationships for such key determinants are stable even across this longer period. However, expanding models by including theoretically unanticipated factors brings ad-hoc and possibly transitory factors into the models, which consequently prove non-transferable.
Zandersen et al. (2005) report a 20-year temporal transfer validity tests for forest recreation in Denmark. They show that updating the transfer model (with data from a relatively inexpensive household survey, showing a decrease in car-borne travel to forests in these 20 years) leads to a reduction in transfer error by a factor of 4, down to a transfer error of 25 %. This shows the importance of updating the transfer model, even for shorter periods of time, in cases there have been significant changes in the determinants of WTP. Brouwer and Bateman (2005) review previous studies considering shorter periods (typically 1-2 years), and they showed no significant difference in real WTP values over time.
These temporal validity tests indicate that the real value of environmental goods is stable if there have been no big shifts in the determinants of WTP. By transferring from studies performed closer in time (i.e. less than 5-10 years), the chances of such a shift is smaller. Also, the probability of these original studies satisfying the current “best practice” criteria is higher when the studies are performed closer in time. If there have been significant shifts in these best practice criteria, one should very carefully assess the quality of the studies performed before this shift, e.g. Contingent Valuation studies performed before the NOAA Panel guidelines (Arrow et al. 1993).
To conclude, the standard procedure of adjusting values by the CPI seems to be appropriate but would probably underestimate the increase in relative value over time if the good becomes scarce, and/or people’s relative income increases and the income elasticity of the environmental good is high. Thus, the standard procedure for temporal transfer will most probably produce conservative (lower) value estimates.
3 Policy use and practices for value transfer
- 3.1 Policy use
- 3.2 Databases of valuation studies
- 3.3 Guidelines for primary studies and value transfer
- 3.4 Acceptable transfer errors
3.1 Policy use
Value transfer increases the uncertainty in the estimated environmental value, and a crucial question becomes: What level of accuracy is acceptable, and how does the need for accuracy vary with the policy use of the value?
Environmental valuation has four main types of policy use:
i) Cost-benefit analysis (CBA) of investment projects with environmental impacts, natural resources preservation and restoration projects, and environmental policies (e.g. the EU Water Framework Directive)
ii) Environmental accounting at the national level to construct “Green” Gross Domestic Product (GDP) (i.e. GDP corrected for changes in natural resources and environmental quality)
iii) Environmental costing in terms of marginal environmental and health damages of economic activities, which can be used as basis for e.g. setting the optimal size of environmental charges
iv) Natural Resource Damage Assessment (NRDA)/Liability for environmental damages; i.e. compensation payments for natural resource injuries from accidental oil spills and other pollution incidents.
For NRDAs, and partly also for environmental accounting and costing, there seems to be a more direct link between the outcome of the analysis and policy impact, and the group affected is more well-defined than in a CBA. Thus, the need for accuracy of the economic values increases, and thus the applicability of value transfer techniques decreases, as we move down the above list of potential policy uses (Navrud and Pruckner 1997). However, even in CBA the need for accuracy is higher when costs and benefits are very close (and the scale is large), and the risk of making the wrong decision is large when using value transfer.
Environmental costing exercises based on the DFA and value transfer have been performed for externalities of electricity production, both in the US and Europe; see e.g. Rowe et al (1995), Desvousges et al. (1998) and European Commission – DG XII (1995, 1999). However, very few of the environmental impacts we focus on in this report have been valued in these exercises. New York State and a few other US states have used these environmental costing exercises to construct "adders" to their electricity prices. Adders are increments added to the private marginal costs that allow you to get closer to full marginal social cost of electricity production. In this case they were used to make more rational decisions for electricity generation by using marginal social rather than marginal private costs (Brennan et al 1996).
In Europe, however, in only a few instances these environmental costing exercises have been used to construct environmental charges. The Swiss heavy vehicle charging scheme has been based solely on a careful analysis of externalities using DFA and value transfer (and some new original valuation studies). In the UK, the landfill tax was also based on a careful value transfer exercise, and the aggregate tax (from mining operations) was based on a comprehensive, new CV study.
Value transfer has also been used in green national accounting exercises; see e.g. the Green Accounting Research Project (GARP) of the European Commission (Tamborra 1999, GARP II 1999). The UN´s statistical division UNSTAT has actively supported the development of resource accounting systems (e.g. the Handbook on Integrated Environmental Economic Accounts).
In the US CV studies have been used in NRDAs to estimate lost use and non-use values of oil spills in marine and coastal areas (see e.g. Carson et al. 2003), and value transfer has been used for affected recreational activities e.g. beach recreation. However, currently many NRDAs apply the Habitat Equivalency Analysis (HEA), which applies a replacement cost approach to value lost ecosystem services in terms of discounted service-ha-years for beach recreation and biomass loss. With the EU Environmental Liability Directive in place we can expect to see both HEA and valuation studies and transfers used in NRDAs in Europe.
However, environmental valuation and value transfer methods are mostly used in CBAs. In Europe, the Directorate General (DG) Environment of the European Commission (EC) regularly performs CBAs of new directives using value transfer; see e.g. their recent CBA for the CAFE programme http://europa.eu.int/comm/environment/air/cafe/activities/cba.htm (based on the Clean Air for Europe – CAFE Strategy) and other air quality directives (see; http://europa.eu.int/comm/environment/enveco/studies2.htm.). However, the EU Water Framework Directive (WFD) is the first directive to explicitly ask for economic analyses to be undertaken in terms of identifying program of cost-effectives measures to achieve ”good ecological status” in water bodies, and to justify exceptions to reaching this goal by showing disproportionate cost. This implicitly means some form of cost-benefit analysis, and a need both for new valuation studies and massive value transfer to cover all water bodies. Recognizing the need for benefit transfer in implementing the WFD, Hanley and Wright (2005) performed value transfer validity test of CE data[7] applied to the implementation of the WFD in the UK, and question the transferability of CE data as they observed transfer errors of 60-70 % between rivers in the UK. Similar national CBAs of the adaptation to the WFD are planned in e.g. France and Norway. EU member countries, notably the UK, have also conducted full CBAs of national implementation of new EU directives (and strengthening of existing ones) in order to inform their negotiating stance. In the UK, a House of Lords committee questioned whether the benefits of coastal water quality improvements mandated by the Bathing Waters Directive (and moves to strengthen these standards) were large enough to justify the cost, and work was commissioned to undertake this CBA; see Georgiou and Bateman (2005).
In Norway, the Ministry of Finance (2005) recently updated their guidelines (from 2000) on economic analyses of public projects. This CBA guide contains chapters on economic valuation of environmental goods and health impacts, which conclude that value transfers have acceptable transfer errors for use in CBAs if the studies values are transferred from are of high quality, of a similar good, and is close in space and time (see citation in Norwegian below):
I en del tilfeller er det svært dyrt å gjennomføre originale og tilfredsstillende verdsettingsstudier. Et alternativ vil da være å overføre verdiestimater fra tidligere studier ved hjelp av etablerte teknikker for verdioverføring. Imidlertid medfører slike overføringer større usikkerhet enn en original verdsettingsstudie av en spesifikk miljø- eller helseeffekt. Tester av slike overføringer tyder på at usikkerheten er til å godta for bruk i samfunnsøkonomiske analyser. Dette gjelder særlig hvis de underliggende verdsettingsstudiene er av høy kvalitet, er gjort av tilsvarende miljøgoder og er foretatt nært i tid og rom. (Ministry of Finance 2005, p. 96)
According to the Swedish Ministry of Finance and Naturvårdsverket, their general guidelines for CBA do not address environmental valuation and value transfer methods in similar detail. This confirms the findings three years ago by Frykblom and Helgesson (2002) that the use of CBA was then rather limited in Sweden. Sundberg and Söderquist (2004) also found that examining the field “Used in CBA/policy” in ValueBase SWE only turns up five valuation studies that were part of a cost-benefit analysis or had otherwise been used in decision-making. However, they note that since this result is based only upon the information actually given in the valuation studies, it excludes primary studies that at a later stage have been used as input in a CBA or provided the basis for designing a policy.
However, all Nordic countries have CBA guidelines for transportation projects that use unit values for selected environmental and health impacts (and noise), typically based on quite rough unit value transfer procedures. The Norwegian Directorate for Public Roads (Statens Vegvesen - Vegdirektoratet) is, however, now re-considering this practice as they would like to base their valuation of environmental and health impacts on the DFA, and plan to conduct new empirical valuation studies which are constructed for value transfer.
3.2 Databases of valuation studies
On the whole, the empirical evidence shows that international benefit transfer is as valid as intra-country transfer (see chapter 2.3). Thus, databases of valuation studies in other countries are a potentially useful source for value transfer.
Appendices C and D review and evaluate existing databases of original valuation studies with regard to their potential use for value transfer in Denmark. The Environmental Valuation Reference Inventory (EVRI www.evri.ca) is the most comprehensive database of valuation studies in terms of the number of valuation studies worldwide, and seems to be the most useful database for Denmark due to its coverage both geographically and with regards to environmental goods. However, it should be populated with more Danish studies, including unpublished, “grey” literature (i.e. studies that do not make it to the scientific journals, but contain information useful for value transfer). Denmark should aim for the development of a Nordic database of valuation studies (which the Nordic Council of Ministers has submitted a call for) that should also be included in EVRI. All Nordic countries should join the EVRI Club in order to secure access and use of the database for all Danish citizens. Meanwhile, the list of Danish valuation studies provided in Appendices A and B (and updated versions of this, as many new Danish valuation studies will be completed in the next few years) should be used together with the database for Swedish valuation studies (ValueBaseSwe), the UK list of valuation studies and similar lists in other Nordic and European countries, in order to identify valuation studies that can be used for value transfer exercises in Denmark. This recommendation is based on the assumption that transfer of valuation studies from countries which are closer geographically, culturally and institutionally will have smaller transfer errors.
3.3 Guidelines for primary studies and value transfer
There are several excellent guidelines and list of “best practice” criteria for performing Contingent Valuation (CV) studies and other Stated Preferences techniques; see especially Mitchell and Carson 1989, Arrow et al. 1993 (NOAA guidelines), Bateman and Willis (1999), Bishop (2003) and Carson (2000). For CV studies, the main recommendations in the NOAA Panel (see Appendix J) still hold but should be supplemented with the practical guide for assessing the quality of CV studies outlined in Carson (2000)[8]. For a guide to the best practice in Choice Experiments (CE), we would recommend Bennett and Blamey (2001). Bateman et al. (2002) also provide practical guidelines to Stated Preferences surveys in general. For practical guidelines for both stated (SP) and revealed preferences (RP) methods see Champ et al. (2003). Based on most of the references listed above, Soutukorva and Söderqvist (2005) have developed lists of “best practice” criteria for both SP and RP methods; see the lists in their Appendix B1 (especially tables B.1.1 – B 1.6) and Appendix B2.
There are, however, few detailed guidelines on value transfer. In the US there exist guides that cover the key aspects of conducting a value transfer, notably Desvousges et al. (1998) aimed at transfer for valuing environmental and health impacts of air pollution from electricity production.
These guidelines outline the following seven steps:
1) Define the value(s) to be estimated at the policy site
2) Conduct a literature review to identify relevant valuation data
3) Assess the relevance of the study site values for transfer to the policy site
4) Assess the quality of the study site data
5) Select and summarize the data available from the study site(s)
6) Transfer benefit measures from the study site(s) to the policy site
7) Determine the “market” over which benefit estimates are to be aggregated
These guidelines have recently been applied also in Europe to value impacts from climate change in the UK (Metroeconomica 2004). For use values, Rosenberger and Loomis (2001) provide a rather detailed guide for transfer of values for recreational activities based on an extensive database they also helped to develop (see appendix C). Non-use value transfer in the US, however, seems to be more ad hoc. The same seems to be true for most use and non-use value transfers performed in Europe. Thus, Smith (1992)´s call for practical guidelines for value transfer still stands.
3.4 Acceptable transfer errors
Even if we cannot determine general levels of acceptable transfer errors for different policy uses, some general decision rules for how to determine the acceptable transfer errors in CBA can be outlined.
There are two main sources of error in estimated values from value transfer:
i) errors associated with estimation of the unit value/value function at the study site
ii) errors from transferring the study site value(s) to the policy site.
By using “best practice”-guidelines for original valuation studies we can minimize the first type of errors. The second type of errors arises because we usually would need to transfer estimates both in space and time. Results from validity tests of different value transfer procedures for different type environmental goods have shown that individual transfer errors in spatial value transfer vary from a few to several hundred percent (see appendix G). However, average transfer errors, both for national and international value transfer, seem to be about + 25 - 40% (see chapter 2.4). In many cases this would be an acceptable transfer error in CBA. Sensitivity analysis should be performed to see if this interval for the estimated values would influence the outcome of the CBA. The size of the critical transfer error, i.e. when Net Present Value (NPV) of the project is zero should also be calculated, especially in cases where we suspect the transfer errors could be larger. These cases include international value transfers of complex environmental goods from study sites that are quite different from the policy site in terms of magnitude and direction of change, initial level of environmental quality, availability of substitutes (scarcity), different size of affected areas, different type of population (locally most affected population versus the national population) etc.
In order to reduce the uncertainty and calibrate the transferred value estimate there is the option of conducting a small-scale study at the policy site in terms of a valuation workshop, focus group or a valuation study of a small sample. However, the costs of providing this additional information should be compared to the benefits in terms of reduced uncertainty (and the reduced risk of the CBA showing the wrong outcome). This could be done by adopting a Bayesian perspective to inform the decision on whether to conduct primary research at the policy site, and if so how much. Here, value estimates or functions from existing studies can be used to form a prior distribution on the value of the good at the policy site. Valuation research conducted at the policy site provides new information on the value of the good. An updated distribution of the value of the good at the policy site contains information from both previous studies conducted at other sites, and from the new research conducted at the policy site. Thus, the decision should be made based on a comparison of the expected value of the information to be gained and the cost of conducting new research. This Baysesian approach could also be adopted where information on the value of similar goods is available, but there is concern that the value at the policy site may be unique (see Atkinson et al. 1992 for a theoretical discussion, and León et al. 2002 for an application to a national park). However, currently the approach does not seem to be sufficiently developed and simplified to be applied on a routine basis in practical value transfer exercises.
One should be even more careful in using value transfer for policy uses where the demand for accuracy is high; especially environmental costing exercises aimed at determining the level of environmental charges and NRDAs aimed at calculating compensation payments to be paid by those that were responsible for the emissions causing the damage.
4 A Practical Value Transfer Guide
4.1 Stock of Danish valuation studies
Appendix A lists 17 Danish primary valuation studies on the priority environmental goods. None of them are older than 10 years, and the majority of the studies have been performed the last 5 years. Several new primary valuation studies will also be published in the next few years (see appendix B). This clearly shows the increased activity in the field of environmental valuation in Denmark. Table 1 shows how the available primary studies are distributed on the priority environmental goods, and the different valuation methods applied.
Table 1: Review of Danish Valuation studies on priority environmental goods (CV = Contingent Valuation, CE = Choice Experiment, CR = Contingent Ranking, TC = Travel Cost, HP = Hedonic Pricing). Since some primary studies value more than one environmental good and/or apply more than one valuation method the numbers do not add up to 17, which is total number of studies in Appendix A.
| Environmental good | Number of studies | Number of times valuation method is applied |
| Water - surface water quality - groundwater quality - recreational fishing - lake view |
1 1 1 1 |
1 CV, 1 CE 1 CV, 1 CE 1 CV 1 HP |
| Landscape - forests - moorland - wetlands (aesthetics and recreation) - windmills - landscape along motorways |
7 2 2 1 1 |
3 CV, 1 CR, 2 HP, 1 TC 1 CV, 2CE 2 CE 1 CV, 1 HP (simplified) 1 CE |
| Marine and Coastal areas - seascape (off-shore windmills) |
1 | 1 CE |
| Soil Quality | 1 | 1 HP (simplified) |
| Ecosystem functions and biodiversity - birds - biodiversity in marshes/wetlands |
1 2 |
1 CR 2 CE |
Table 1 shows that there are Danish valuation studies for all the priority environmental goods considered in this report. However, nearly half of these valuation studies are on forests, and particularly the recreational value of forests. For the other environmental goods listed there is only one study in each subcategory, which means that the basis for value transfer for these goods is very thin. It should also be noted that several valuation studies consider restoration (rather than preservation) projects, e.g. reforestation projects and restoration of wetlands.
Contingent Valuation and Choice Experiments dominate among the methods (8 applications of each mehod; sometimes in the same study), but also CR, HP and TC have been applied. Five HP studies have been performed, which is more than other European countries for this type of environmental goods.
Based on the above review of Danish valuation studies conducted to date, and the discussion on validity of spatial value transfer in chapter 2, the time does not seem ripe for establishing general unit values for the priority environmental goods. The empirical basis for setting such general values simply does not exist. More primary valuation studies are needed for all these environmental goods, with the possible exception of forest recreation. However, these values also seem to be too site specific to construct general unit values. However, value transfer is still defensible, but the value transfer practitioner should apply the practical guidelines outlined in chapter 4.2 below.
4.2 Practical guidelines
The guidelines below are based on the discussion in chapters 2 and 3, and the stepwise procedure outlined by Desvousges et al. (1998) (see chapter 3.3). A practical illustration on how to apply the guide is provided in chapter 5.
STEP 1 - Identify the change in the environmental good to be valued at policy site
(i) Type of environmental good
| Abbreviation | Priority Environmental Good |
| G | Groundwater quality (drinking water and non-use) |
| W | Surface water quality (eutrophication, acidification, heavy metals; drinking water, recreational activities, non-use) |
| M | Marine and coastal areas (beach recreation, aesthetics, non-use value of marine and coastal ecosystems) |
| S | Soil quality (health impact, use and non-use) |
| L | Landscape type (aesthetic value and recreational use of e.g. forests, wetlands, moorlands etc.) |
| E | Ecosystem functions and biodiversity (ecosystem services, e.g. cleaning capacity of a wetland; species, habitats, non- use values of ecosystems in landscapes described in L) |
(ii) Describe (expected) change in environmental quality
a) baseline level, b) magnitude and direction of change
(gain vs. loss; and c) prevention[9] vs. restoration )
| Env. Good | Quality, quantity and area measures Unit of measurement Uniqueness and availability of substitute sites |
| G | Quantitative indicator: i) Clean drinking water which fulfils limit values of nitrate and pesticide residues; (specify if naturally clean or purified). Can also be linked to defined health symptoms. (Baseline may be that tapwater will (probably) be polluted in the future and could be changed to “Clean drinking water” through protection or purifying). |
| W | Qualitative indicator: “Bad”, “a little good” and “very good” biodiversity/ecological status in lakes and rivers (linked to WFD); Quantitative indicator: (i) A classification system, corresponding to endpoints in dose-response functions, described in terms of quality of biodiversity (non-use) and suitability for different recreational activities (Drinkable, swimmable, fishable, boatable). This has been developed for eutrophication and acidification[10]. Usually the change is reduced eutrophication and improved water quality, where the baseline is continued low water quality. Can also be linked to defined health symptoms, length of river, area of lake etc. (ii) Baseline and expected change in annual number of activity days for different recreational activities. Assess uniqueness and available substitutes e.g. number of similar lakes in the region. |
| M | Qualitative or Quantitative indicator: (i) Quality of biodiversity (non-use), suitability for different recreational activities. (ii) Baseline and expected change in annual number of activity days for beach use and other recreational activities related to marine and coastal areas. Assess uniqueness and available substitutes for beach recreation, saltwater fishing and boating. (iii) Change in distance (in km) to off-shore wind farms; or situations without and with wind farms. |
| S | Qualitative indicator: i) Baseline and expected change in terms of five categories of contaminated soils: Suspicion (possibly contaminated), Contaminated, Cleaned up, Residual contamination, and Investigated with no findings. ii) Percentage change in property value for each category of soil contamination. Describe area and property market in terms of urban/rural, average price and attractiveness. |
| L | Qualitative indicator: Baseline and change in different types of landscape. Quantitative indicator: (i) Area of landscape type (baseline and expected change in ha.) (ii) Baseline and expected change in annual number of activity days for hiking and other recreational activities. Assess uniqueness and available substitutes e.g. number of similar landscapes in the region. |
| E | Qualitative indicator: Baseline and change in (i) General indicator of biodiversity: Low, Some and High[11] (ii) Different types of ecosystems (habitats), ecosystem services and species (number of species, type odd species, population size, threatened species). Quantitative indicator: (i) Area of landscape type (baseline and expected change in ha.) |
STEP 2 – Identify the affected population at the policy site
Desvousges et al. (1998) use this as the last step in their Value transfer guide. However, it is important to identify the size of the affected population at the policy site before we review the valuation literature and evaluate the relevance of selected studies. The transferred value should come from the same type of affected individuals in terms of spatial scale.
If we just want to establish the use value of some activity, the relevant, affected population is the recreationists. If we would like to estimate both use and non-use values, and the policy site is only of local importance (e.g. a small river or lake with many substitutes regionally), we should use only the population of the municipality. If there are few substitutes for the sites at the regional level (e.g. a forest area in Denmark), the population in several communities, or even the county population, should be used. If the good is of national importance, e.g. a national park, or the single site of a red-listed species in the country, the national population should be used.
For use values, the number of individual recreationists should be estimated (before and after the change), while for non-use values (or use and non-use values combined) the number of households should be the unit of aggregation at the relevant geographical scale (community, regional/county or national level).
STEP 3 - Conduct a literature review to identify relevant primary studies
Review first the primary Danish Valuation studies in Appendices A and B to see if there are studies in Denmark of the environmental good in question. Table 1 clearly shows that the probability of finding relevant Danish studies is highest for forest recreation while it is much lower for the other priority environmental goods. Since Hedonic Price (HP) functions could be potentially difficult to transfer, especially between countries, due to the fact that the results are strongly influenced by characteristics of the market (e.g. attractiveness and overall price level of the area), Danish HP studies should be used where applicable. Thus, relevant Danish HP studies do exist, and should be utilized, for soil quality, and selected landscape features. (The advantage of HP is that it is based on revealed actual behaviour in a market where the environmental good is incorporated, as opposed to CV, CE and CR which are stated preferences methods).
The next step is to search the EVRI, ENVALUE and ValueBase SWE databases to identify similar studies from the other Nordic countries. This recommendation is based on value transfer validity tests (chapter 2.4) showing that studies closer spatially tend to have lower transfer errors. Studies closest in time should be selected for the same reason. However, one should note that this evidence is not conclusive. If there are no or only very few primary Nordic studies of the environmental good in question, or the valued change in the quality of the environmental good is outside the range considered at the policy site, the same databases and other bibliographies (e.g. the UK valuation studies list) should be searched for relevant studies. Meta-analyses (including also North American studies) could also be consulted, bearing in mind the limitations for value transfer of meta analyses with a broad scope (i.e. too large variation in definition of the environmental good). Thus, in practice, only meta-analyses for well defined recreational activities seem to produce meta-functions without methodological variables dominating the WTP function (see chapter 2.2), and with meta-functions explaining a sufficiently large part of the variation in WTP.[12]
Often, the databases do not have all the data needed for the relevance of the study site to be evaluated, and the full study report should be found.
STEP 4 – Assessing the relevance and quality of study site values for transfer
Here, the quality of the relevant valuation studies is assessed in terms of scientific soundness and richness of information. Desvousges et al. (1998) identify the following criteria for assessing the quality and relevance of candidate studies for transfer:
i) Scientific soundness - The transfer estimates are only as good as the methodology and assumptions employed in the original studies
- Sound data collection procedures (for Stated Preference surveys this means either personal interviews, or mail/internet surveys with high response rate (>50 %), and questionnaires based on results from focus groups and pre-tests to test wording and scenarios
- Sound empirical methodology (i.e. large sample size; adhere to “best practice”-guidelines guidelines for e.g. Stated Preference surveys - see chapter 3.3 and appendix J)
- Consistency with scientific or economic theory (e.g. links exist between endpoints of dose-response functions and the unit used for valuation, statistical techniques employed should be sound; and CV, CR, CE, HP and TC functions should include variables predicted from economic theory to influence valuation)
ii) Relevance - the original studies should be similar and applicable to the “new” context
- Magnitude of change in environmental quality should be similar
- Baseline level of environmental quality should be similar
- Affected eco-system services and environmental goods should be similar
- The affected sites should be similar when relevant (e.g. when assessing recreational values)
- Duration and timing of the impact should be similar
- Socio-economic characteristics of the affected population should be similar
- Property rights, culture, institutional setting should be similar
iii) Richness in detail – the original studies should provide a detailed dataset and accompanying information
- Identify full specification of the original valuation equations, including precise definitions and units of measurements of all variables, as well as their mean values
- Explanation of how substitutes (and complementary) goods were treated
- Data on participation rates and extent of aggregation employed
- Provision of standard errors and other statistical measures of dispersion.
All three criteria and their components are equally important for assessing the relevance and quality of the study.
STEP 5 – Select and summarize the data available from the study site(s)
For our priority environmental good we will, with the possible exception of forest recreation, at the most have only a couple of relevant Danish primary valuation study. Even when we extend the scope to the Nordic and European valuation studies, we would frequently have only a few relevant study sites to transfer from. Then, the selection of a “best” value estimate is not very difficult. The problem arises, when several relevant studies are available, as is the case for forest recreation in Denmark (see table 1). Although we could still try to select the “best study”, this approach would ignore potentially valuable information contained in the studies neglected. Several parallel approaches should be applied, and the results from these should be used to present a range of values:
i) Search the studies to provide low and high estimates, which can define a lower and upper bound for the transferred estimate, respectively.
Collect data on the mean estimate and standard error, and specific spatial transfer errors if available (if not use the general transfer errors of + 25 - 40 %; see chapter 2.4). Consult relevant meta-analyses (see the table below for some examples) to see if the scope of these is narrow enough to provide relevant information about the estimate to be transferred. The scope could be too wide to produce reliable estimates if the meta-analysis consists of studies which vary a lot in terms of methodology, and the environmental good considered.
| Env. Good | Meta-analyses to be checked for value transfer |
| G | Boyle et al. (1994) - Pesticide residue in groundwater |
| W | Magnussen (1993) – Surface water quality (Norwegian CV studies of eutrophication) |
| M | Barton (1999) – Marine and coastal water quality |
| S | No meta-analysis on soil quality |
| L | Santos (1998) - Landscape change (agricultural landscape) Rosenberger et al. (2001) – Recreational values |
| E | Brouwer et al. (1999); Woodward & Wui (2001) - Wetlands Loomis and White (1996) – Endangered species |
Compare the magnitude of the value from the meta-analyses, when methodological parameters in the meta-function is set according to the best practice guidelines and a context corresponding to the policy site. Methodological variables in meta-analyses (of CV studies) that reflect best practice guidelines include survey mode (preferable in-person interviews or mail surveys with high response rates), studies not older than about 10 years; i.e. conducted after the NOAA panel guidelines to CV (Arrow et al. 1993) (year of study often used as a proxy variable for quality in some meta-analyses), similar as possible in magnitude and direction of change, substitutes, characteristics of the population; and a realistic and fair payment vehicle (not voluntary contribution without a provision point mechanism, and not payment vehicles that create a large degree of protest behaviour).
STEP 6 – Transfer value estimate from study site(s) to policy site
a) Determine the transfer unit
The recommended units of transfer for use and non-use values are:
i) Use value:
For recreation: Consumer surplus per activity day[13]
For other types of use, e.g. groundwater or surface water for drinking:
WTP/household/year
For recreation consumer surplus per year (or per visit) per visitor could also be used, but then the average number of activity days (or visits) per year should be the same at the study and policy sites.
ii) Non-use value: WTP/household/year[14]
Total WTP per ton of pollutant (i.e. aggregated WTP across affected households divided by the total number of tons of a pollutant causing the change in environmental good we are valuing; determined through the DFA , figure 1) could also be used, but this assumes a constant marginal WTP, and the same size of the affected population at the study and policy sites.
The use of total WTP per ha of ecosystem or landscape type assumes both the same size of the affected population and that the value pr. ha. is constant. However, empirical evidence shows that WTP does not increase proportionally with the number of ha of ecosystems or landscape types, or distance to off-shore windmills in km (see e.g. Ladenburg et al (2005)). Since SP surveys clearly show that WTP per unit of area varies widely, we should caution against converting households´ stated mean WTP for a discrete change in environmental quality to marginal values like WTP pr km or ha per household. However, this unit is ”better” than total WTP per km or ha, because in the latter case one also has to assume similar population density at the policy and study sites).
b) Determine the transfer method for spatial transfer
If the policy site is considered to be very close to the study sites either in Denmark, the other Nordic countries or other European countries) in all respects, unit value transfer can be used. If we have got several equally suitable study sites to transfer from they should all be evaluated, and the transferred values calculated to form a value range.
For unit transfers between countries, differences in currency, income and cost of living between countries can be corrected for by using Purchase Power Parity (PPP) corrected exchange rates; see e.g. http://www.oecd.org/dataoecd/61/56/1876133.xls. Within a country we could also use unit value transfer with a correction for differences in income level, using equation (1) in chapter 2.2 and an income elasticity of WTP lower than 1. Based on the discussion in chapter 2.4, these estimates should be presented with error bounds of + 40 %. However, if the sites are very similar, or the primary study was designed with transfer to sites such as the policy site in mind, an error bound of + 25 % could be used. If the study and policy sites are not quite close, unit transfer could still be used, but arguments for over- and underestimation in the transfer should be listed and the unit value should be presented with error bounds of + 100 % (based on the observed large variation in individual estimates observed in validity tests; see chapter 2.4).
Function transfer can be used if value functions have sufficient explanatory power[15] and contain variables for which data is readily available at the policy site. Most often the ”best” model is based on variables where new surveys have to be conducted at the policy site to collect data. Then one could just as well perform a full-blown primary valuation study. If models are constructed based on variables for which there exist data at the study site, they very often have low explanatory power. In general, WTP functions based on Stated Preference surveys (especially Contingent Valuation) have much lower explanatory power than functions based on TC and HP studies. Thus, it could be more relevant to use function transfer transferring estimates from these Revealed Preference methods.[16]
If relevant meta-analyses are identified (see previous step), estimates from these could also be used in a comparison of several transfer methods. Sensitivity analysis could be performed to see how much the transferred value estimate could vary. The constructed upper and lower values should be used to bound the transferred estimate. However, all meta-analyses to date seem to be dominated by the methodological choices of the primary studies they consider. Thus, until we get enough primary valuation studies using the same methodology, estimates from meta-analyses would be less reliable than unit value transfers (and value function transfers from a single study site).
To conclude, unit value transfer is recommended as the simplest and most transparent way of transfer both within and between countries. This transfer method has in general also been found to be just as reliable as the more complex procedures of value function transfers and meta-analysis. This is mainly due to the low explanatory power of willingness-to-pay (WTP) functions of Stated Preference studies, and the fact that methodological choice, rather than the characteristics of the site and affected populations, has a large explanatory power in meta-analyses. Generally speaking, error bounds of + 25 - 40 % should be used if the study and policy sites are very similar (which we should strive for) . If there is less similarity between study and policy sites, error bounds of + 100 % should be used.
c) Determine the transfer method for temporal transfer
The value estimate should be adjusted from the time of data collection to current e.g. 2005-DKK using the Consumer Price Index (CPI) for Denmark (see chapter 2.10, and CPI for Denmark and equation to be used for the conversion in appendix H). If we transfer values from a study site outside Denmark, we first convert to DKK, in the year of data collection, using PPP corrected exchange rates in the year of data collection, and then use the Danish CPI to update to current-DKK.
However, environmental goods could also increase more or less in value than the
goods the CPI is based on. However, there is no general rule for adjustments of preferences for environmental goods over time.
STEP 7 - Calculating total benefits or costs
For non-use values, mean WTP/household/year is multiplied by the total number of affected households to derive the annual benefit or cost. If WTP at the study site is stated as annual WTP for e.g. 5 or 10 years, the total benefits or costs should be calculated as the Present Value (PV) over that same period. On the other hand, if WTP is stated as one-time amounts the amounts must be viewed as a present value (of all benefits from the environmental good in question).
The general equation for calculating the present value of the benefits PV (B) is:
 (6)
(6)
where Bt is the total benefits in year t, T is the time horizon (for the stated WTP amounts) and r is the social discount rate (r = 0.03 (3% p.a.) is the social discount rate currently used by Miljøstyrelsen. Benefits and the discount rate are stated in real terms, i.e. 2005 DKK and the discount rate is a real rate of return (i.e. corrected for inflation, and not a nominal rate)).
If the time horizon is not stated in the WTP question in SP surveys, we must assume that this is an annual payment over an infinite time horizon, i.e. t → ∞ . In this case, and if the annual benefits Bt are the same each year, equation (6) can be simplified to:
PV (B) = Bt / r (7)
Annual benefits Bt are equal to aggregated WTP over the affected population (WTPtot), which can be calculated as:
WTPtot = n x WTPi (8)
where n = number of affected households, and WTPi = mean Willingness – To –Pay for household i. Since WTP per household varies between different parts of the affected population (e.g. with distance from the site, whether users and/or non-users are considered etc.), the estimates from the study site(s) should be based on the same type of affected population as at the policy site. If this is not possible, distance decay in WTP (e.g. percentage reduction in WTP pr km increased distance from the environmental good) could be assumed, based on empirical evidence from relevant study sites (if such evidence does exist and suggests this).
If we calculate use values, we just substitute households with individual recreationists in equation (8) and use estimates for Consumer surplus per activity day times the increase or decrease in number of activity days to calculate total use value of the project. For uses other than recreation, e.g. use of groundwater and surface water for drinking, values are often elicited on a household basis, and the same procedure as for non-use values can be employed.
When aggregating damages and costs of environmental goods, we also need to consider whether these goods are independent (meaning we can just add them up), or substitutes or complementaries. In the first case we would overestimate aggregated damage or benefits, while in the latter case we would underestimate.
Finally, when performing a Cost-benefit analysis of a new project of policy, the estimated PV of benefits (costs) should be compared with the corresponding PV of costs (benefits). The effect on total annual benefits (costs) due to an expected general transfer error of 25 - 40 % (see chapter 2.4) should be calculated in order to see if this reduces the PV of benefits (increases the costs) to a critical level, i.e. the PV of net benefits becomes negative (from positive). If this is so, the transfer errors are large enough to change the outcome of our CBA, and we should try to increase the accuracy of the transferred estimate (either by conducting a full primary study or calibrating the transferred value by conducting a small scale primary study).
When there is a need for estimates of environmental goods for policy purposes, a CBA of conducting a new environmental valuation study should be performed in order to determine whether the costs of a new primary study is worth the benefits in terms of lower probability of making the wrong decision. These decision rules could be used as a rough test of whether value transfer has acceptable transfer errors, e.g. in its most frequent policy use (Cost-benefit analysis).
5 Applying the guidelines – An illustrative example
To show the practical use of the guidelines in chapter 4, we will now apply them to the case of restoring the Skjern River wetlands and river landscape. This case illustrates the transfer of both use values (both consumptive and non-consumptive use) and non-use values. The valuation of specific components might deserve more in-depth information, consideration and discussion of the conditions at the policy site, but also at the study sites. Thus, this example should not be regarded as an authoritative valuation of restoring the area.
Dubgaard et al. (2003) is a very good example of how to conduct a cost-benefit analysis (CBA) of a nature restoration project. Dubgaard et al. (2003) used a unit value transfer methodology to asess the following social benefits:
• Value as a factor of production (farm land, reed production etc.)
• Ecosystem services (retention of nutrients, flood risk reduction etc.)
• Consumptive outdoor recreation values (hunting, angling)
• Non-consumptive outdoor recreation values (hiking, boating, wildlife observation, etc.)
• Non-use value which individuals place on the mere existence of biological diversity.
The first two benefit components were valued using market prices and the replacement cost method. As the focus of this value transfer guide is the Stated Preference methods (CV and CE) and the Revealed Preference methods (TC and HP), this example will consider the last three benefit components.
Dubgaard et al. (2003) make extensive use of unit value transfer to estimate the social benefits of restoring the Skjern River. In this chapter we will illustrate how the value transfer guidelines could be applied to the affected non-market, use and non-use value components; and how this could change the magnitude of the estimated benefits in Dubgaard et al. (2003).
The example will be described in terms of each of the following seven steps of the practical guidelines:
1) Identify the change in the environmental good to be valued at the policy site
(i)Type of environmental good
(ii)Describe baseline, magnitude and direction of change in environmental quality
2) Identify the affected population at the policy site
3) Conduct a literature review to identify relevant primary studies
4) Assess the relevance and quality of study site values for transfer
(i) Scientific soundness; the transfer estimates are only as good as the methodology and assumptions employed in the original studies
(ii) Relevance; primary studies should be similar and applicable to the “new” context
(iii) Richness in detail; primary studies should provide a detailed dataset and accompanying information
5) Select and summarize the data available from the study site(s)
6) Transfer value estimate from study site(s) to policy site
(i) Determine the transfer unit
(ii) Determine the transfer method for spatial transfer
(iii) Determine the transfer method for temporal transfer
7) Calculating total benefits or costs
Step 1: Identify the change in environmental good to be valued at the policy site
(i) Type of environmental good
This is both a type L and E environmental good (see chapter 4, step 1); i.e. a wetland providing landscape aesthetic and recreational opportunities (consumptive and non-consumptive recreation), and providing biodiversity. Thus, the project will impact both on use and non-use values.
(ii) Describe baseline, magnitude and direction of change in environmental quality
Dubgaard et al. (2003) describe the Skjern River restoration project below. Note that: (i) there are impacts both on recreation and biodiversity, (ii) this is a restoration project, and (iii) the short-term change in quality/quantity of the environmental good as a result of the described project is well known since this is an ex-post study (the River Skjern restoration project was completed in 2003).
.
With an average discharge of 35 m³/s the Skjern River is the largest Danish river by volume. It has a catchment area of 2,500 km² and a length of 95 km. The river discharges into the Ringkøbing Fjord - a shallow 300 km² costal lagoon, which is connected with the North Sea by a floodgate. The Skjern River delta and Ringkøbing Fjord have been designated as an international bird protection area for wading birds and as a EU habitat area. The river system is home to a number of red-listed species in Denmark. The location of the area is presented in Figure 2.
Figure 2.
Location of the Skjern River Project Area. Source: Dubgaard et al. (2003, fig. 1)
(ii) Describe (expected) change in environmental quality
According to Dubgaard et al (2003),: The primary purpose of the Skjern River project is to re-establish a large coherent nature conservation area with good conditions of life for the fauna and flora connected with wetlands. Before the 1960s the Skjern River floodplain was managed as extensively grazed meadows and hayfields. During the 1960s the lower 20 km of the river were straightened and diked. Pumping stations were established and 4,000 ha of meadows were drained and converted to arable land. In 1987 the Danish Parliament decided to initiate studies of restoration possibilities. Detailed surveying and designing started in 1995 and re-meandering work began in 1999. The river restoration works were completed by mid-2003.
Of the 4,000 ha reclaimed in the 1960s 2,200 ha were included in the project. The entire project comprises the following initiatives (Danish Forest and Nature Agency, 1998):
• The lower 19 km of channelled river have been turned into a 26 km meandering course.
• The River has been laid out with several outflows to the Fjord, which, in time, will create
a delta of app. 220 ha.
• Creation of a lake of approximately 160 ha.
• Re-establishment of the contact between the River and riparian areas by permitting
periodical floods of land within the project area.
• Transfer of 1,550 ha of arable land to extensive grazing.
The project will improve the water quality of the Skjern River system, living conditions for the wild flora and fauna, together with the recreational value of the area. The flora of riparian areas and the River will become more diversified and is expected to include rare species like Elisma natans in flowing water and calamus, water soldier and cowbane in still water. The area will become increasingly attractive to breeding birds, especially species specifically found in wetlands, reed, and meadows. A significant factor is the establishment of a large coherent area with improved possibilities for nesting and feeding. Key areas free from hunting and disturbance will be established to ensure resting, foraging, and breeding possibilities for birds and mammals. Bird species like kingfisher, bittern, water rail, crake, reed bunting, reed warbler, bearded tit, ducks and geese are expected to breed in the area. Large amounts of ducks and geese have already been registered and the populations of migrating and resting birds are expected to increase. In addition to a varied bird life, an increase in the population of endangered amphibian and reptile species is expected, and populations of otter in central Jutland will be able to migrate as a result of the removal of man-made barriers in the landscape. Improved water quality, environmentally friendly maintenance practices, and the re-establishment of spawning grounds will have a positive effect on the salmon and trout populations in the River system.
The River discharges into the Ringkøbing Fjord, which is a shallow costal lagoon considerably affected by excessive loads of nutrients. A major programme is underway aiming at reducing nutrient emissions to the Fjord. The Skjern River project will contribute to this programme due to the retention of nutrients and other particles in the wetlands of the river valley. The reduction is partly obtained by the transfer of arable land to more extensive land uses, but more significantly by the re-creation of the natural ecology and hydrology of wetlands, which will filter and absorb nutrients and other particles in the river water during flooding.
Finally, the nature restoration project will increase the possibilities for recreation in the area. The size of the project area facilitates activities such as hiking and biking, boating, camping, studies of flora and fauna, angling and hunting. Accessibility has been improved by the establishment of new trails, access to grazing areas and the construction of outdoor recreation facilities.
Step 2: Identify the affected population at the policy site
Due to its sheer size, the Skjern River has few, if any, perfect substitutes in Denmark. There are areas in Western Jutland that have biological characteristics, which are quite similar to the Skjern River area. The Skjern River has an original Atlantic salmon population and is an important stopover for migrating birds along the North Sea. Thus, the Skjern River can be considered a unique environmental good, and is therefore of national importance. Thus, all Danish households should be used as the affected population when calculating the non-use values. For consumptive and non-consumptive use values we will of course only consider the respective user groups.
For the remaining steps we will report separately on each of the three types of values considered: i) consumptive use, ii) non-consumptive use, and iii) non-use values.
Step 3: Conduct a literature review to identify relevant primary studies
CONSUMPTIVE USE VALUES
Both hunting and angling in the area will be affected by the restoration projects, and increased benefits are expected from both these types of consumptive recreational activities. As Dubgaard et al. (2003) point out there does not exist any Danish primary valuation study on hunting, and only one primary study on recreational fishing (which is part of a Nordic study; see Toivonen et al. 2000). There are also other primary valuation studies of recreational fishing for trout and salmon in both Norway and Sweden (based on a search in EVRI (www.evri.ca) and VALUEBASESWE in appendix F). However, since the guidelines recommend using national valuation studies, and this primary Danish study values recreational fishing for the same species (salmon and trout), we report only this study here.
For hunting, there is no study in the Nordic countries of duck hunting. However, there is one primary valuation study for small game hunting in the mountains in Sweden (see Dalin 2000 in appendix F), and several in the US (for an overview see e.g. Walsh et al. 1990, 1992; Smith and Kaoru 1990; and Appendix 3, chap. 3).
NON-CONSUMPTIVE USE VALUE
Dubgaard et al. (2003) base their non-consumptive value transfer on a value per visit (activity day) from a Danish valuation study of another unique area (Mols Bjerge; Dubgaard 1996) However, also more recent Danish SP studies of forest areas, applying state-of-the-art methodology, should be considered for transfer to the Skjern River of less uniqueness than Mols Bjerge. Recent Danish and Nordic valuation studies of forest recreation areas have been reviewed, and can provide values for less unique areas than the Mols Bjerge. The most relevant study is Termansen et al. (2004) (see Appendix A) that value a day trip (i.e. activity day) to forests in Denmark in general. They find a mean WTP of 20-28 2005-DKK per activity day (which is lower than the more unique Mols Bjerge, valued at 38-56 2005-DKK).
NON-USE VALUE
Since Dubgaard et al. (2003) did their transfer study, one new very relevant Danish primary study has been performed that could be used in a unit value transfer exercise if the change in quality of the two resources can be assumed to be of the same magnitude. This is the Store Åmose-study by Lundhede et al. (2005) – see Appendix A.
Step 4: Assessing the relevance and quality of study site values for transfer
(i) Scientific soundness
CONSUMPTIVE USE VALUES
Recreational fishing
Toivonen et al. (2000) is a CV study (according to appendices J and K), with a survey instrument that was well constructed and carefully tested, but this was a mail survey with a response rate of 45 % in Denmark (somewhat higher in the other Nordic countries). In these mail surveys of the general public we very seldom get higher than 50 % response rate, and then of course the representativeness of the sample can be questioned. One large advantage of this CV study is that it was constructed for value transfer (and to test the validity of value transfer between the Nordic countries). However, this study, as most multi-country CV studies, is based on CV scenarios that are trade-offs between what is optimal design in each country and the need to use the same CV scenario and questionnaire in all countries to avoid that differences in valuation are due to methodological differences (but only reflect differences in individual preferences of people in different countries). Thus, some of the scenarios might be hypothetical in some countries even if they are very relevant in others. To conclude, the scientific soundness of the study is sufficient to serve as a basis for transfers.
Hunting
The Dalin (2000) is a high quality TC mail survey of hunters with a very high response rate (85%). Consumer surplus (CS) per hunting day was found to be 82 2000-SEK.
NON-CONSUMPTIVE USE VALUES
Termansen et al. (2004) was also based on a high quality TC study of recreationists, with an acceptable response rate (> 50 %).
NON-USE VALUE
Lundhede et al. (2005) performed a CE study in 2005 of a sample of both the entire Danish population and the local population, asking them to value a nature restoration project in the wetlands area of Store Åmose, which has no close substitutes. This study also values a nature restoration project, just like the Skjern River project, but Store Åmose is also very important as an archaeological site. The Skjern River project focuses more on preservation of biodiversity and is a more comprehensive project. The CE study of Store Åmose is based on a large number of observations (n=1,636). It had a response rate of above 50 % (51%), which shows that this internet based survey could easily achieve as high response rates as mail surveys.
(ii) Relevance/similarity in change in environmental goods valued
CONSUMPTIVE USE VALUES
Recreational fishing
Toivonen et al. (2000) value recreational fishing in a reasonably similar context to the Skjern River restoration project, as this study considers the same direction of change, i.e. an improvement in recreational fishing opportunities, but by opening up a new river to fishing rather than improving an existing one (which is the case in the Skjern River).
Hunting
Although the Swedish study (Dalin 2000) considers small game hunting for other species, and in the mountains rather than on wetlands, we assume that the activity quite closely resembles the one in the Skjern River area. Although this type of hunting in Sweden and Denmark is considered to be closely related culturally and institutionally, one should in practice compare the market prices of hunting in the two countries, expected catch rates, average distance (and, thus, costs and consumer surplus) to the site for the hunters, and quality of the hunting experience at the study and policy sites..
NON-CONSUMPTIVE USE VALUES
The Termansen et al. (2004) study is relevant as it a Danish study (and captures the preferences of the same pulation as the one that is considdred to be affected here, i.e. the national Danish population. It provides an estimate for forest recreation per activity day in general in Denmark, and not for a unique area as the Mols bjerge. However, one should keep in mind that general forest recreation could be somewhat less attractive than the experience of walking in the fields along the Skjern River, and thus, Termansen et al. (2004) study should be used as a lower estimate.
NON-USE VALUE
For non-use values Dubgaard et al. (2003) transferred a reported willingness-to-pay (WTP) per household per year from a CV study of Pevensey Levels in the UK (Willis et al. 1996), which seems to be very similar to the Skjern River. However, in the Pevensey Level study the costs per respondent is stated in terms of a few pence per year per households, and respondents then will anchor their WTP on this very low amount and provide an estimate of the expected costs rather than expressing their “true” maximum WTP based on the benefits they expect to receive. Then, instead of transferring this unit value estimate as WTP/household/year as the guidelines recommend, they generalized to the whole UK population and converted this to a per ha value per year. They did this to correct both for differences in size of the study and policy site, and the differences in population size between the UK and Denmark. However, by doing this they assume that households´ WTP increase proportionally with size, i.e. a strict assumption that is seldom fulfilled. To avoid this rather arbitrary assumption, the guidelines suggest that we use the WTP per household per year. Thus, the UK WTP per household per year should be converted to DKK in the year of study using Purchase Power Parity (PPP) corrected exchange rates, and then adjusted with the Danish Consumer Price Index (CPI) to 2005-DKK using the same procedure as outlined for the hunting value (see Step 6 below). However, now we have the new valuation study of Lundhede et al. (2005). This study is also valuing a nature restoration project, just like the Skjern River project, but the Skjern River project is more comprehensive.
(iii) Richness in detail; primary studies should provide a detailed dataset and accompanying information
CONSUMPTIVE USE VALUES
With regard to recreational fishing, both Toivonen et al. (2000) and Hansen (2005) have the advantage of being primary studies that were designed with value transfer in mind, even though the scenarios run the risk of being more hypothetical (i.e. in both cases respondents were asked to value an environmental good that was to become available close to their house).[17]
The Dalin (2000) study has the disadvantage of reporting values for small game hunting in total only, and not distinguishing between different species.
NON-CONSUMPTIVE USE VALUES
The Termansen et al. study provides very detailed values for non-consumptive
use per activity day, based on different estimation models for the Random Utility Model (RUM) of the Travel Cost study.
NON-USE VALUES
Lundhede et al. (2005) performed a CE study in 2005 of a sample of both the entire Danish population and locally of a nature restoration project in the wetlands area of Store Åmose, and very detailed data are available. An assessment of similarities and differences between Store Åmose and the Skjern River was collected in order to increase the quality of the unit transfer exercise.
Step 5: Select and summarize the data available from the study site(s)
NON- CONSUMPTIVE USE
Termansen et al. (2004) value a day trip to forests in Denmark in general. They found a mean WTP of 20-28 2005-DKK per activity day, while Dubgaard et al. (2003) found an estimate of 38–56 2005-DKK per activity day for non-consumptive use of the more unique Mols Bjerge area. We will use the former estimate as a lower estimate.
NON-USE VALUE
Lundhede et al. (2005) found a mean WTP of 500 2005-DKK per year per person (in the national sample) for changing Store Åmose’s currently “low biological diversity” to a higher level described as “high biological diversity”. We can use this estimate directly if we assume that this qualitative change in the biodiversity attribute valued in the CE of Lundhede et al. (2005), is similar to a change of similar magnitude in the Skjern River project. However, the biodiversity is not exactly the same at Store Åmose as in Skjern River, and the stated WTP per individual should be converted to a ”per household” basis to better reflect the household as the smallest decision unit.. The meta-analysis of Lindhjem (2007) also showed that WTP was significantly higher when stated on an individual basis compared to a household basis (possibly because people find the household budget constraint more binding than personal budgets). This result supports the use of stated WTP per person as an expression of WTP per household, arguing that this is the correct unit for non-use values and that multiplying personal WTP by the household size to get WTP per household would result in upward biased results.
Step 6: Transfer value estimate from study site(s) to policy site
(i) Determine the transfer unit
According to our guidelines, the transfer unit for consumptive and non-consumptive recreational use should be consumer surplus (CS) per activity day (defined as one person performing the activity one day).[18]
For non-use values the transfer unit is WTP per household per year from a study site of similar national importance, or using the results from a study site of regional importance as a lower estimate of the non-use values. In order to avoid the possible added uncertainty of international value transfer we will use the latter strategy and transfer estimates from the national sample in the CE study of the Store Åmose wetlands (Lundhede et al. 2005).
(ii) Determine the transfer method for spatial transfer
For both use and non-use values we will use the unit value transfer, as more input data are needed for a proper function transfer, and function transfer in most cases do not perform better than unit value transfer (with adjustments).
iii) Determine the transfer method for temporal transfer
For transfer in time we either use DKK directly from a Danish study or convert the foreign currency into DKK in the year of the study using Purchase Power Parity (PPP) corrected exchange rates; see http://www.oecd.org/dataoecd/61/56/1876133.xls. Then we use the Danish Consumer Price Index (CPI) to adjust to 2005-DKK. Since we transfer from many recent Danish transfer studies, we avoid the added uncertainty of converting from one currency to another. We assume that the value of environmental goods increases at a rate proportional to the CPI.
CONSUMPTIVE USE VALUES
Recreational fishing
Since the existing primary Danish study for recreational fishing in a salmon and trout river (Toivonen et al. 2000) calculated a CS per fisherman per year (instead of activity day), on the assumption that this is a new river, we (realistically) assume that the number of fishing days per angler in this new river will be the same as the increased number of fishing days per angler for the existing angler, as a result of the Skjern River Project. Then we can just adjust the CS per fisherman from Toivonen et al. (2000) to 2005-DKK, which is 901 DKK for trout and salmon fishing (according to Appendix A - and using the same procedure as described below for hunting). Using this estimate multiplied by the number of existing fishermen (fishing for salmon and trout) will likely provide a lower estimate of the increased use value of recreational fishing, since the number of fishermen might increase and/or the quality of fishing for other species might also improve. (However, the largest improvement is expected for trout and salmon).
Hunting
Dalin (2000) reports a CS per hunting day of 82 2000-SEK. According to the guidelines we transfer unit values between countries, taking account of differences in currency, income and cost of living between countries by using the Purchase Power Parity (PPP) corrected exchange rates; see http://www.oecd.org/dataoecd/61/56/1876133.xls . In 2000 the PPP-value for 1 US $ is 8.41 DKK and 9.20 SEK. Dividing 8.41 by 9.20 we get that the 2000-SEK-value has to be multiplied by 0.914 (i.e. subtracting almost 9 %) to convert it into PPP-adjusted 2000- DKK. Then we use Appendix H to adjust the value to 2005-DKK. Looking at the column for Denmark in Appendix H, we see that the Consumer Price Index (CPI) for 2000 and 2004 is 123.6 and 133.8, respectively Dividing the CPI in 2004 with the CPI in 2000 gives a factor of 1.083 (i.e. an inflation rate for this period, up until January 2005, of about 8 %.). Thus the 2005-DKK value becomes 82 x 0.914 x 1.083 = 81 2005-DKK per activity day.
NON-CONSUMPTIVE USE VALUES
Again CS per activity day should be used, and this is carefully reported by Termansen et al. (2005). As the unit values are reported in the original study in terms of 2005-DK, there is no need to adjust them over time.
NON-USE VALUES
As stated above, we will use 500 DKK/person/year from Lundhede et al. (2005) as our estimate of the WTP/household/year.
7) Calculating total benefits or costs
(Only total benefits will be calculated here in the Skjern River case).
CONSUMPTIVE USE
For the Skjern River restoration project (and in many other cases) the most difficult part is to predict the increased or reduced number of hunting days and angling days (and/or increased number of hunters and anglers) as a result of the project, both in the project area and in adjacent areas (and/or the increase in CS per activity day; e.g. increased number of hunting days as a result of increased game density due to reducing the hunting area by 1,045 ha, and more restrictive hunting in the area where this is allowed). This should be based on expert estimates from Environmental Impact specialists in hunting and fishing, and from local, regional and national fishing and hunting associations. Sensitivity analyses with different assumptions for the change in number of hunting and fishing days should be performed.
Dubgaard et al. (2003) used expert estimates to find that 5000 recreational fishermen per year used the area. They assume that this number will not increase due to the project, but that their CS per year will increase (as a result of increased number of activity days and/or quality of the activity days). As we have no information about the increase in activity days, Dubgaard et al. just assume that the reported WTP per fisherman in Toivoinen et al. is representative for the annual WTP among the fishermen i Skjern River. This is a crude approximation, but in the absence of information about activity days for recreational fishing it is the best we can do since the national CV survey of recreational fishing reports WTP in this way. Thus, the annual benefit is 901 DKK/fisherman x 5,000 fishermen = 4,505,000 DKK. This benefit will accrue in all years to come, and thus we can apply equation 7 (p. 35) and calculate PV (with a 3 % social discount rate) as 4,505,000 / 0.03 = 150,166,167 DKK. With the recommended general transfer error bound of +/- 25-40%, this amounts to about 90 - 210 million DKK.
For hunting, Dubgaard et al. (2003), in absence of a valuation study to transfer from and expert assessment of the increase in number of hunting days, use the expert assessment of the expected increased price of a duck hunting licence per ha per year of 200 and 400 2003-DKK for public and private land, respectively (and 200 DKK/ha/year for areas surrounding the area). This should be seen as an estimate of increased producer surplus, and thus a lower estimate of the welfare impact of improved hunting (which could be seen as the minimum WTP among hunters to go duck hunting). Since we have no information of the number of hunting days, we unfortunately cannot utilise a transferred value per hunting day. Therefore, we will use the same approach as Dubgaard et al. (2003; p. 18-19): Private land: 240 ha x 400 DKK/ha/year; public land: 840 ha x 200 DKK/ha/year; and surrounding areas 1.045 ha x 200 DK/ha/year; which comes to a total of 473,000 2003-DKK/year. According to appendix H, the Danish CPI in 2003 (to give January 2004–values) was 132.3, while CPI for 2004 (January 2005) was 133.8; i.e. a percentage relative increase of CPI equal to 1 %. Thus, this amounts to 478,000 2005-DKK/year. Assuming again that this benefit will accrue in infinity, we can use the same PV equation as above, i.e. PV = 478,000 / 0.03 = 15,933,333 DKK. With the recommended general transfer error bound of +/- 25-40 %, this amounts to about 9,6 – 22,3 million DKK.
NON-CONSUMPTIVE USE
Again we need an estimate of the additional number of non-consumptive activity days to multiply with the unit value of WTP/activity day to arrive at total non-consumptive use values. Dubgaard et al. (2003) make an expert assessment (based on the difference in the visitation numbers for the Tipper Penninsula near the Skjern River area and the visitation to the Mols Bjerge) and recommend using an increase 90-100,000 visits (which they state are on the lower side). Since each visit is expected to last one day, this is also the number of increased activity days. Thus, annual total non-consumptive benefits are 100,000 activity days x 20-28 DKK/activity day = 2-2.8 million DKK. With infinite time horizon and a 3 % social discount rate this gives a PV of about 67-93 million DKK. With the recommended general transfer error bound of +/- 25-40%, this amounts to about 40-130 million DKK.
NON- USE VALUES
Since the Skjern River is unique in a national context, we will transfer the unit value found for Store Åmose for the national sample, for an increase from “low to high” for the biodiversity characteristic of the Choice Experiment (as this is the same general increase in biodiversity as we expect as a result of the restoration project). All Danish households will be defined as “affected”, and thus their mean WTP per year multiplied by the number of Danish households will be a measure of the annual non-use value of the Skjern River project.
If we assume that Skjern River is unique, and therefore benefits accrue to all Danish households, annual non-use value is 500 DKK x 2,516,682 households (according to Statistics Denmark 2006) = 1,258,341,000 DKK. With infinite time horizon and 3 % social discount rate this gives a PV of about 41.944 million DKK. With the recommended general transfer error bound of + 25-40%, this amounts to about 25,166 – 58,721 million DKK. This assumes that the Skjern River is considered to be a unique resource for Denmark. If we assume that there are close substitutes at the national, but not on the regional level, the observed WTP should be multiplied only by the regional population of Jutland which (according to Statistics Denmark) was 2,504,036 in 2006. With an average household size of 2.21 this gives 1,133,048 households. This could serve as a sensitivity analysis for calculating the total non-use benefits, which account for 1,133,048 households x 500 DKK/household = 566,524,000 DKK annually. PV with infinite time horizon is then 18,884 million DKK. Thus, with the same general transfer error the total non-use value is about 11,330 – 26,437 million DKK.
As this example shows, the total benefits are dominated by the non-use values. It is therefore very important to select a study to transfer from that was based on the population at the same geographical level as we have defined for our “affected population” at the policy site. By using a WTP estimate from a national survey to value a good where only a regional population is affected (as we assume in the sensitivity analysis above), we might underestimate total WTP if WTP per regional household for a regional good is higher than WTP per national household for a national good (assuming a distance decay in WTP), and overestimate if the opposite is true. Also, one should select a study where the reported WTP is not biased downwards due to anchoring on the stated (low) costs per household per year.
Another general lesson is that in value transfer, one should try to use the value as reported in the identified, suitable primary study, without conversion to an area-based unit[19]. This conversion involves strict assumptions that can easily be critized and therefore reduces the reliability and acceptability of the estimated aggregate benefits, and thus also the outcome of the CBA. A recent meta-analysis of CV and CE studies of non-timber benefits of forests (mainly-non-use value) in Norway, Sweden and Finland also clearly shows that WTP does not depend on the size of the forest area (Lindhjem 2006). This is probably due to the fact that people care for and state their WTP for the biodiversity preserved and other complex aspects of forests, rather than the sheer size of the area.
6 References
Adamowicz, V, P. Boxall, M. Williams and J. Louviere 1998: Stated Preference Approaches for Measuring Passive Use Values: Choice Experiments and Contingent Valuation. American Journal of Agricultural Economics, 80 (February 1998); 64-75.
Adams, R.M. and T.D: Crocker 1991: Material damages. Chapter IX in Braden, J.R. and C. D. Kolstad (eds.) 1991: Measuring the Demand for Environmental Quality, Elsevier Science Publishers B.V: (North-Holland).
Alberini, A, A. Hunt and A. Markandya 2004: Willingness To Pay To Reduce Mortality Risks: Evidence From A Three-Country Contingent Valuation Study. Paper presented at the Annual meeting of the European Association of Environmental and Resource Economists; Budapest, June 25-28 2004. http://eaere2004.bkae.hu/download/paper/alberini3paper.doc
Arrow, K.J., R. Solow, E. Leamer, P. Portney, R. Radner and H. Schuman 1993: Report of the NOAA Panel on Contingent Valuation. Federal Register, 58, 4601-4614 (January 15, 1993).
Atkinson, S.E, T.D. Crocker and J.F. Shogren 1992: Bayesian Exchangeability, Benefit Transfer and Research Effiency, Water Resources Research, 28(3), 715-722.
Barton, D. N. 1999: The Quick, the Cheap and the Dirty. Benefit Transfer Approaches to the Non-market Valuation of Coastal Water Quality in Costa Rica. Ph.D. thesis 1999.34, Department of Economics and Social Sciences, Agricultural University of Norway.
Barton, D. 2002: The transferability of benefit transfer: contingent valuation of water quality improvements in Costa Rica, Ecological Economics 42(1-2); 147-164.
Barton, D. and S. Mourato 2003: Transferring the Benefits of Avoided Health Effects from Water Pollution between Portugal and Costa Rica, Environment and Development Economics 8 (2); 351-372.
Bateman, Ian J. Richard T. Carson, Brett Day, Michael Hanemann, Nick Hanley, Tannis Hett, Michael Jones-Lee, Graham Loomes, Susana Mourato, Ece Özdemiroglu, David Pearce, Robert Sugden and John Swanson 2002: Economic Valuation With Stated Preference Techniques. A Manual. Edward Elgar Publishing, Cheltenham, UK and Northampton, MA, USA.
Bateman, I. J and K. G. Willis (eds.) 1999: Valuing Environmental Preferences. Theory and Practice of the Contingent Valuation Method in the US, EU and Developing countries. Oxford University Press, Oxford and New York.
Bennett, J. and Blamey, R. (eds.) 2001: The Choice Modelling Approach to Environmental Valuation. Edward Elgar, Cheltenham, UK.
Bergland, O., Fried, B. & Adams, R. 1996: Temporal stability of values from the contingent valuation method, paper to the 1996 EAERE conference, Lisbon.
Bergland, O., K. Magnussen and S. Navrud 1995: Benefit transfer: Testing for Accuracy and Reliability. Discussion Paper D-03/95, Department of Economics, Agricultural University of Norway. Revised version in Florax, R.J.G.M., P. Nijkamp and K. Willis (eds.) 2000: Comparative Environmental Economic Assessment: Meta Analysis and Benefit Transfer. Kluwer Academic Publishers.
Bishop, R. C., 2003. Where to from here? Pp.537-566. in Champ, P. A., Boyle, K. J., Brown, T. C. (eds.): A Primer on Nonmarket Valuation. Kluwer Academic Publishers, Dordrecht, the Netherlands
Boyle, K.J., G.L. Poe and J.C. Bergstrom 1994: What do we know about groundwater values? Preliminary implications from a meta analysis of contingent valuation studies. American Journal of Agricultural Economics 76 (December 1994); 1055-1061.
Brouwer, R., Langford, I.H., Bateman, I.J., Crowards, T.C. & Turner, R.K.(1999). A metaanalysis of wetland contingent valuation studies. Regional Environmental Change 1, 47-57.
Brouwer, R. 2000: Environmental value transfer: state of the art and future prospects. Ecological Economics, 32; 137-152.
Brouwer, R. and Bateman, I.J. (2005): The temporal stability and transferability of models of willingness to pay for flood control and wetland conservation, Water Resource Research, in press.
Brouwer, R. and F.A. Spaninks 1999: The validity of environmental benefit transfer: further empirical testing. Environmental and Resource Economics, 14 (1); 95-117.
Brouwer, R., I.H. Langford, I.J. Bateman, T.C. Crowards and R.K. Turner 1997: A Meta-analysis of Wetland Contingent Valuation Studies. CSERGE Working Paper GEC 97-20. Centre for Social and Economic Research on the Global Environment (CSERGE), University of East Anglia and University College London; 76 pp.
Carson, R.T. 1997: Contingent Valuation and Tests of Insensitivity to Scope. In Kopp. R., W. Pommerhene and N. Schwartz (eds.) 1997: Determining the Value of Non-marketed Goods: Economic, Psychological and Policy Relevant Aspects of Contingent Valuation Methods, Kluwer Academic Publishers, Dordrecht, The Netherlands.
Carson, R.T. 2000: Contingent Valuation: A User’s Guide. Environmental Science and Technology 34; 1413-1418.
Carson, R. T. forthcoming: Contingent Valuation. A Comprehensive Bibliography and History. Edward Elgar Publishing, Northampton, MA, USA.
Carson, R.T., N.E. Flores, K.M. Martin and J.L. Wright 1996: Contingent Valuation and Revealed Preference Methodologies: Comparing the Estimates for Quasi-Public Goods. Land Economics, 72, 80-99.
Carson, R.T., R.C. Mitchell, M. Hanemann, R.J. Kopp, S. Presser and P.A. Ruud 2003: Contingent Valuation and Lost Passive Use: Damages from the Exxon Valdez Oil Spill. Environmental and Resource Economics, 25, 3; 257-286.
Carson, R. T.; N.E. Flores and N. F. Meade 2001: Contingent Valuation: Controversies and Evidence. Environmental and Resource Economics, 19 (2); 173-210.
Champ, P. A., Boyle, K. J., Brown, T. C., 2003. A Primer on Nonmarket Valuation. Kluwer Academic Publishers (now: Springer) , Dordrecht, the Netherlands.
Chestnut, L. G., B. D. Ostro, et al. (1997). "Transferability of Air
Pollution Control Health Benefits Estimates from the United States to
Developing Countries: Evidence from the Bangkok Study." Amer J Agr
Econ 79(5): 1630-1635.
Constanza, R.; R. d'Arge, R. de Groot, S. Farber, M. Grasso, B. Hannon, K. Limburg, S. Naeem, R. O'Neill, J. Paruelo, R. Raskin, P. Sutton and M. van den Belt 1998: The value of ecosystem services: putting the issue in perspective. Ecological Economics 25 (1); 67-72 (reprinted from Nature 1997; 387; 253 –260.
Desvousges, W.H, F. R. Johnson and H.S. Banzhaf 1998: Environmental Policy Analysis with Limited Information.Principles and Applications of the Transfer Method. New Horizons in Environmental Economics. Edward Elgar, Cheltenham, UK and Northampton, MA, USA.
Downing, M. and T. Ozuno 1996: Testing the reliability of the benefit function transfer approach. Journal of Environmental and Resource Economics and Management, 30, 3; 316-322.
Dubgaard, A.; M.F. Kallesøe; J. Ladenburg and M. L. Petersen 2003: Cost-benefit analysis of the Skjern river restoration in Denmark. In R. Brouwer & D. Pearce (Eds.) 2004: Cost-Benefit Analysis and Water Resources Management, Edward Elgar Publishing, Cheltenham, UK.
European Commission – DG XII (1995, 1999). Externalities of Fuel Cycles (ExternE). Final reports. European Commission, DG XII - Research. www.externe.org
EC DG Environment 2000: Proceedings from a workshop on value of reducing the risk of ill-health or fatal illness. European Commission, Brussels 13th November 2000 http://europa.eu.int/comm/environment/
enveco/others/proceedings_of_the_workshop.pdf
EC DG Environment, 2002: Highlights from the workshop on the State-of-the-art in noise valuation. European Commission, Brussels 14th December 2001. Final report July 2002 by M. Vainio and G. Paque. http://europa.eu.int/comm/environment/noise/pdf/noise_valuation.pdf
Frykblom, P. and A. Helgeson 2002: Cost-benefitanalys inom miljöområdet: en kartläggning. Rapport 5198, Swedish Environmental Protection Agency (Naturvårdsverket) , Stockholm.
GARP II 1999: Final report of the Green Accounting Research Project II to the European Commission – DG XII, RTD Programme “Environment and Climate”, Contract ENV4-CT96-0285, November 1999.
Georgiou, S. and Bateman, I.J. (2005) Revision of the EU Bathing Water Directive: Economic Costs and Benefits, Marine Pollution Bulletin, 50(4): 430-438.
Hanley, N. and R.E Wright 2003: Testing for benefits transfer under the Water Framework Directive using Choice Experiment. Chapter 8 in Navrud, S. and R. Ready (eds.) 2007: Environmental Value Transfer: Issues and Methods. Springer, Dordrect, the Netherlands.
Kirchhoff, S., B. G. Colby and J.T. LaFrance 1997. Evaluating the
performance of benefit transfer: An empirical inquiry. Journal of
Environmental Economics and Management 33(1): 75-93.
Kristofersson, D. & S. Navrud 2003: Can use and non-use values be
transferred across countries? Chapter 12 in Navrud, S and R. Ready (eds.) 2007
Environmental Value Transfer: Issues and Methods. Springer, Dordrect, the Netherlands.
Kristofersson, D. & S. Navrud 2005: Validity Tests of Benefit Transfer – Are We Performing the Wrong Test? Environmental and Resource Economics 30 (3); 279-286.
Kriström, B. And Riera, P., 1996. Is the income elasticity of environmental improvements less than one? Environmental and Resource Economics, 7, 45–55.
Krupnick, A., Harrison, K., Nickell, E. and Toman, M. (1996). 'The value of health benefits from ambient air quality improvements in Central and Eastern Europe: An exercise in benefits transfer', Environmental and Resource Economics, 7, pp. 307-32
Krutilla, J.V. and Anthony C. Fisher 1975: The Economics of Natural Environments Studies in the Valuation of Commodity and Amenity Resources. John Hopkins Press, Baltimore, USA.
Lantz, V. And G. Slaney 2005: An Evaluation of Environmental Valuation Databases Around the World. Benefits Transfer and Valuation Databases: Are We Heading in the Right Direction? Paper presented at an International Workshop Sponsored by the U.S. Environmental Protection Agency’s National Center for Environmental Economics and Environment Canada; March 21-22 2005, Washington, D.C.
León, C.J. and F.J. Vazquez-Polo, N. Guerra, P. Riera, 2002, "A Bayesian Model for Benefits Transfer: Application to National Parks in Spain," Applied Economics, 34, 749-757.
León, C.J. and F.J. Vásquez-Polo 1998: A Bayesian Approach to Double Bounded Contingent Valuation, Environment and Resource Economics, 11; 197-215.
Lindhjem, H. 2006: 20 years of stated preference valuation of non-timber benefits from Fennoscandian forests: A meta-analysis. Journal of Forest Economics 12; 251-277.
Loomis, J.B. 1992: The evolution of a more rigorous approach to benefit transfer: Benefit function transfer. Water Resources Research, 28 (3), 701-706.
Loomis, J.B. and D.S. White 1996: Economic benefits of rare and endangered species: summary and meta-analysis. Ecological Economics 18; 197-206.
Lundhede, T., Hasler, B. & Bille, T. 2005 Værdisætning af naturgenopretning og bevarelse af fortidsminder i Store Åmose i Vestsjælland. Under udgivelse som rapport fra Skov og Naturstyrelsen, København.
Magnussen, K. 1993: Mini meta analysis of Norwegian water quality improvements valuation studies. Norwegian Institute for Water Research, Oslo. Unpubl. paper, 29 p.
McLeod, D., & O. Bergland 1999: "Willingness-to-Pay Estimates Using the Double-Bounded Dichotomous-Choice Contingent Valuation Format: A Test for Validity and Precision in a Bayesian Framework", Land Economics, 75(1):115-125.
Metroeconomica 2004: Costing the Impacts of Climate Change in the UK. Implementation Guidelines. UK Climate Impacts Programme (UKCIP).
http://www.ukcip.org.uk/resources/publications/pub_dets.asp?ID=54
Ministry of Finance 2005: Guide to economic analysis (Veileder i samfunnsøkonomiske analyser). Norwegian Ministry of Finance, Oslo, 24. September 2005 . http://odin.dep.no/fin/norsk/regelverk/
veiledninger/007021-990004/dok-bn.html .
Muthke, T. and K. Holm-Mueller 2004 National and International Benefit Transfer Testing with a Rigorous Test Procedure. .Environmental and Resource Economics; 29 (3); 323-336.
Navrud, S. 1992: Pricing the European Environment. Scandinavian University Press / Oxford University Press, Oslo, Oxford, New York
Navrud, S. and M. Vågnes 2000: Assessment of Environmental Valuation Reference Inventory (EVRI) and the Expansion of Its Coverage to the EU. Parts I, II and III. EC DG Environment
http://europa.eu.int/comm/environment/enveco/studies2.htm#24
Navrud, S. 2004: Value transfer and environmental policy. Chapter 5 (pp. 189-217) in Tietenberg, T. and H. Folmer (eds.) 2004: The International Yearbook of Environmental and Resource Economics 2004/2005. A survey of Current Issues. Edward Elgar Publishing, Cheltenham, UK and Northampton, MA, USA.
Navrud, S. and G.J. Pruckner 1997: Environmental Valuation - To Use or Not to Use? A Comparative Study of the United States and Europe. Environmental and Resource Economics, 10 (1); 1-26.
Navrud, S. and R. Ready (eds.) 2007: Environmental Value Transfer: Issues and Methods. Springer, Dordrect, The Netherlands.
OECD 1994: Project and Policy Appraisal: Integrating Economics and Environment. Organisation for Economic Co-operation and Development (OECD), Paris, ISBN 92-64-14107-3.
OECD 1995: The Economic Appraisal of Environmental Projects and Policies. A Practical Guide. Organisation for Economic Co-Operation and Development (OECD), Paris, ISBN 92-64-14583-4.
Rosenberger, Randall S. and Loomis, John B. 2001. Benefit transfer of outdoor recreation use values: A technical document supporting the Forest Service Strategic Plan (2000 revision). Gen. Tech. Rep. RMRS-GTR-72. Fort Collins, CO: U.S. Department of Agriculture, Forest Service, Rocky Mountain Research Station. 59 p. http://www.fs.fed.us/rm/pubs/rmrs_gtr72.pdf
Ready, R.C. S. Navrud, B. Day, R. Dubourg, F. Machado, S. Mourato, F. Spanninks and M.X.V. Rodriquez 2004: Benefit Transfer in Europe. How Reliable Are Transfers Between Countries? Environmental and Resource Economics 29; 67-82 (August 2004).
R. C. Ready, S. Navrud and R. Dubourg 2001: How Do Respondents with Uncertain Willingness To Pay Answer Contingent Valuation Questions? Land Economics, 77(3); 315-326, August 2001
Rosenberger, R.S. and T.P. Phipps. 2002. Site Correspondence Effects in Benefit
Transfer: A Meta-Analysis Transfer Function. Paper presented at the 2nd World
Congress of Environmental and Resource Economists, June 22-27, 2002, Monterey, CA.
Rozan A., 2004: Benefit Transfer: A comparison of WTP for Air Quality between France and Germany, Environmental and Resource Economics, 29, 295-306.
Ruijgrok, E. C. M. 2001: Transferring economic values on the basis
of an ecological classification of nature. Ecological Economics 39(3): 399-408.
Santos, J.M.L. 1998: The Economic Valuation of Landscape Change. Theory and Policies for Land Use Conservation. Edward Elgar, Cheltenham, UK.
Scarpa, R., G. W. Hutchinson, S. M. Chilton and J. Buongiorno 2003: Reliability of benefit value transfers from Contingent Valuation Data with Forest-Specific Attributes. Chapter 11 in Navrud, S. and R. Ready (eds.) 2007: Environmental Value Transfer: Issues and Methods.Springer, Dordrect, the Netherlands.
Selvanathan, S. and E. Selvanathan (1993): A Cross Country Analysis of Consumption Patterns, Applied Economics 25, 1245-1259.
Shrestha, R. K. and J. B. Loomis 2001: Testing a meta-analysis
model for benefit transfer in international outdoor recreation. Ecological
Economics 39(1): 67-83.
Smith, V.K. 1992: On separating defensible benefit transfers from smoke and mirrors. Water Resources Research 28, (3) 685-694.
Smith, V.K. and J.C. Huang 1993 : Hedonic models and air pollution. Twenty-five years and counting. Environmental and Resource Economics 3, 381-394.
Smith, V.K. and Y. Karou 1990: Signals or noise? Explaining the variation in recreation benefit estimates. American Journal of Agricultural Economics, 72 (2). 419-433.
Smith, V.K. and L. Osborne 1996: Do Contingent Valuation Estimates Pass a "scope" Test? A Meta Analysis. Journal of Environmental Economics and Management, 31 (3), 287-301.
Smith, V.K.; G. Van Houtven and S.K. Pattanayak 2002: Benefit Transfer via Preference Calibration: “Prudential Algebra” for Policy. Land Economics, 78 (1); 132-152.
Soutukorva, Å. og T. Söderqvist 2005: Kvalitetskriterier för ekonomiska miljövärderingsstudier. Naturvårdsverket, Stockholm. ISBN 91-620-1247-9
Sturtevant, L.A., Johnson, F.R. and W.H. Desvousges 1995: A meta-analysis of recreational fishing. Triangle Economic Research, Durham, North Carolina, USA.
Sundberg, S. and Söderqvist, T. 2004. ValueBaseSWE: A valuation study database for environmental change in Sweden. Available at www.beijer.kva.se/valuebase.htm, Beijer International Institute of Ecological Economics, The Royal Swedish Academy of Sciences, Stockholm.
Tamborra, M. 1999: Towards a Green Accounting System for the European Union: the Contribution of GARP II. FEEM newsletter no. 2 1999 (November 1999); 16-18. Fondazione Eni Enrico Mattei (FEEM), Milano, Italy.
Toivonen, A.L; H. Appelblad; B. Bengtsson, P. Geertz-Hansen, G. Gudbergsson, D. Kristofersson, H. Kyrkjebø, S. Navrud, E. Roth, P. Tuunainen & G. Weissglas, G. 2000: The Economic Value of Recreational Fisheries in the Nordic Countries.. TEMA Nord Report 2000:604, 68 pp., ISSN: 0908-6692; Nordic Council of Ministers, Copenhagen.
Zandersen, M., M. Termansen and F. Søndergaard Jensen 2005: Benefit transfer over time of ecosystem values. The case of forest recreation in Denmark. Working Paper FNU 61 (February 2005; Updated August 2005). A preliminary version presented at the EAERE conference in Bremen June 2005.
http://www.webmeets.com/files/papers/EAERE/2005/
299/Benefit%20Transfer%20over%20time.pdf
UNEP 1995: Global Biodiversity Assessment. (Chapter 12: Economic values of Biodiversity). United Nations Environment Program (UNEP), Cambridge University Press. ISBN 0-521-56481-6.
Walsh, R.G., D.M. Johnson and J.R. McKean 1990: Nonmarket values from two decades of research on recreation demand. Advances in applied micro-economics, vol. 5, 167-193, JAI Press Inc.
Walsh, R.G., D.M. Johnson and J.R. McKean 1992: Benefit transfer of outdoor recreation demand studies, 1968-1988. Water Resources Research, 28, (3) 707-714.
White, J. 2005: Envalue and Benefit Transfer in Australia. Paper presented at an International Workshop Sponsored by the U.S. Environmental Protection Agency’s National Center for Environmental Economics and Environment Canada; March 21-22 2005, Washington, D.C.
Willis, K. G., D. Garrod, J. Benson and M. Carter 1996: Benefits and Costs of the Wildlife Enhancement Scheme: A Case Study of the Pevensey Levels. Journal of Environmental Planning and Management, 39 (3); 387-402
Woodward, R.T. & Wui, Y.S. (2001). The economic value of wetland services: a meta-analysis. Ecological Economics 37, 257-70.
Appendix A: Table of Danish primary valuation studies on priority environmental goods
Water
| Reference/ authors |
Year of data collection | Valuation method and relevant information | WTP (DKK in year of data collection) per household/indivi-dual and per year or as a one-time amount) | WTP in 2005-DKK |
Sample size |
| Hasler, B., Lundhede, T., Martinsen, L. Neye, S. & Schou, J.S.: Valuation of groundwater protection versus water treatment in Denmark by Choice Experiments and Contingent Valuation, NERI Technical Report no. 543. 2005 | 2004 | CE and CV Payment vehicle: Increase in annual water bill Elicitation format CV: Payment card Interview method: Postal Population: Danish population Sample: Representative of the Danish population Testing/focus group Pre-tested questionnaire |
WTP per household/year CE: Naturally clean groundwater 1,899 Very good conditions for plant and animal life (i.e. good surface water quality) 1,204 Total 3,104 Purified water 912 CV: Very good conditions for plant and animal life (i.e. good surface water quality 711 Purified water 529 |
1,899 1,204 3,104 912 711 529 |
n = 584 Response rate = 65% |
| Reference/ authors |
Year of data collection | Valuation method and relevant information | WTP (DKK in year of data collection) per household/individual and per year or as a one-time amount) | WTP in 2005-DKK |
Sample size |
| Toivonen, A.L., Appelblad, H., Bengtsson, B., Geertz-Hansen, P., Gudbergsson, G., Kristofersson, D., Kyrkjebo, H., Navrud, S., Roth E., Tuunainen P.and Weissglas, G.: Economic Value of Recreational Fisheries in the Nordic Countries. Nordic Council of Ministers, 2000. |
October 1999 - January 2000 | CV Payment vehicle: Increase in income taxes Elicitation format CV: DC and OE Interview method: Postal Population: Danish Sample: Representative Testing/focus group: Pretest |
WTP/inidividual/year Use value Recreational fishing Salmon and sea trout River: 809 Perch, pike, pike-perch Lake: 648 Grayling, brown trout, arctic char Lake : 889 Use and non-use value Preservation of Nordic freshwater fish stocks: 2150 |
901 722 990 2395 |
The sample size was 25 000 Nordic citizens aged 18 - 69. n = 2 376 in Denmark Response rate = 45.8 %. |
Landscape
| Reference/ Authors |
Year of data collection | Valuation method and relevant information | WTP (DKK in year of data collection) per household/individual and per year or as a one-time amount) | WTP in 2005-DKK |
Sample size |
| Jordal-Jørgensen, J., : Samfundsmæssig værdi af vindkraft. Copenhagen, Denmark. 1995. | 1995 | CV and (simplified) HP Payment vehicle: Not known Elicitation format CV: Not known Interview method: Personal Population: Houses next to windmills across Denmark Sample: Not known Testing/focus group Not Known HP |
WTP for moving the windmills per household/year 1236 DKK /year for the households that said they were annoyed by the windmills and stated their WTP All wind mill sites 0.0004 DKK/kWh Single mills 0.0011 DKK/kWh Clusters of mills 0.0009 DKK/kWh Wind parks 0.0002 DKK/kWh All wind mill sites 0.0098 DKK/kWh |
0.0047 0.00128 0.00105 0.0023 0.01140 |
A random sample of 102 of 1,931 wind farms was drawn, and used for CV and HP6.1.1.1.1.1 CVn = 281 Response rate = 71 %6.1.1.1.1.2 HP Property prices of 74 properties situated close to windmills were studied |
| Reference/ Authors |
Year of data collection | Valuation method and relevant information | WTP (DKK in year of data collection) per household/individual and per year or as a one-time amount) | WTP in 2005-DKK |
Sample size |
| Anthon, S. and Thorsen, B.J. 2002: Værdisætning af statslig skovrejsning. En husprisanalyse [Valuing afforestation – a hedonic approach]. Report for the Forest and Nature Agency, Ministry of the Environment, Denmark, 57 pp. | Data collection 1984-2001 |
HP True Skov by Århus (100 ha) and Bakkely Skov by Vemmelev (60 ha.) Model assuming that WTP as house price decline with increasing distance to the forest. |
HP True Skov 29 – 32 mill Bakkely Skov 2 - 4 mill. |
29.9 – 33 mill 2.1- 4.1 mill |
598 houses for the community of True 233 houses for Vemmelev community |
| Boiesen, J., Jacobsen, J.B., Thorsen, B.J., Strange, N. & Dubgaard, A. 2005. Værdisætning af de danske lyngheder. Arbejdsrapport, KVL, Frederiksberg. |
2004 | CE and CV Payment vehicle: Annual income tax earmarked for the purpose Elicitation format: DC Interview method: Postal Population: Danish population Sample: Representative of the Danish population Testing/focus group Pre-tested questionnaire sent to 200 respondents |
WTP per household/year CE: Increased area of moorland 400-750 CV Increased area of moorland 300 |
400-750 300 |
n=899 Response rate=56.7 % |
| Reference/ authors |
Year of data collection | Valuation method and relevant information | WTP (DKK in year of data collection) per household/individual and per year or as a one-time amount) | WTP in 2005-DKK |
Sample size |
| Bjørner, T., Russel, C.F., Dubgaard, A., Damgaard, C. & Andersen, L.M. 2000: Public and private preferences for environmental quality in Denmark, AKF forlaget. | 1999 Comment: Survey for testing methodological issues like the framing effect |
CV Payment vehicle: Annual pass for a forest and lake area Elicitation format: OE Interview method: Postal Population: Respondents were chosen in three municipalities close to Tokkekøb Hegn Sample: Representative Testing/focus group Focus groups and pretesting |
WTP/individual for an annual admission card 233-261 annually for access to Tokkekøb Hegn |
252-283 | n = 2 581 Response rate = 69.8 % |
| Reference/ authors |
Year of data collection | Valuation method and relevant information | WTP (DKK in year of data collection) per household/indivi-dual and per year or as a one-time amount) | WTP in 2005-DKK |
Sample size |
| Dubgaard, A.: Economic Valuation of Recreation in Mols Bjerge. 1996. AKF Forlaget SØM publikation, 11,1-230. | 1991-1992 | CV Payment vehicle: A lump sum for unlimited admission to Mols Bjerge area during a one year period (annual pas). Elicitation format: OE and DC Interview method: Self-fill questionnaire Population: 130 000 estimated users of the area Sample: On-site sampling on 20 representative visit days during one year. Weighting to adjust for on-site sampling bias. Testing/focus group: No information given. |
WTP/individual for a annual admission card 44-71 (30 – 50 per activity day) |
56-84 (38 – 56 per activity day) |
n = 3000 divided in 13 sub-samples |
| Reference/ authors |
Year of data collection | Valuation method and relevant information | WTP (DKK in year of data collection) per household/individual and per year or as a one-time amount) | WTP in 2005-DKK |
Sample size |
| Dubgaard, A.: Economic Valuation of Recreational Benefits from Danish Forests, in S. Dabbert, A. Dubgaard, L. Slangen & M. Whitby (Eds.): The Economics of Landscape and Wildlife Conservation, CAB International, Wallingford, UK, 1998. [53-64] | 1993-1994 | CV Payment vehicle: Lump sum for unlimited admission to all Danish forests for one individual during a one year period (Annual Pass) Elicitation format: OE Interview method: Mail questionnaire Population: Permanent residents in Denmark within the age groups 15-76 years Sample: Representative of the population. Testing/focus group: No information given. |
WTP/individual for a annual admission card 128 |
165 | n = 2 424 Response rate = 83.7% |
| Reference/ authors |
Year of data collection | Valuation method and relevant information | WTP (DKK in year of data collection) per household/indivi-dual and per year or as a one-time amount) | WTP in 2005-DKK |
Sample size |
| Hasler, B., Damgaard, C.K., Erichsen, E.H., Jørgensen, J.J. & Kristoffersen, H.E. 2002: De rekreative værdier af skov, sø og naturgenopretning. - værdisætning af naturgoder med husprismetoden. AKF Forlaget. | Data collection 1985-2000 |
HP Houseowners' willingness to pay for forest amenities in four forested areas in Denmark. The analysis also includes an analysis of the houseowners' willingness to pay for lake views in six lake areas in Denmark and for houses close to the forest. |
HP Houses with a view to a lake are on average valued 125,000 higher Covering differences between the lakes the value ranges from 330,000 at one lake and to 0 at another. House prices are declining by 0.04% when the distance to the forest increases by 1%. |
129,000 341,000 |
289 transactions for lake view 1 483 transactions for forest |
| Reference/ authors |
Year of data collection | Valuation method and relevant information | WTP (DKK in year of data collection) per household/ individual and per year or as a one-time amount) |
WTP in 2005-DKK |
Sample size |
| Olsen , S. B. & Lundhede, T. 2005: Rekreative værdier ved konvertering til naturnær skovdrift. En værdisætningsunder-søgelse udført vha. metoden Discrete Choice Experiments. Specialerapport, akf-forlaget. | 2004. Comment: Master thesis. |
6.1.1.2 Choice Experiment
Interview method: Postal Population: Danish population Sample: Representativeness discussed Testing/focus group Pre-testing and focus groups |
WTP per household/year Conifer to deciduous forest 770 Conifer to mix of deciduous and conifer 969 Deciduous to mix of conifer and deciduous 199 Clear cut to shelterwood harvest regime 205 Clear cut to selective harvest regime 856 From shelterwood to selective harvest regime 651 No dead trees left to some dead trees left for natural decay 114 |
770 969 199 205 856 651114 |
n = 1200 Response rate: 57% |
| Reference/ authors |
Year of data collection | Valuation method and relevant information | WTP (DKK in year of data collection) per household/individual and per year or as a one-time amount) | WTP in 2005-DKK |
Sample size |
| Termansen, M., C.J. McClean, and R. Scarpa: "Economic Valuation of Danish Forest Recreation Combining Mixed Logit Models and GIS", Paper presented at the Association of Environmental and Resource Economists Conference. Budapest, Hungary. 2004 | 1994 and 1997 DKK | Count data models, Travel cost method – RUM Value of day-trip forest recreation in Denmark, and of various improvements to forest recreation sites viewpoints The probability of an individual choosing each site was modelled as a function of travel costs; forest area; proportion of broadleaved trees; site proximity to the coast; natural area bordering the site. |
Fixed Parameter Model Mixed Mean Value Per Trip (DKK/Trip) 22.8 Maximum Value for a Site (Million DKK/Year) 5.6 Minimum Value per Trip (DKK/Trip) 22,584 Total Value for All Sites (Million DKK/Year) 1,301 Logit Model Mixed Mean Value Per Trip (DKK/Trip) 24.7 Maximum Value for a Site (Million DKK/Year) 14.2 Minimum Value per Trip (DKK/Trip) 17,201 Total Value for All Sites (Million DKK/Year) 1,405 |
26.5 6.5 26,265 1,513 28.7 16.5 20,005 1,634 |
On-site survey n = 28,947; Response rate = 50% was used to estimate the Random Utility Models. Household survey n = 812 response rate = 83.7% was used to estimate the total demand for recreational trips |
| Reference/ Authors |
Year of data collection | Valuation method and relevant information | WTP (DKK in year of data collection) per household/individual and per year or as a one-time amount) | WTP in 2005-DKK |
Sample size |
| Olsen, S.B., J. Ladenburg, M.L. Petersen, U. Lopdrup, A.S. Hansen and A. Dubgaard: Motorways versus nature – A welfare economic valuation of impacts. IMV-rapport 2005 | 2005 | CVM – Postal WTP to ensure realisation of preferred layout out of two possible layouts for the future Silkeborg motorway. Population: People in Silkeborg and Gjern municipalities CE – Internet and postal WTP to protect different types of nature from encroachment by a new motorway Population: The Danish population Samples: Discussion of Representativeness Pre-testing and focus groups employed A range of experiments is carried out |
Respondents preferring: - Resendal layout 660/477 DKK (Open ended(OE)/double bounded dichotomous choice(DBDC)) per household per year - Ringvej layout 1023/542 (OE/DBDC) DKK per household per year Forest: From 10 to 5 km motorway 460 DKK. From 10 to 0 km motorway 912 DKK Wetland: From 5 to 2.5 km motorway 476 DKK From 5 to 0 km motorway 783 DKK Heath: From 5 to 0 km motorway 341 DKK per household per year |
660/477 1023/542 460 912 476 783 341 |
n = 2000 Response rate: 74% Internet n = 5830 Response rate: 50.1% Postal n = 600 Response rate: 60.5% |
Ecosystem function and biodiversity
| Reference/ authors |
Year of data collection | Valuation method and relevant information | WTP (DKK in year of data collection) per household/indivi-dual and per year or as a one-time amount) | WTP in 2005-DKK |
Sample size |
| Bjørner T., Hauch, J. & Jespersen, S. 2004: Biodiversitet, sundhed og usikkerhed - en værdisætningsunder-søgelse ved contingent ranking metoden. Working paper from the secratariat of the Danish Economic Council (DØRS). 2004. | 2004 | CR Payment vehicle: Increase in the price of food products Interview method: Personal interview Population: Danish population Sample: Representative of the Danish population Testing/focus group Focus group and pre-test |
WTP per household/year 213-230 DKK annually per household for a one percent increase in the population of birds. |
213-230 | n = 1000 Response rate not given. |
| Reference/ authors |
Year of data collection | Valuation method and relevant information | WTP (DKK in year of data collection) per household/indivi-dual and per year or as a one-time amount) | WTP in 2005-DKK |
Sample size |
| Lundhede, T., Hasler, B. & Bille, T. 2005 Værdisætning af naturgenopretning og bevarelse af fortidsminder i Store Åmose i Vestsjælland. Skov og Naturstyrelsen, København. 2005 |
2005 | 6.1.1.3 CE
Payment vehicle: Additional tax Interview method: Internet based questionnaire Population: The entire Danish population and locally in the area of Store Åmose Sample: A sample of the population of the entire country and a sample of the population of West Zealand. Testing/focus group Pre-test and focus groups |
WTP per individual /year DKK 500 per year per person for changing Store Åmose’s currently »low biological diversity« to a higher level described as »high biological diversity |
500 | n = 1,636 Response rate 51%. |
| Reference/ authors |
Year of data collection | Valuation method and relevant information | WTP (DKK in year of data collection) per household/indivi-dual and per year or as a one-time amount) | WTP in 2005-DKK |
Sample size |
| Hansen, M. 2005: Værdien af at genoprette naturen i danske ådale.Værdisætning af rekreative og biologiske værdier - som resultat af tre vandmiljøplaner, Vandramme- og Habitatdirektivet. Center for Skov og Landskab, KVL, København | 2005 | 6.1.1.4 CE
Payment vehicle: Additional income tax Interview method: Postal survey Population: Entire Danish population Sample: Entire Danish population, but individuals with high income and high level of education are overrepresented Testing/focus group Pre-test and focus group |
WTP per household /year General scenario made for value transfer: “For a (hypothetical) wetland/river area near your home or holiday cottage”: - Conversion from intensive agriculture to natural grass land (136), with wetlands (164) with scrubs/trees (252) - Re-bending of streams: 410 DKK - Improved living conditions for plants and animals; low to medium (257) or high (400) - Access (320) All above (i.e. largest improvement) |
136-252 410 257-400 320 1382 |
n = 744 Response rate 53%. |
Soil Quality
| Reference/ authors |
Year of data collection | Valuation method and relevant information | WTP (DKK in year of data collection) per household/ individual and per year or as a one-time amount) |
WTP in 2005-DKK |
Sample size |
| Szilas, C., A. Zeuthen Jeppesen & L. Kaalund 2005: Værditab ved salg af forurenede eller tidligere forurenede ejendomme med helårsbeboelse. Hovedrapport. Miljøprojekt nr. 1046. Rapport til Miljøstyrelsen og Amternes Videncenter for Jordforurening, 2005 |
1996-2003 Residential property transactions |
6.1.1.5 Simplified HP
Uses market price divided by officially assessed value with potential corrections for contaminated soils as a proxy for difference in housing and neighbourhood characterter- istics. Population: Danish residential property transactions that were listed in databases of contaminated or possibly contaminated sites = 7,756 transactions out of a total of 693,160 transactions for the period 1996-2003. |
Average percentage (%) reduction in residential property market price for five categories of contaminated soils: Suspicion (possibly contaminated) 5.7 Contaminated 2.1 Cleaned up: 0.1 Residual contamination: 7.0 Investigated, but no findings: 7.8 Also available: Data for three Danish regions, urban/rural, and house/ appartment |
The present value of the welfare loss due to living in a contaminated or possibly contaminated site can be calculated by multiplying the market price by the percentage reduction in property market price | n = 6,925 residential property transactions |
Marine and Coastal
| Reference/ authors |
Year of data collection | Valuation method and relevant information | WTP (DKK in year of data collection) per household/individual and per year or as a one-time amount) | WTP in 2005-DKK |
Sample size |
| Ladenburg, J., Dubgaard, A., Martinsen, L. and Tranberg, J. 2005: Economic Valuation of the Visual Externalities of Off-Shore Wind Farms, Report from the Food and Resource Economic Institute, Report No. 178, Copenhagen. | 2004 | CE Payment vehicle: Increased annual electricity bill per household Interview method: Postal Population: i) National population, ii) Local population of Horns Rev (HR) and Nysted (NY) coastal areas Sample: Representative of the Danish poulation and the HR and NY areas Testing/focus group Focus group and pre-test |
WTP per household/year: For increasing the distance of wind farms from the shore from an 8 km baseline to 12, 18 and 50 km (when it is out of sight). Based on respondents’ choices between alternative off-shore wind farm locations and the associated increase in the electricity bill. National sample: 12 km: 330 18 km 707 50 km 9046.1.1.5.1 HR local sample 12 km: 262 18 km 643 50 km 5916.1.1.5.2 NY local sample 12 km: 666 18 km 743 50 km 1223 |
National sample: 12 km: 330 18 km 707 50 km 9046.1.1.5.3 HR local sample 12 km: 262 18 km 643 50 km 5916.1.1.5.4 NY local sample 12 km: 666 18 km 743 50 km 1223 |
n = 362 (national), n = 140 (HR) n = 170 (NY) Response rate = 51, 40 and 49 %, out of 700 national , 350 HR and 350 NY; respectively |
Appendix B: List of Danish valuation studies on priority environmental goods
This list is a preliminary list of Danish valuation studies, including both the primary studies presented in more detail in the table in Appendix A, primary studies not published yet, and value transfer exercises.
The list focuses on the environmental goods that Miljøstyrelsen (Danish Environmental Protection Agency) gives priority to: surface water quality, groundwater quality, (including drinking water) marine and coastal areas, soil quality, landscape aesthetics (including recreation), ecosystem functions and biodiversity. Some of the studies are presented in more detail in the table in Appendix A
Surface water quality
Hasler, B., Lundhede, T., Martinsen, L. Neye, S. & Schou, J.S.Valuation of groundwater protection versus water treatment in Denmark by Choice experiments and Contingent Valuation, NERI Technical Report no. 543. (www.dmu.dk)
Primary study, in the table.
Toivonen, A.L., Appelblad, H., Bengtsson, B., Geertz-Hansen, P.,
Gudbergsson, G., Kristofersson, D., Kyrkjebo, H., Navrud, S., Roth E.,
Tuunainen P.and Weissglas, G. Economic Value of Recreational Fisheries in the Nordic Countries. Nordic Council of Ministers, 2000.
http://www.evri.ca/english/screener/
screener.cfm?process=next&fa4af=0.19184798
Primary study, in the table.
Groundwater quality
Hasler, B., Lundhede, T., Martinsen, L. Neye, S. & Schou, J.S. Valuation of groundwater protection versus water treatment in Denmark by Choice experiments and Contingent Valuation, NERI Technical Report no. 543. (www.dmu.dk)
Primary study, in the table (same study as Hasler et al in ”Sureface water quality”)
Hasler, B., Schou, J.S. & Andersen, M.S. 2004: Forprojekt til værdisætning af grundvand. Miljøstyrelsen. - Miljøprojekt 969: 67 s. (elektronisk).
Findes på: http://www.mst.dk/udgiv/publikationer/
2004/87-7614-465-8/pdf/87-7614-466-6.pdf . Pretest; and not in the table.
Landscape
Landscape aestethics windmills
Jordal-Jørgensen, J., "Samfundsmæssig værdi af vindkraft. Delrapport: Visuelle effekter og støj fra vindmøller - kvantificering og værdisætning." (Social Costs of Wind Power: Partial Report of Visual Impacts and Noise from Windmills), Institute for Local Government Studies (AKF), Copenhagen, Denmark 1995, 1995
http://www.evri.ca/english/screener/screener.cfm?
process=next&fa4af=0.18751445
Primary study, in the table
Moorland
Boiesen, J., Jacobsen, J.B., Thorsen, B.J., Strange, N. & Dubgaard, A. 2005. Værdisætning af de danske lyngheder. Arbejdsrapport, KVL, Frederiksberg.
Primary study, in the table
Wetland
Lundhede, T., Hasler B. & Bille T. 2005. Værdisætning af naturgenopretning og bevarelse af fortidsminder i Store Åmose i Vestsjælland. Rapport fra Skov og Naturstyrelsen, København.
Landscape along motorways
Olsen, S.B., Ladenburg, J., Petersen, M.L., Lopdrup, U., Dubgaard, A., Hansen, A.S. (2005): Motorways versus nature - A welfare-economic valuation of impacts. Under udgivelse som rapport fra IMV. (Choice experiment and Contingent Valuation (additional tax) of entire Danish population and locally in the Silkeborg and Gjern municipalities).
Forthcomming, not in the table
Forests
Anthon, S. and Thorsen, B.J. 2002: Værdisætning af statslig skovrejsning. En husprisanalyse [Valuing afforestation – a hedonic approach]. Report for the Forest and Nature Agency, Ministry of the Environment, Denmark, 57 pp.
http://www.sl.kvl.dk/upload/statslig_skovrejs.pdf
Primary study, in the table
Birr-Pedersen, K.: Amenity values from afforestation projects in Denmark – Comparing benefits across sites. 6th International Conference of the European Society for Ecological Economics (ESEE), Lisbon, Portugal, 14-17 June 2005.
Available at: http://www.esee2005.org/papers/124_1105729129148.pdf
HP study, no results, not in the table.
Bjørner, T., Russel, C.F., Dubgaard, A., Damgaard, C. & Andersen, L.M. 2000: Public and Private Preferences for Environmental Quality in Denmark. SØM publication no 39. AKF forlaget. København. Available at http://www.akf.dk/som/pdf/som39.PDF
Primary study, in the table
Dubgaard, A. 1996: Economic Valuation of Recreation in Mols Bjerge. AKF Forlaget SØM publikation, 11,1-230. Summary available at http://www.akf.dk/eng/mols.htm
Primary study, in the table.
Dubgaard, A. 1998: Economic valuation of recreational benefits from Danish Forests. In: “The economics of Landscapes and Wildlife Conservation”, pp. 53-64, CAB International.
Not found, not in the table.
Dubgaard, A. 2001: Værdisætning af Vestskoven. Refereret i: Det Økonomiske Råd: Dansk Økonomi, Efterår 2000.
Not found, not in the table.
Dubgaard, A. 2003 Willingness to Pay for Recreational Use of a New Urban Forest. Royal Veterinary and Agricultural University, Department of Economics and Natural Resources
Not found, not in the table
Hasler, B., Damgaard, C.K., Erichsen, E.H., Jørgensen, J.J. & Kristoffersen, H.E. 2002: De rekreative værdier af skov, sø og naturgenopretning. - værdisætning af naturgoder med husprismetoden. AKF Forlaget. 171 s. Findes på: http://www.akf.dk/dk2002/pdf/naturgenopretning.pdf
8. Primary study, in the table
Ladenburg J. & Martinsen 2004 L. Danish consumerns’ willingness to pay for certified wood products. Unit of economics Social Sciences series (blue series) no.14, KVL, Copenhagen
Primary study, in the table
Olsen , S. B. & Lundhede, T. 2005: Rekreative værdier ved konvertering til naturnær skovdrift. En værdisætningsundersøgelse udført vha. metoden Discrete Choice Experiments. Specialerapport, akf-forlaget.
Not found, not in the table
Præstholm, S., Jensen, F.S., Hasler, B., Damgaard, C.K. & Erichsen, E.H. 2002: The multiple values of Forest and Afforestation in Denmark. In: Elands, B. (ed): Proceedings from the International Policy Research Symposium "The changing role of forestry in Europe; between urbanisation and rural development", Wageningen, The Netherlands, 11-14 November 2001. - Urban Greening and Urban Forestry 1: 97-106.
Not found, not in the table
Termansen, M., McClean, C.J. and Scarpa, R. "Economic Valuation of Danish Forest Recreation Combining Mixed Logit Models and GIS", Paper presented at the Association of Environmental and Resource Economists Conference. Budapest, Hungary. , 2004
http://www.evri.ca/english/screener/
screener.cfm?process=next&fa4af=0.37970684
Not found, not in the table. (only summary in EVRI)
Termansen, M. 2005 Optimal spatial allocation of reafforestation areas. paper presented at the EAERE conference in Bremen June 2005. Not found, not in the table
Aakerlund, N.F. 2000: Contingent Ranking studie af danskernes præferencer for skovkarakteristika. SØM publikation nr. 36. AKF Forlaget.
Soon available at http://www.akf.dk/som/publ.htm, not in the table.
Ecosystem functions and biodiversity
Bjørner T., Hauch, J. & Jespersen, S. 2004. Biodiversitet, sundhed og usikkerhed - en værdisætningsundersøgelse ved contingent ranking metoden. Working paper from the secratariat of the Danish Economic Council (DØRS).
10. Primary study, in the table
Boiesen, J., Jacobsen, J.B., Thorsen, B.J., Strange, N. & Dubgaard, A. 2005. Værdisætning af de danske lyngheder. Arbejdsrapport, KVL, Frederiksberg.
Pimary study, in the table (Same study as Boiesen et al under “Landscape – Moorland)
Boiesen, J., Jacobsen, J.B., Thorsen, B.J., and Strange, N. Valuing biodiversity protection at habitat-level - flagship species vs. quantitative listings, working-paper, KVL.
Woking paper, not in the table
Lundhede, T., Hasler, B. & Bille, T. 2005 Værdisætning af naturgenopretning og bevarelse af fortidsminder i Store Åmose i Vestsjælland. Under udgivelse som rapport fra Skov og Naturstyrelsen, København.
Primary study, in the table
Olsen S., Ladenburg, J. & Dubgaard, A. (under udarbejdelse): CE og CVM undersøgelse af natureffekter som følge af motorvejsanlæg. Fødevareøkonomisk institut, KVL.
Forthcoming, Not found, not in the table.
Meilby, H., Strange, N., Thorsen B. J. and Helles, F. 2005: A hedonic analysis of the price of hunting rentals, Forthcoming in Scandinavian Journal of Forest Research
National parks:
Forthcoming reports on national parks.
Contact persons: Bo Jellesmark Thorsen og Jette Bredahl, Skov og landskab, KVL.
Pesticide use:
Bjørner T., Hauch, J. & Jespersen, S. 2004 Biodiversitet, sundhed og usikkerhed - en værdisætningsundersøgelse ved contingent ranking metoden. Working paper from the secratariat of the Danish Economic Council (DØRS).
Primary study, in the table
Schou, J.S., Hasler, B. & Nahrsted, B. 2005: Valuation of biodiversity effects from reduced pesticide use. - Integrated Environmental Assessment and Management (submitted): 23-08-2005.
Based on the primary study by Schou et al 2005 below.
Schou, J.S., Hald, A.B., Kaltoft, P., Andreasen, C., Vetter, H. & Hasler, B. 2003: Værdisætning af pesticidanvendelsens natur- og miljøeffekter. Miljøstyrelsen. - Bekæmpelsesmiddelforskning fra Miljøstyrelsen 72: 64 s.
Findes på: http://www.mst.dk/udgiv/publikationer/2003/
87-7972-904-5/pdf/87-7972-905-3.pdf
Demonstration case. Not to be used, not in the table.
Schou, J.S., T. Lundhede og Neye S. : Værdisætning af effekterne af ukrudtsbehandling i æbleplantager. (Arbejdstitel, under udarbejdelse)
Forthcoming, not in table
Other:
Hansen; Vibeke og Charlotte Juel Petersen 2003: Værdien af gener forbundet med at bo i nærheden af en svinebedrift- værdisætning ved hjælp af husprismetoden. April 2003, AKF Forlaget
Soil quality
Szilas, C., A. Zeuthen Jeppesen & L. Kaalund 2005: Værditab ved salg av forurenede eller tidligere forurenede ejendomme med heårsbeboelse. Hovedrapport. Miljøprosjekt nr. 1046. Rapport til Miljøstyrelsen og Amternes Videncenter for Jordforurening.
Primary study, in the table
Marine and coastal areas
Ladenburg, J, A. Dubgaard, L. Martinsen og J. Tranberg 2005: Economic Valuation of the Visual Externalies of Off-shore Wind farms. Food and Resource Economics Institute, The Royal Veterinary and Agricultural University, Copenhagen.
Primary study, in the table
Benefit transfer in general:
None of the Benefit transfer studies are in the table.
Andersen, M.S. & Strange, N. 2003: Miljøøkonomiske beregningspriser. Forprojekt. Danmarks Miljøundersøgelser. - Faglig rapport fra DMU 459: 90 s. (elektronisk). Findes på: http://www.dmu.dk/1_viden/2_Publikationer/
3_fagrapporter/rapporter/FR459.PDF
Birr-Pedersen, K.: Amenity values from afforestation projects in Denmark – Comparing benefits across sites. 6th International Conference of the European Society for Ecological Economics (ESEE), Lisbon, Portugal, 14-17 June 2005.
Available at: http://www.esee2005.org/papers/124_1105729129148.pdf
Damgaard, C., Erichsen, E. & Huusom, H. 2001 Samfundsøkonomisk projektvurdering af skovrejsning ved Vollerup. Skov og Naturstyrelsen.
Dubgaard, A., Kallesøe, M. F., Petersen, M. L., Damgaard, C. K., Erichsen, E. 2002a Velfærd og økonomi i relation til biologisk mangfoldighed og naturbeskyttelse. Den Kongelige Veterinær- og Landbohøjskole.
Dubgaard, A., Kallesøe, M. F., Petersen, M. L. and Ladenburg, J. 2002b Cost-benefit analyse af Skjern-Å-Projektet. Samfundsvidenskabelig serie 9. Institut for Økonomi, Skov og Landskab. Den Kongelige Veterinær- og Landbohøjskole
Hasler, B. & Pedersen, C.J. 2003: Muligheder for generalisering og overførsel af resultater med benefit transfer. Bilag E. I: Schou, J.S., Hald, A.B., Kaltoft, P., Pedersen, N.K., Andreasen, C., Vetter, H., Hasler, B. & Petersen, C.J.: Værdisætning af pesticidanvendelsens natur- ogmiljøeffekter. Bilagsrapport. Miljøstyrelsen. - Arbejdsrapport fra Miljøstyrelsen 39: 145-178.
Zandersen, Marianne 2005 Benefit transfer over time of ecosystem values. The case of forest recreation in Denmark. Working Paper FNU 80 (August 2005). Also presented at the EAERE conference in Bremen June 2005.
http://www.webmeets.com/files/papers/EAERE/2005
/299/Benefit%20Transfer%20over%20time.pdf
Appendix C: Review of databases for environmental valuation studies
Environmental Valuation Reference Inventory (EVRI)
EVRI (www.evri.ca) is currently the most comprehensive database of valuation studies in terms of the number of valuation studies worldwide. EVRI was originally constructed by Ennvironment Canada, in co-operation with the US Protection Agency (EPA). Navrud and Vågnes (2000) evaluated the suitability of EVRI for European conditions. We concluded that overall the database worked well, but could learn from the Australian database ENVALUE to improve its search categories, and include more European valuation studies. At that time 56 studies or about 8 % of the 700 studies in EVRI were from Europe, while EVRI currently contains 1608 studies, out of which 370 (23 %) are from Europe. The two European EVRI Club members[20] dominate the European input with 217 and 57 studies for UK and France, respectively. Sweden weighs in at third place with 45 studies[21]. Thus, while EVRI contained about 9 % of the estimated 650 European valuation studies in 2000 (Navrud and Vågnes 2000), it now probably contains roughly 1/3 of the existing valuation studies in Europe (but much less of the total stock of valuation studies worldwide, which could easily exceed 5000 studies). EVRI currently contains 10 Danish studies, see appendix 2 for a list of these. Figure 1 shows that EVRI contains many studies that are very relevant to the priority environmental goods of this project.
Figure 1. Number of studies on different categories of environmental goods in EVRI (according to the classification used in EVRI)
ENVALUE
ENVALUE (www.epa.nsw.gov.au/envalue/) is the principal database for environmental valuation studies (and hence benefit transfer) in Australia. Hosted by the New South Wales (NSW) Government, it contains over 400 studies, one third of which are Australian, covering nine different environmental goods.
The aim of ENVALUE is to enhance decision-making by encouraging improved valuation of environmental resources, and improve the credibility of those valuations. However, Envalue has been affected by software problems and limited resources, and has remained substantially unmodified since 2001. Despite this, ENVALUE appears to be widely used in Australia due to the number of Australian studies it contains (White, 2005).
Benefit transfer in Australia varies in its level of sophistication, although simple transfer of mean values is probably the most common benefit transfer technique used. However, an increasing number of more sophisticated primary studies are being undertaken with an eye to their results being available for use in benefit transfer at later dates. The NSW Department of Environment and Conservation (DEC) continues to use the data in ENVALUE but is increasingly relying on more recent Australian studies than those found in the database. The Department also searches the international literature to ensure that the most up-to-date valuations are available to it, and to locate studies relevant to specialised areas of DEC’s regulatory function that are not covered by the ENVALUE database. DEC is currently considering options for the future of the ENVALUE database (White, 2005).
Table 1 and 2 illustrate the distribution of studies geographically and on topics considered, respectively. Only 15 % of the studies are from Europe, including 3 % from Scandinavia, but none from Denmark. The environmental goods covered are, however, relevant for this report as natural areas, water and land quality studies makes up more than half of the studies.
Table 1: Source countries/regions for Envalue studies.
Source: White (2005)
| Country/region | Percent of studies |
| USA | 46 |
| Australia | 31 |
| United Kingdom | 9 |
| Scandinavia | 3 |
| Other Europe | 3 |
| New Zealand | 2 |
| Canada | 1 |
| Latin America | 1 |
| Asia/Pacific | 1 |
| Africa | 1 |
| Global/other | 2 |
| Total all countries/regions | 100 |
Table 2: Topics of studies in ENVALUE database.
Source: White (2005)
| Topic of valuation study | Percent of studies |
| Natural areas | 27 |
| Air quality | 24 |
| Water quality | 15 |
| Land quality | 11 |
| Noise | 8 |
| Urban amenity | 4 |
| Radiation | 1 |
| Non-urban amenity | 1 |
| Risk of fatality | 1 |
| Conceptual studies | 8 |
| Total all topics | 100 |
ValueBase SWE
The Valuation Study Database for Environmental Change in Sweden (ValueBaseSWE) www.beijer.kva.se/valuebase.htm) was developed by Sundberg and Söderquist (2004) within a project funded by Naturvårdsverket. The database is the result of a survey of empirical economic valuation studies on environmental change in Sweden. ValueBaseSWE is a Microsoft Excel workbook with two spreadsheets. The first sheet contains data and the second sheet contains a list of abbreviations used in the database.
Other databases and bibliographies of studies
The New Zealand Non Market Valuation Database (NZ NMVD) (http://learn.lincoln.ac.nz/markval/ ) is developed and managed by Lincoln University in Christchurch, NZ. It is an easily searchable database of all valuation studies and value transfers undertaken in New Zealand only (studies from other countries are excluded). The information about each study is, however, more limited than for e.g. EVRI and ENVALUE. NZ NMVD reports only year of study, type of object, a more detailed description of valued item, method, and mean value estimate (but contains a useful list of authors/valuation practitioners). Thus, it lacks information critical for benefit transfer, and it is e.g. not possible to evaluate the quality of the study by the information provided.
Review of Externality Data (RED) (www.red-externalities.net/) was developed and managed by the Italian research institute ISIS (Institute of Studies for the Integration of Systems) for the EC DG Research. It is primarily a literature database, listing studies useful for environmental costing (from a life cycle perspective) of energy and other sectors, but contains too little details of each study to be used directly for value transfer. Mainly value transfer exercises, but also some primary valuation studies are listed.
The Benefits Table (BeTa) database was created for European Commission DG Environment by Netcen (part of AEA Technology in the UK), to provide a simple ready tool for estimation of the external costs of air pollution. BeTa presents average default values for marginal external costs for different air pollutants in different geographical areas based on the damage function approach (see figure 1) tool developed with the ExternE project series (i.e. the Impact pathway appoach and the Ecosense software). Value transfer in BeTA is based on unit value transfer.
The version presented at http://europa.eu.int/comm/environment/enveco/air/betaec02aforprinting.pdf is a pdf extract providing the main details of the database and default estimates of externalities, but lacking the facility for manipulation of functions etc. that is present in the full version of the database. Since BeTa focuses entirely on health (and some environmental) impacts from air pollutants, it is not relevant for the environmental goods considered in this report.
The UK Department of Environment, Food and Rural Affairs also has a bibliography of valuation studies; see Environmental Valuation Source List for the UK http://www.defra.gov.uk/environment/economics/evslist/. It was published in 2000 and was last updated in September 2001. Thus, it does not contain UK valuation studies for the last four years.
The Natural Resource Conservation Service (NRCS) of the US Department of Agricultural provides databases and lists of recreational unit day estimates for different activities at
http://www.economics.nrcs.usda.gov/technical/recreate/. For these use value transfer they recommend the value transfer guide developed by Rosenberg and Loomis.
Carson (forthcoming) provides an updated bibliography of Contingent valuation studies worldwide.
For coastal and marine resources, NOAA (National Oceanographic and Atmospheric Administrations) provides four annotated bibliographies (mainly focusing on Florida) and three benefit transfer databases, based partly on these bibliographies; see http://marineeconomics.noaa.gov/bibsbt/welcome.html
Recreation Values Database, 1998 (Microsoft Excel, 928 kb), was created by Randall Rosenberger at the University of West Virginia under contract to the U.S. Forest Service. The primary focus was on recreational uses of forests; however, a wider group of studies is included (that are also relevant to valuing recreational uses of coastal and ocean resources). The database and documentation can be downloaded from this site. The file is a Microsoft Excel workbook with two spreadsheets. One spreadsheet contains data and the other contains documentation of the data fields.
For coastal and marine resources NOAA (National Oceanographic and Atmospheric Administrations) provides four annotated bibliographies (mainly focusing on Florida) and three benefit transfer databases, based partly on these bibliographies see http://marineeconomics.noaa.gov/bibsbt/welcome.html; which provides the following information about the three databases:
Florida Values Digest (pdf, 28 kb) is not a true database but instead a report with summary tables of the values estimated in the studies included in the annotated bibliography SOCECONFL. The table includes bibliographic reference information, year of study, estimation methodology, type of resource, type of user (resident or visitor), and estimate of value. For recreational activities, values have been normalized to values per person per day. For other applications, such as wetlands, values are given per acre.
The second benefits transfer database is the recreation value database mentioned above, which also contains values for coastal and marine recreational activities. The third database is the Coral Reef Valuation database (Microsoft Access, 756 kb). This database includes all studies with estimated values from the annotated Coral bibliography. The file is in Microsoft Access format.
Evaluation and comparison of databases
Recently, Lantz and Slaney (2005) performed an evaluation and comparison of the environmental valuation databases EVRI, Envalue, NZNMDB, ValueBaseSwe and RED. Appendix G shows the criteria used, and how the different databases scored for each criterion. A summary of the evaluation is provided in table 3 (where all criteria areassumed to have the same weight).
Table 3 Summary evaluation of the environmental valuation databases EVRI, Envalue, NZNMDB, ValueBaseSwe and RED. Source: Lantz and Slaney (2005)
| Criteria | Element | Database | ||||
| EVRI | ENVALUE | NZ NMDB | ValueBase Swe | RED | ||
| Ease of Use | Accessibility | *** | ***** | **** | **** | *** |
| Usability | **** | *** | *** | ** | *** | |
| Content | Benefit transfer | **** | *** | ** | *** | * |
| Benefit function transfer | **** | ** | * | *** | * | |
| Simple bibliography | ***** | ***** | ** | *** | *** | |
| Extensive Bibliography | ***** | *** | **** | *** | ** | |
| Overall | **** | **** | *** | *** | ** | |
Lantz and Slaney op. cit conclude their evaluation in this way:
The EVRI database was rated one of the two highest out of five databases reviewed. It contains a vast array of values, regions and evaluation methods that lend themselves to benefit and benefit function transfer. Its search functions allow easy retrieval of relevant studies and the content is up to date. It is comprehensive in content and is very user friendly due to its instructive tutorial.
The EVRI database requires a relatively large amount of information from users prior to access, and there is about a one-day wait for a user name and password. This might deter simple or extensive bibliography users due to the time required to access the database. Additionally the EVRI database requires a subscription fee for some users (non-EVRI club member countries). Researchers requiring brief access to the database might not subscribe due to a high access cost for limited use.
While the EVRI database shares the highest ranking among the five databases reviewed, improvements can be made. Automation of the subscription process would ensure quick access to the database. Additionally, the incorporation of more detailed validity test information would increase the applicability for this database to be used in benefit transfer.
The ENVALUE database was also rated one of the highest out of the five databases reviewed. It is fairly comprehensive in content with a straightforward and easy to use sort function. The conceptual studies section provides information on state of the art environmental valuation techniques while the annotated bibliography contains important characteristics identified for the majority of the use elements.
The ENVALUE database is relatively dated, as the newest entry found was for the year 2000. In addition, data fields are incomplete in some entries. This poses problems to researchers seeking complete and up to date studies. Additionally, this database does not include a typical search module. The addition of a key word search would allow users to search for relevant words that may not be included in the hierarchy based search.
The NZ NMDB was rated in the mid to low range of the five databases reviewed. The database comprises a comprehensive representation of environmental valuation studies in New Zealand. The search function is straightforward and easy to use. However, it lacks several critical aspects required for successful benefit transfer and benefit function transfer. Since this database is limited to studies conducted in New Zealand, its potential for benefit transfer is also limited. Additionally, the results page only includes a brief description of the study with limited information.
Expanding on the information contained in the results page would increase the applicability of this database for each use evaluated. This would require the addition of more detailed commodity, population, and location descriptions.
The ValueBaseSwe database was rated in the mid range of the five databases reviewed. This database comprises a comprehensive representation of environmental valuation studies in Sweden. It contains a wide array of values and includes information pertaining to validity tests and details of functions used in certain studies. The database download feature is advantageous due to its portability.
The ValueBaseSwe database, however, is limited by its spreadsheet design. The nature of a spreadsheet does not lend itself to substantial amounts of text within individual cell boxes. Searching this database is limited to built-in search tools found in spreadsheet software. Being limited to studies conducted in Sweden this database has limitations in benefit transfer applications.
Transferring this database from spreadsheet to searchable database format would allow for more efficient querying of studies in addition to the possibility for additional information not suitable to spreadsheet format (figures etc.).
The RED database was rated in last out of the five databases reviewed. This database contains a wide array of studies and values reported internationally. The guided search function contains detailed lists by which the user can query studies.
The RED database, however, is difficult to navigate and requires a great deal of time to grasp the guided search concept. The terminology within the guided search module is vague and confusing. This database does not take advantage of leading edge website design technology.
A glossary or more informative guided search module is needed to make this database more user-friendly. Descriptions of the environmental value in question are vague and need better explanation. Technical issues relating to internal errors need to be addressed as these were frequent and not results of the evaluator’s computer configuration as multiple computers were used with up to date web browsers.
In my view Lantz and Slaney op. cit. provide a fair evaluation of these databases, but a few additional comments are needed.
First, the RED database is now being improved and more studies included as part of the EC research project MethodEx (www.methodex.org ). However, the main focus of this database is being an annotated bibliography of studies valuing externalities, both in original studies and in value transfer exercises, rather than providing unit values for different types of environmental goods. Thus, the database is aimed at providing literature as basis for environmental costing, rather than values from primary valuation studies to be used in value transfer exercises for all policy purposes.
Secondly, the evaluation is based on the suitability of these databases for international benefit transfer. However, since transfer errors are generally expected to be lower for transfers within a country than between countries, a good strategy would be to first try to utilize the national environmental valuation literature. Therefore, NZ NMBD and ValueBaseSwe, containing national studies only for New Zealand and Sweden, respectively would have fared better in the evaluation if this had been recognized as the goal of the databases, as they are much more comprehensive and detailed with regards to their goal, as opposed to EVRI and ENVALUE that seem to aim for an international collection of valuation studies (although ENVALUE was originally developed as a national database for Australian studies, but studies from other countries were added when they recognized the limited number of national studies for environmental and health impacts important to Australia).
Thirdly, the member countries of the EVRI club (Canada, USA, UK, and France) have made a large effort to include most of their national valuation studies in EVRI. Thus, the EVRI club countries also use EVRI as their “national” valuation database. E.g. France as a recent member of the EVRI club has included most of their limited number of valuation studies to increase benefit transfer within France, where there has been great scepticism towards transferring value estimates from Anglo-Saxon countries due to the negative results from a validity test of a value transfer of health impacts (Rozan 2005). DG Environment of the European Commission has also funded inclusion of studies in EVRI, as they see the database as a very useful tool for benefit transfer in the cost-benefit analyses they perform of new directives.
While ENVALUE now contains many studies from countries outside the Australia, NZ NMDB still contains valuation studies for New Zealand only. However, while ENVALUE was last updated in 2002, NZ NMDB is continuously updated to contain all national valuation studies. Thus, if the focus of the comparison of the databases (see appendix 1) had been comprehensiveness at the national level, NZ NMDB would have fared better.
Potential use of the databases for Denmark
EVRI seems to be the most useful database for Denmark due to its coverage both with regards to environmental gods and geographically, but it should be populated with more Danish studies. Denmark should aim for the development of a Nordic database of valuation studies (which the Nordic Council of Ministers has submitted a call for), which should also be included in EVRI. All Nordic countries should join the EVRI Club in order to secure access and use of the database. Meanwhile, ValueBaseSwe, the UK list of valuation studies and similar lists in other Nordic and European countries should be used to identify valuation studies that can be used for value transfer exercises.
Appendix D: Summary of evaluation of selected environmental valuation databases.
Appendix E: List of Danish valuation studies in EVRI
| 0580-171859 Bjorner, T.B., "Combining Socio-acoustic and Contingent Valuation Surveys to Value Noise Reduction", Transportation Research Part D 9, 341-356 , 2004 |
| 0593-1254 Bjorner, T.B., "Comparing the Value of Quiet from Contingent Valuation and Hedonic Pricing Methods", AFK, Institute of Local Government Studies - Denmark , 2003 |
| 0154-16469 Bjorner, T.B. and C.S. Russell, A. Dubgaard, C. Damgaard and L.M. Anderson., "Public and Private Preference for Environmental Quality in Denmark.", SOM publikation nr. 39, AKF Forlaget, 2000 , 2000 |
| 02232-16139 Dubgaard, A., "Economic Valuation of Recreational Benefits from Danish Forests", The Economics of Landscape and Wildlife Conservation. Dabbert, S., A. Dubgaard, L. Slangen, M. Whitby. Oxon, UK, CAB International. , 1998 |
| 0028-95120 Jordal-Jørgensen, J., "Samfundsmæssig værdi af vindkraft. Delrapport: Visuelle effekter og støj fra vindmøller - kvantificering og værdisætning." (Social Costs of Wind Power: Partial Report of Visual Impacts and Noise from Windmills)., Institute for Local Government Studies (AKF), Copenhagen, Denmark 1995 , 1995 |
| 0081-153429 Kidholm, K., "Assessing the Value of Traffic Safety Using the Contingent Valuation Technique: The Danish Survey", Paper presented at Conference on Valuing the Consequences of Road Accidents, Neuchatel, Switzerland, 1994 , 1994 |
| 05180-15846 Termansen, M., C.J. McClean, and R. Scarpa., "Economic Valuation of Danish Forest Recreation Combining Mixed Logit Models and GIS", Paper presented at the Association of Environmental and Resource Economists Conference. Budapest, Hungary. , 2004 |
| 05165-04546 Toivonen, A.L., E. Roth, S. Navrud, G. Gudbergsson, H. Appelblad, B.Bengtsson, and P.Tuunainen., "The Economic Value of Recreational Fisheries in Nordic Countries", Fisheries Management and Ecology 11, pp. 1-14. , 2004 |
| 04274-192024 Turner, R.K., S. Georgiou, I-M. Gren, F. Wulff, S. Barrett, T. Soderqvist, I.J. Bateman, C. Folke, S. Langaas, T. Zylicz, K-G. Maler, and A. Markowska, "Managing Nutrient Fluxes and Pollution in the Baltic: An Interdisciplinary Simulation Study", Ecological Economics 30: 333-352 , 1999 |
| 05295-155050 Zandersen, M., M. Termansen and F. S. Jensen, "Benefit Transfer Over Time of Ecosystem Values: The Case of Forest Recreation", Working Paper no. FNU-61, Danish Centre For Forest, Landscape and Planning , 2005 |
Appendix F: Table of Swedish Studies from ValueBaseSWE
This appendix presents, in a table format, studies from The Valuation Study Database for Environmental Change in Sweden (ValueBaseSWE) relevant for Miljøstyrelsen in Denmark. Studies assumed not to be relevant for Danish conditions because they included valuation of e.g. wolf, recreational value of skiing and so on were excluded. Based on a screening using the title of the studies, 38 out of 170 were found to fall within the Miljøstyrelsen priorities for this project; surface water quality, groundwater quality, marine and coastal areas, soil quality, landscape aesthetics, ecosystem functions and biodiversity. Studies without specification of the valuation method and studies not being original studies were also excluded, resulting in 20 relevant to Miljøstyrelsen. To limit the scope to the most recent studies, studies with data collection earlier than 1995 were also excluded, resulting in the 12 studies referred to in than tables below. The complete ValueBaseSWE database can be found at: http://www.beijer.kva.se/valuebase.htm
In ValueBaseSWE there is no explicit information on whether the WTP is per household, per individual, per year or as a one-time amount, but in most cases the payment vehicle gives information on this.
Swedish SKK values are converted to Danish 2005-DKK by using a Purchase Power Parity (PPP) corrected exchange rate at the year of data collection (see http://www.oecd.org/dataoecd/61/56/1876133.xls ), and then adjusting with the Danish Consumer Price Index. (see Appendix H) from the year of data collection to 2005.
Water
| Reference/ authors |
Year of data collection/ Environmental goods/services | Valuation method and relevant information | WTP (SEK in year of data collection) | WTP in 2005-DKK |
Sample size |
| Appelblad, Håkan. The Spawning Salmon as a Resource by Recreational Use. The case of the wild Baltic salmon and conditions for angling in north Swedish rivers. GERUM 2001:3, Department of Social and Economic Geography, Umeå University 2001. |
Data collection 1997 Recreational fishing (salmon angling) |
CV Payment vehicle: Fishing licence Elicitation format CV: PC and OE Interview method: Mail questionnaire Population: Swedish anglers who had been fishing in the River Byske in 1996. Sample: Registered fishing licence buyers. |
Current condition: 89 per day 326 per week 757 per year. Improvement: 142 per day 522 per week 1231 per year. |
Current condition: 94 per day 346 per week 804 per year. Improvement: 151 per day 554 per week 1307 per year |
n=192 Response rate=71% |
| Reference/ authors |
Year of data collection/ Environmental goods/services | Valuation method and relevant information | WTP (SEK in year of data collection) | WTP in 2005-DKK |
Sample size |
| Frykblom, Peter. Halved Emissions of Nutrients, What are the Benefits? - A Contingent Valuation Survey Applied to Laholm Bay. in Questions in the Contingent Valuation Method - Five Essays, doctoral thesis, Agraria 100, Department of Economics, Swedish University of Agricultural Sciences (SLU), Uppsala. 1998. |
Data collection 1996 Water quality |
CV Payment vehicle: A monthly tax on top of the community income tax Elicitation format CV: DC Interview method: Mail questionnaire Population: Residents of Båstad, Halmstad and Laholm in the age between 18-75 Sample: Random sample |
Mean annual WTP: 747 Median annual WTP: 244 |
Mean annual WTP: 816 Median annual WTP: 266 |
n=500 Response rate=67.4 |
| Reference/ authors |
Year of data collection/ Environmental goods/services | Valuation method and relevant information | WTP (SEK in year of data collection) | WTP in 2005-DKK |
Sample size |
| Latitila, T and Paulrud, A. Combining Conjoint Analysis and Choice Experiments for Valuation of Fishing Site Characteristics. Arbetsrapport 329, Department of Forest Economics, Swedish University of Agricultural Sciences (SLU), Umeå. 1998 |
Datacollection 1998 Angling site |
CE and CV Payment vehicle: Licence fee Elicitation format CV: conjoint analysis and DC for the CV Interview method: Mail questionnaire Population: Anglers Sample: Random sample from register of buyers of fishing licenses |
Mean WTP in CVM: 46.61 | Mean WTP in CVM: 46.8 |
n=200 Responserate=67% |
| Reference/ authors |
Year of data collection/ Environmental goods/services | Valuation method and relevant information | WTP (SEK in year of data collection) | WTP in 2005-DKK |
Sample size |
| Paulrud, Anton. Ekonomisk analys av sportfiskarnas val av fiskeplats – en pilotstudie gällande för öring- och harrfiske i rinnande vatten. Arbetsrapport 290, Department of Forest Economics, Swedish University of Agricultural Sciences (SLU), Umeå. 2000. |
Data collection 1998 Attributes of fishing sites: type of water, species, accessibility, restrictions of catch, expected catch, distance from residence, number of anglers at the site and license fee |
SP Payment vehicle: Licence fee Elicitation format CV: Interview method: Mail questionnaire Population: Swedish anglers that have visited the study area in 1998 Sample: Choice-based |
Marginal WTP for an extra fish caught: 16. An increase of the distance from the fishing site to the closest road increased the Marginal WTP with SEK 0.13 per meter. If the distance between the respondent’s residence and the fishing site increased with 10 km the corresponding decrease in WTP was approximately SEK 8. |
Marginal WTP for an extra fish caught: 16.5 An increase of the distance from the fishing site to the closest road increased the Marginal WTP with 0.13 per meter. If the distance between the respondent’s residence and the fishing site increased with 10 km the corresponding decrease in WTP was approximately 8.2 |
N=200 Response rate=67% |
| Reference/ authors |
Year of data collection/ Environmental goods/services | Valuation method and relevant information | WTP (SEK in year of data collection) | WTP in 2005-DKK |
Sample size |
| Söderqvist, Tore. Contingent Valuation of a Less Eutrophicated Baltic Sea. Beijer Discussion Paper Series No. 88, The Beijer International Institute of Ecological Economics, The Royal Swedish Academy of Sciences, Stockholm Eutrophication of the Baltic Sea. 1996. |
Data collection 1995 Eutrophication of the Baltic Sea |
CV Payment vehicle: An extra environmental tax paid for 20 years Elicitation format CV: DC, OE Interview method: Mail questionnaire Population: Swedes aged between 18 and 85 years Sample: Random sample |
Mean annual WTP: for non-protesters kSEK 7 per person. For non-protesters and weak protesters kSEK 6.5 per person. Total national WTP: MSEK 21816 |
Mean annual WTP: for non-protesters kDKK 7.7 per person. For non-protesters and weak protesters kDKK 7.2 per person. Total national WTP: MDKK 24 139 |
n= 696 Response rate= 60.4% |
Landscape aesthetic
| Reference/ authors |
Year of data collection/ Environmental goods/services | Valuation method and relevant information | WTP (SEK in year of data collection) | WTP in 2005-DKK |
Sample size |
| Ek, Kristina. Valuing the Environmental Impacts of Wind Power – A Choice Experiment Approach. 2002:40, Luleå University of Technology. 2002. |
Data collection 2002 Environmental attributes associated with wind power generation: noise, location, height, group and price |
CE Payment vehicle: Electricity price öre/kWh Interview method: Mail questionnaire, 6 sets * 2 alternatives * 5 attributes Population: Swedish house owners Sample: Random sample from the Swedish Official Register of Persons and Addresses (SPAR) |
Mean WTP/WTA expressed in öre/kWh. Noise 1.67 Mountain -2.18 Offshore 3.47 Height 0.26 Small 1.55 Large-1.64 |
Mean WTP/WTA expressed in öre/kWh. Noise 1.55 Mountain -2.03 Offshore 3.22 Height 0.24 Small 1.44 Large-1.52 |
n=1 000 Response rate=56 % |
| Reference/ authors |
Year of data collection/ Environmental goods/services | Valuation method and relevant information | WTP (SEK in year of data collection) | WTP in 2005-DKK |
Sample size |
| Hörnsten, L and Fredman, P. On the distance to recreational forests in Sweden. Landscape and Urban Planning, 51, 1-10. 2000 |
Data collection 1998 Distance to recreational forests |
CV Payment vehicle: Amount added to the monthly cost of housing Elicitation format CV: OE Interview method: Mail questionnaire Population: Swedish citizens Sample: Random sample |
Monthly mean WTP: 110 Median WTP: 50 including zero bids. Monthly mean WTP: 185 median WTP: 100 excluding zero bids. |
Monthly mean WTP: 113 Median WTP: 51 including zero bids. Monthly mean WTP: 190 median WTP: 103 excluding zero bids. |
n= 500 Response rate = 48% |
Ecosystem function and biodiversity
| Reference/ authors |
Year of data collection/ Environmental goods/services | Valuation method and relevant information | WTP (SEK in year of data collection) | WTP in 2005-DKK |
Sample size |
| Carlsson, F., Frykblom, P. and Liljenstolpe, C. Valuing wetland attributes – an application of Choice Experiments Working Paper Series 2001:3, Department of Economics, Swedish University of Agricultural Sciences (SLU), Uppsala. 2001. |
Data collection 2001 Wetland attributes: total cost, surrounding vegetation, biodiversity, fish, fenced waterline, crayfish and walking facilities. |
CE Payment vehicle: ? Interview method: Mail questionnaire Population: The population of Staffanstorp in the age between 18-75 years Sample: Random sample from the Swedish census register. |
Logit model: high biodiversity 673.22 medium biodiversity 504.58 fish 348.48 fenced waterline -167.53 crayfish -113.48 walking facilities 648.06 |
Logit model: high biodiversity 639.48 medium biodiversity 477.17 fish 329.55 fenced waterline -158.43 crayfish -107.31 walking facilities 612.85 |
n=1 200 Response rate=39 % |
| Reference/ authors |
Year of data collection / Environmental goods/services |
Valuation method and relevant information | WTP (SEK in year of data collection) | WTP in 2005-DKK |
Sample size |
| Dalin, Per-Eric. Småviltsjakten på statens mark ovan odlingsgränsen - en samhällsekonomisk analys. Arbetsrapport 296, Department of Forest, Swedish University of Agricultural Sciences (SLU), Umeå. 2000 |
Data collection 2000 Small game hunting on public owned land in the mountains of Villhelmina community |
TCM Interview method: Mail questionnaire, zonal method Population: hunters using daily permits and individuals joining the hunters in the study area in 1999 Sample: Random sample |
Total CS: 186 325 CS per day: 82 |
Total CS: 184 535 CS per day: 81.2 |
n=285 Response rate=85 % |
| Reference/ authors |
Year of data/ collection | Valuation method and relevant information | WTP (SEK in year of data collection) | WTP in 2005-DKK |
Sample size |
| Grudemo, Stefan. E6 genom Ljungskile – ett omstritt motorvägsbygge. Beskrivning av beslutsprocessen och invånarnas inställning och värdering av effekterna på närmiljön. VTI meddelande nr 843, The Swedish National Road and Transport Research Institute (VTI), Linköping. 1999. |
Data collection 1997 and 1998 Environmental effects of a motorway |
CV Payment vehicle: increase in community tax for 10 years Elicitation format CV: OE and DC Interview method: Mail questionnaire Population: Residents of Ljungskile, including the area Lyckorna Sample: Random sample |
Annual mean WTP: DC-question 235 OE-question 65 |
Annual mean WTP: DC-question 180 OE-question 50 |
n= 600 Response rate = 74% |
| Reference/ authors |
Year of data collection/ Environmental goods/services | Valuation method and relevant information | WTP (SEK in year of data collection) | WTP in 2005-DKK |
Sample size |
| Israelsson, Torun. Valuing Natural Heritage – An Empirical Application of a Choice Experiment. in “Infrastructure Investments and Environmental Preservation – An economic foundation for public decisions”. Report 122, Department of Forest Economics, Swedish University of Agricultural Sciences (SLU), Umeå 2001. |
Data collection 2000 Encroachment of a road in a Natural Heritage area described by the attributes: biology, landscape, recreation, noise, safety, tax and time. |
CE Payment vehicle: Non-recurrent tax Elicitation format CE: 3 sets * 3 alternatives * 7 attributes Interview method: Mail questionnaire Population: Residents in three Swedish regions: Västerbotten, Södermanland and Västmanland, Skåne Sample: Random sample from a telephone directory |
Mean WTP as a once-for all payment: 312 for biology 124 for recreation 180 for landscape 76 for safety 0.09 for time 28 for noise. |
Mean WTP as a once-for all payment: 309 for biology 123 for recreation 178 for landscape 75 for safety 0.09 for time 28 for noise. |
n= 329 Response rate= 34.3% |
| Reference/ authors |
Year of data collection/ Environmental goods/services | Valuation method and relevant information | WTP (SEK in year of data collection) | WTP in 2005-DKK |
Sample size |
| Nilsson, M. and Gullberg, M. Externalities of Energy: Swedish Implementation of ExternE Methodology: The contingent valuation study on Klippen. Stockholm Environment Institute (SEI). External cost of Klippen hydro power station. 1998. |
Data collection 1995 External cost of Klippen hydro power station |
CV Payment vehicle: Annual contribution to a fund Elicitation format CV: DC Interview method: Mail questionnaire/personal interviews Population: Local population, Swedish population in general and tourists Sample: Random sample of locals and Swedes |
Swedes: 700 Locals: 1900 Tourists: 2000 |
Swedes: 775 Locals: 2102 Tourists: 2213 |
locals: n=600 Swedes: n=600, Tourists: n=235 Responsrate Locals =50%, Swedes:= 54% |
Appendix G: Summary of value transfer validity tests for priority environmental goods
| Reference | Resource/Activity | Unit value Transfer Percent Error[22] |
Function Transfer Error | |
| Loomis (1992) | Recreation | 4 – 39 | 1 – 18 | |
| Parson and Kealy (1994) | Water / Recreation | 4 – 34 | 1 – 75 | |
| Loomis et al. (1995) | Nonlinear Least Squares Model | Recreation | --- | 1 – 475 |
| Heckman model | --- | 1 – 113 | ||
| Bergland et al. (1995) | Water quality | 25 – 45 | 18 – 41 | |
| Downing and Ozuna (1996) | Fishing | 0 – 577 | --- | |
| Kirchhoff et al. (1997) | White water rafting | 36 – 56 | 87 – 210 | |
| Bird watching | 35 – 69 | 2 – 35 | ||
| Kirchhoff (1998) | Benefit Function Transfer | Recreation/Habitat | --- | 2 – 475 |
| Meta-analysis Transfer | --- | 3 – 7028 | ||
| Brouwer and Spaninks (1999) | Biodiversity | 27 – 36 | 22 – 40 | |
| Morrison and Bennett (2000) | Wetlands | 4 – 191 | --- | |
| Rosenberger and Loomis (2000a) | Recreation | --- | 0 – 319 | |
| VandenBerg et al. (2001) | Individual Sites | Water quality | 1 – 239 | 0 – 298 |
| Pooled Data | 0 – 105 | 1 – 56 | ||
| Shrestha and Loomis (2001) | International Recreation | --- | 1 – 81 |
Source: Modified after Brouwer (2000) and Rosenberger (2005).
Appendix H: Consumer Price Index (CPI) for Denmark, Norway and Sweden
Consumer Price Index (CPI) for Denmark, Norway and Sweden 1990-2004 (with 1990 = 100)
| Year | Denmark | Norway | Sweden |
| 1990 | 100,0 | 100,0 | 100,0 |
| 1991 | 102,4 | 103,5 | 109,3 |
| 1992 | 104,6 | 105,9 | 111,8 |
| 1993 | 105,9 | 108,2 | 117,0 |
| 1994 | 108,0 | 109,8 | 119,6 |
| 1995 | 110,2 | 112,5 | 122,6 |
| 1996 | 112,6 | 113,9 | 123,2 |
| 1997 | 115,0 | 116,8 | 123,8 |
| 1998 | 117,1 | 119,5 | 123,7 |
| 1999 | 120,1 | 122,2 | 124,2 |
| 2000 | 123,6 | 126,0 | 125,5 |
| 2001 | 126,5 | 129,9 | 128,5 |
| 2002 | 129,5 | 131,5 | 131,3 |
| 2003 | 132,3 | 134,8 | 133,8 |
| 2004 | 133,8 | 135,4 | 134,4 |
Example:
To convert Danish WTP data at the study site collected in 1999 into 2005 –DKK (i.e. January 2005), add the inflation rate for this period which can be calculatad from the equation below:
Inflation rate = CPI (2004) - CPI (1999) = 133.8 – 120.1 = 11.4 %
![]()
Appendix I: Surface Water Quality
Eutrophication Classification System for Norway
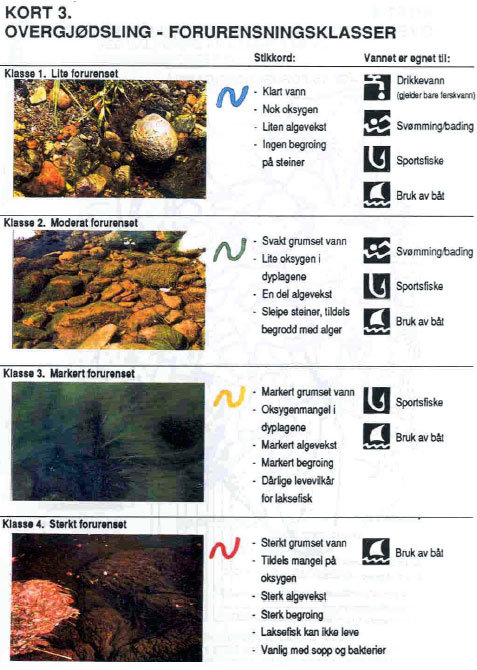
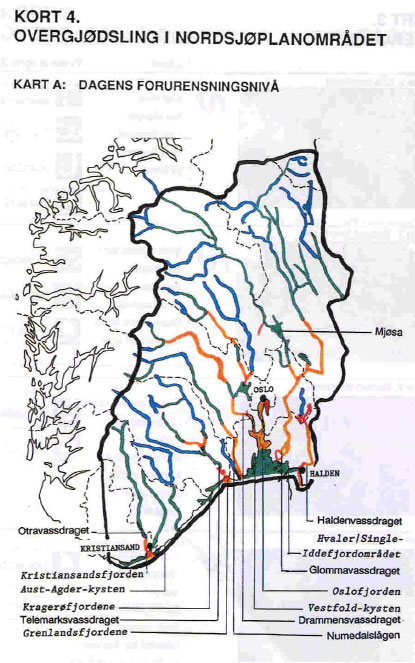
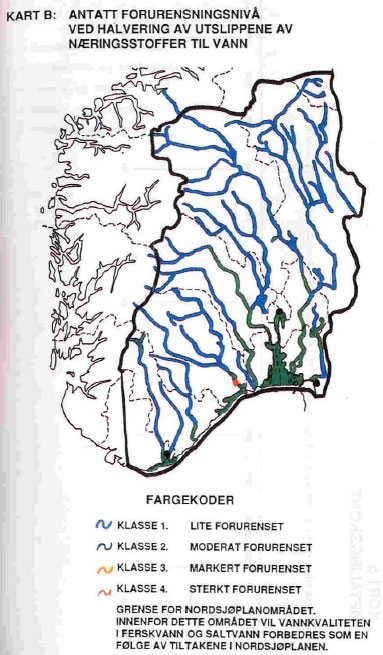
Footnotes
[1] Non-use value captures option value, existence and bequest value
[2] Consumer surplus (CS) is the difference between individuals´ maximum WTP (as outlined by the demand curve) and what they actually pay (market price). In the TC model this is the difference between the estimated demand for transportation to the recreational site (typically the number of visits per individual per year as a function of travel costs per visit (round trip; and usually assuming everybody arriving by car)) and all other variables thought to influence the frequency of visits.
[3] The challenge is to make value transfer spatially explicit by disaggregating complex landscapes into constituent land cover units and ecosystem service types that can be effectively transferred from one site to another. Although EcoVaue makes an attempt to do this, the list of valuation studies (on their website http://ecovalue.uvm.edu.) that they use for their analyses is very limited and seems to lack many high quality primary valuation studies relevant for transfer.
[4] However, this does not seem to be a relevant impact in most European countries.
[5] In t-tests, the usual level of acceptable transfer error is set at 5%, while in equivalency tests the researcher is free to set the level of acceptable transfer error, dependent on the decision situation and policy use. However, the tests themselves do not provide evidence for what the acceptable transfer error should be. This has to be analyzed in a decision theoretic framework in each case (see the Guidelines in Chapter 4).
[6] E.g. Kristofersson and Navrud (2002) found smaller transfer errors for non-use than for use values of freshwater fish stocks in Norway, Sweden and Iceland mainly due to different markets/institutions for recreational fishing between Iceland on one hand and Norway and Sweden on the other.
[7] Most value transfer validity tests have been performed on CV data (see appendix G), and this is one of the very few such tests of CE data.
[8] "The article is available at http://pubs.acs.org/journals/esthag/34/i08/pdf/es990728j.pdf. See also the site http://weatherhead.case.edu/econ/publicPolicy/contingent.cfm for further guidance."
[9] A distinction should be made between prevention (which preserves the original/undisturbed environmental good) and restoration. Hasler et al. 2002 (see appendix A) find that people put a higher value on keeping the original (i.e. prevention) than restoration (i.e. in this case purification of polluted ground water).
[10] See Chapter 2.2.
[11] This general classification of biodiversity stems from a CE of restoring Åmose marshland (Lundhede et al. 2005). CE and CR often use very general descriptions of the environmental good. These results could provide some general values for this aspect of the good in question, and could be used in transfers to similar type of ecosystems in need of an estimate for a similar qualitative increase in biodiversity (preferably from the same reference level). However, these values should not be used to characterize or value biodiversity of other types of ecosystems nor a similar type ecosystem where we need to value a very detailed and quantitatively specified change in biodiversity.
[12] Roughly said to be a higher adjusted R² than 0.5, i.e. explaining more than 50 % of the variation in value.
[13] An activity day is defined as one individual performing recreation for a shorter or longer period during one day.
[14] Some studies of use and non-use values have asked for individual WTP (e.g. Lundhede et al. 2005 for biodiversity of a marsh area). However, we view the household as the smallest “economic” unit for none-use values of these priority environmental goods. Multiplying individual WTP with the mean number of adults per household would tend to overestimate household WTP. Therefore, we have conservatively assumed that the reported individual WTP is equivalent to household WTP.
[15] Roughly said to be having a higher adjusted R² than 0.5, i.e. explaining more than 50 % of the variation in value
[16] This does, however, not mean that we should concentrate on RP studies when we perform new primary studies, as only SP methods are capable of valuing non-use values and future changes in environmental quality.
[17] In Hansen (2005) the respondents were asked to value the availability of a a new (restored) wetland/river (in terms of higher biodiversity, improved quality of landscape and free accessibility) close to their home or summerhouse, while Toivonen et al. (2000) asked respondents to value two different rivers (one with trout and salmon, and one with whitefish species) near their home becoming available for recreational fishing.
[18] Increased producer surplus (net income) to the private owners of the hunting and fishing rights (as described by Dubgaard et al. 2003) should be added to the increased consumer surplus described in this report. When transferring consumer surplus estimates from a study site, one should be clear on whether an access fee had been paid when the fishermen stated their WTP or not. If there is a zero access fee there will be a higher CS, and thus no producer surplus (since the landowners have no income). If there is an access fee, the net producer surplus should be added to the CS to get net social surplus of the recreational activity.
[19] Note, however, that in Dubgaard et al. (2003) it is not this area-based conversion of WTP that results in low aggregated benefits, but rather the fact that WTP per household is very low due to transfer from a CV survey where respondents anchor their WTP on the reported very low costs of restoration per household when divided on the national population.
[20] Members of the EVRI Club provide financial support for the development and maintenance of EVRI. In return they get free access to EVRI for all their citizens. The EVRI club currently includes Canada, USA, UK and France, and negotiations with new member countries, most notably Spanish speaking countries, are planned.
[21] Note that these numbers also contain value transfer studies where these countries are included. Thus, the number of primary national valuation studies is somewhat smaller. In a similar search Denmark comes up with 18 studies, but a closer look reveals only 10 primary valuation studies.
[22] All percent errors are reported as absolute values
Version 1.0 December 2007, © Danish Environmental Protection Agency