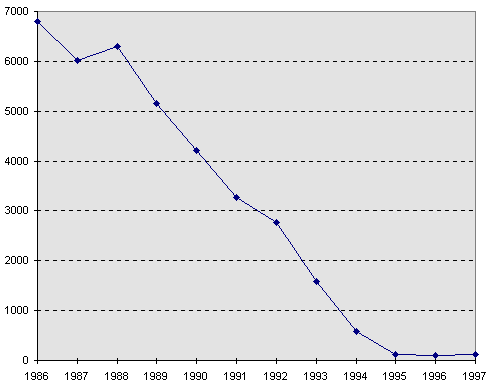
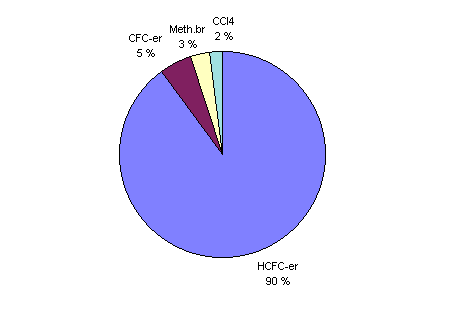
English SummaryIn this section, summarising estimations are given of Danish consumption figures of ozone depleting substances and consumption figures and emission data of industrial greenhouse gases for 1997. The comprised substances of this inventory are the ozone depleting substances: CFCs, tetrachloromethane, 1,1,1-trichloroethane, halons, methyl bromide, HCFCs, and the "pure" greenhouse gases: HFCs, sulphur hexafluoride, dichloromethane, trichloromethane and perfluorinated hydrocarbons. Ozone depleting substances An overview of consumption and ODP-weighted consumption of ozone depleting substances for 1997 are given in table 7.1. The ODP-weighted consumption has been 111 ODP-tons, which is at the same level as in 1995 and 1996. The development of the ODP-weighted consumption of ozone depleting substances from 1986 to 1997 is shown in figure 7.1 and distribution of ODP-weighted consumption on substances is illustrated in figure 7.2. The development of the consumption of the single substances or group of substances of ozone depleting substances is shown in table 7.2. The HCFCs comprise 90% and CFCs 5% of the Danish ODP-weighted consumption in 1997. 2-11 tons of CFCs and 1,225 tons of HCFCs are consumed in 1997 (600 tons HCFC-22 as refrigerant). 20 tons of CFCs have been incinerated in 1997. The consumption of ozone depleting substances in Greenland has been < 1 ODP-tons in 1997. Table .1 Overview of consumption and ODP-weighted consumption in 1997, tons
(1) The distribution of an average consumed amount of 6,5 tons of CFCs is assumed to be 2.5 CFC-113 and 4 tons CFC-12/CFC-11. (2) Consumed as pesticide. Consumption as feed stock for chemical production is not included. (3) The ODP value for individual substances is assumed to be < 0.1 Figure .1 The development of ODP-weighted consumption, ODP-tons.
Figure .2 Distribution of ODP-weighted consumption in 1997, ODP-tons.
Table .2 The development of consumption of substances, tons.
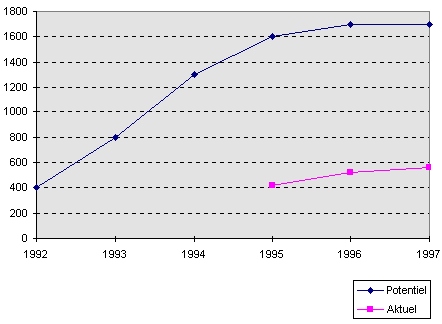
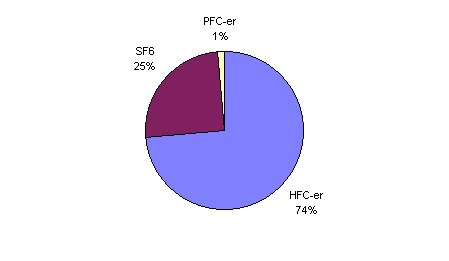
Greenhouse gases An overview of consumption figures as well as potential and actual emission data of industrial greenhouse gases are shown in table 7.3. The consumption of HFCs, dichloromethane and sulphur hexafluoride were 890, 225 and 13 tons in 1997, respectively. The development of consumption of individual substances is given in table 7.4. The GWP-weighted actual emission of the industrially used so-called "pure" greenhouse gases has increased from 520,000 tons CO2-equivalents in 1996 to 560,000 tons CO2-equivalents in 1997 (an increase of approximately 8%). The development of annual GWP-weighted potential and actual emissions is shown in table 7.5 and figure 7.3. Distribution of GWP-weighted actual emissions on substances in 1997 is shown in figure 7.4. This emission is less than 1% of the total Danish GWP-weighted emission of greenhouse gases. The consumption and emissions of perfluorinated hydrocarbons are insignificant. Only perfluoropropane is consumed. Formation of perfluorinated hydrocarbons does not occur in the Danish industry according to the received information. Table 7.3 Overview of potential and actual consumption and emissions in 1997
-1) GWP value unknown. Table 7.4 The development of consumption on substances, tons.
1) Not specified on all substances in 1994, total of HFCs 401a, 402a and others is 5 tons2) Not specified on all substances in 1995, total of HFCs 401a, 402a and others is 13 tons3) Not specified on all substances in 1996, total of HFCs 401a, 402a and others is 20 tons Table 7.5 The development of annual GWP-weighted potential and actual emissions, tons CO2-eq.
* The actual emissions are not investigated before 1995. Figure 7.3 The development of annual GWP-weighted potential and actual emissions, 1000 tons CO2-eq.
Figure 7.4 Distribution of GWP-weighted actual emission in 1997
|
|||||||||||||||||||||||||||||||||||||||||||||||||||||||||||||||||||||||||||||||||||||||||||||||||||||||||||||||||||||||||||||||||||||||||||||||||||||||||||||||||||||||||||||||||||||||||||||||||||


