Datarapport om sammensætning og biogaspotentiale i organisk dagenovation
4 Biogaspotentiale og pilotskala forsøg
4.1 Measurement of Methane-Potentials of Solid Organic Waste
Technical Note submitted for publication in Waste Management
January 2003
Trine L. Hansena, Jens Ejbye Schmidta, Irini Angelidakia, Emilia Marcaa, Jes la Cour Jansenb, Hans Mosbæka & Thomas H. Christensena*
aEnvironment & Resources DTU
Technical University of Denmark
Kongens Lyngby, Denmark
b Department of Water and Environmental Technology,
Lund Institute of Technology, University of Lund,
Lund, Sweden
*Corresponding author:
Thomas H. Christensen,
Environment & Resources DTU
Building 115,
Technical University of Denmark
DK-2800 Kgs. Lyngby
Denmark
Phone: (+45) 4525 1603
Fax: (+45) 4593 2850
E-mail: thc@er.dtu.dk
Key words: Methane, biogas, organic waste, characterization, laboratory measurement
Summary
A laboratory procedure is described for measuring methane potentials of solid waste. Triplicate reactors with 10 g of volatile solids are incubated at 55 oC with 400 ml of inoculum from a thermophilic biogas plant and the methane production is followed over a 50 day-long period by direct measurement of methane on a gas chromatograph. The procedure involves blanks as well as cellulose controls. Methane potentials have been measured for source separated organic household waste and for individual waste materials. The procedure has been evaluated with respect to practicality, workload, detection limit, repeatability and reproducibility as wells as quality control procedures.
Introduction
Several batch methods exist for measuring methane potentials of waste. The basic approach is to incubate a small amount of the waste with an anaerobic inoculum and measure the methane generation usually by simultaneous measurements of gas volume and gas composition. However, the technical approaches in terms of pretreatment of the sample, inoculum, gas measurement technique and incubation vary significantly among the published methods (Adani et al., 2001, Eleazer et al., 1997, Harries et al., 2001, Heerenklage et al., 2002, Owen et al., 1978, Owen et al., 1993). Some of these differences originate from the purpose of measuring the methane potential and from the type of waste samples measured. Most of the methods are geared to either very homogenous samples such as sewage sludge or to samples with low methane potentials such as waste from old landfills or biologically pretreated waste. |
At the Technical University of Denmark (DTU) we have adapted and modified existing
procedures, in particular inspired by Angelidaki and Ahring (1997), into an
easy-to-operate and fast method of measuring methane potentials of solid waste samples
generating high amounts of methane. We here describe the procedure and the experiences
obtained from measuring methane potentials of more than 100 waste samples during a 2-year
period.
The method was used to characterize organic waste, separated from household waste, with respect to methane potential as relevant in the context of treatment by anaerobic digestion. The main goal was to determine a methane potential, e.g. in terms of STP (STP: standard temperature and pressure) ml CH4 per g of organic waste expressed as volatile solids (VS), determined reliably with a reasonable incubations period and with a minimum of work load. The methane generation as a function of time may occasionally also be of interest for identification of inhibition or adaptation. These priorities have fostered a procedure including extensive homogenization of the solid waste sample, a large inoculum, incubation at 55 0C for 50 days, and direct measurement by a gas chromatograph (GC) of CH4-mass produced.
Materials and Equipment
The following materials and equipment are used:
| Two-l glass bottles with a thick rubber septum (chlorobuthyle rubber, Apodan Nordic, Copenhagen, Denmark) are used as reactors. The exact volume of each bottle is determined by weighting the water contained in the bottle. | |
| An incubator at 55° C for the incubation. | |
| Inoculum from a thermophilic biogas plant. | |
| A 1 ml glass syringe with pressure lock (VICI, Precision Sampling Inc., Baton Rouge, LA, USA) to allow sampling of a fixed volume at actual pressure from the reactors. | |
| Gas chromatograph (Shimadzu GC 14A) equipped with a thermal FID detector and methane standards (0,5-100% ± 5% rel.) in nitrogen (Mikrolab, Aarhus, Denmark). A linear calibration curve based on 5 different methane concentrations (0.5-100% ± 5% rel. in nitrogen) is used for calibration. For every analytical series, one methane standard (30% in nitrogen) is measured. The actual content of methane in the samples is calculated based of this standard. | |
| A 1:1 mix of Avicel (Fluka, Sigma-Aldrich, Vallensbæk Strand, Denmark) and cellulose powder (Bie & Berntsen, Rødovre, Denmark) is used as standard substrate in the controls. |
The DTU-methane-potential-measurement
Preparation of the waste
Significant heterogeneity and a wide range of particle sizes characterize solid organic waste separated from household waste. However, only a few grams of waste is used in the measurement in order to manage the gas collection in a practical way and allow several replicates, and thus the waste must be homogenized to secure representative sampling of the waste. The field sampling procedure is described by Jansen et al. (2002), while we here describe the procedure applied in the laboratory on a sample of 20-30 kg of shredded organic waste being the outcome of the field sampling procedure. In the laboratory, the waste sample is first blended, without the addition of water, in a large industrial blender (KW A/S, Humlebæk, Denmark) to reduce particle size and mix the sample. A large subsample (1-2 kg) is taken for determination of dry matter content of the original sample. Thereafter, water is added to the blender (the dry matter content is typically about 25%) and the sample is further blended. After homogenization, a subsample of about 1 kg is transferred to a high-speed blender (Ultra Turrax, T45/N, Jake & Kunkel KG, IKA Werk, Staufen in Breisgau, Germany) and diluted to a dry matter content of 10%. The sample is blended for about 5 minutes. The sample now has an appearance as thick gravy and a small subsample can easily be drawn for determination of dry matter, volatile solids and for the methane-potential measurement. The sample may be frozen and stored for later determination of the methane-potential, as we often have run 5-15 waste samples in each series. |
Inoculum
An active inoculum from a thermophilic biogas plant is needed. We use inoculum from Vegger Biogasanlæg, Aalborg, a biogas plant in Denmark treating primarily manure together with some industrial organic waste and occasionally household organic waste. The plant is operating at 55° C.
The inoculum is transported in a 25 l container by a delivery service guarantying delivery within 48 h. The temperature drops to ambient temperature during delivery, but is always kept above the freezing point. In order to readapt the inoculum to 55oC, ensure degradation of easily available organic matter still present in the inoculum, and remove dissolved methane, the inoculum is stored with an anaerobic headspace for three days in the 55oC incubator.
Set-up of measurement
The test is carried out as triplicate batch experiments.
During stirring of the inoculum, 400 ml of inoculum is transferred to all reactors (the reactors are placed on a scale). For each waste sample, three reactors are picked randomly and during stirring each reactor is supplied with 100 ml of sample (10% DM, 80-90% VS). Each reactor now contains about 2g VS/100 ml solution, which is suitable in order to avoid acidification of the process. After set-up the reactors are flushed for 2 minutes with an anaerobic gas (80% N2 and 20% CO2) to insure anaerobic conditions in the headspace of the batches.
The headspace of each batch is calculated by subtracting the added amount of inoculum and substrate (assuming the density of substrate and inoculum is 1g/mL) from the volume of the bottle.
The reactors are now placed in the incubator at 55° C (± 1° C). During the experiment the batches are occasionally shaken and moved around in the incubator to compensate for any minor variation in temperature in different parts of the incubator. The incubation time is 50 days.
For each run, three blanks with only water and inoculum are included to measure the methane production originating from the inoculum. In addition, three controls (primarily to check the quality of the inoculum) are performed with cellulose as a reference substrate.
The reactors are monitored several times during the incubation. After 50 days the experiment is stopped. pH is measured in the reactor and samples for volatile fatty acids (VFA) and nitrogen content are taken. These samples are typically frozen and only analyzed if the methane potential is low and inhibition by ammonia or VFA accumulation is suspected.
Monitoring
The methane content in the headspace of the reactors is measured regularly (15-20 times) throughout the 50 days of incubation. During the first week daily measurements are necessary. Later it is sufficient to measure once a week.
Gas samples (0.2 ml) are taken from the headspace of the reactors through the septum with a syringe with pressure lock. The pressure lock is closed when the needle of the syringe is inside the reactor headspace, the syringe is redrawn and the sample is injected directly into the gas chromatograph. The amount of gas removed due to the measurements is relatively small (the volume of all gas samples is less than 0.7% of the headspace) and the results are thus not significantly affected by the induced change in actual headspace pressure.
The amount of substrate in the reactors produces approximately 6 l of biogas during the 50 days of incubation. It is therefore necessary to release gas during the experiment to avoid build-up of too high pressure in the reactor leading to leakage of gas. The pressure is always kept below 2 bars, and any significant pressure build-up is easily identified from the shape of the rubber septum. By inserting a hospital needle in the rubber stopper the pressure is released. This is done under a hood and the amount released is calculated from measurement of the methane content in the headspace of the reactor before and after the release. During the first week the gas is released 3-4 times due to a very high gas production. Later the gas is released only occasionally. Typically 80-90% of the methane potential is produced during the first 8-10 days.
Data treatment and presentation
Based on volume of the headspace of each reactor and CH4 content per 0.2 ml of headspace as measured directly on the GC, the produced amount of methane is determined. The measurements including the gas releases are transferred into accumulated CH4 as a function of incubation time.
The methane production from the inoculum (blanks) is subtracted from the methane production of the waste samples. The result thus represents only the methane production from the waste and not from the inoculum. At very low gas productions the uncertainty on the results increases, because the difference between the waste samples and the control samples might not be significant. If the methane potential is low the ratio of waste sample to inoculum should be increased.
The actual temperature (Tm) and atmospheric pressure (Pm) were measured every day that the measurement of methane is performed (Xm). These values were used to determine the gas content at standard temperature and pressure (XSTP ) according to:
![]()
The results are thus given as produced methane production per gram VS at standard conditions (STP: 0° C, 1 atmosphere) versus time.
Experiences
The DTU-methane-potential-measurement has been used routinely on organic waste separated at source from household waste and occasionally on specific organic waste fractions, for example, paper, fat and protein. All the results below are given at STP conditions.
Examples of results
Figure 1 shows examples of triplicate curves measured for organic waste separated from household waste (including inoculum), for blanks containing only inoculum and water and for a control containing cellulose as a reference substrate and inoculum. The triplicates are fair with respect to the final level of produced methane, although the development over time may vary somewhat between triplicates. The large amount of inoculum used gives a fast methane production, but the fact that the inoculum itself produces significant amounts of methane limits the detection limit of the procedure (see later). Figure 2 shows, for the same data as presented in Figure 1, the accumulated methane production for the waste after correction for the methane produced by the inoculum. This is the actual result of the measurement. The methane potential is defined as the maximum of produced methane during the 50 days of experiment (the methane production rate can decline due to inhibition). In Figure 2 the methane potential was in average 495 m3 CH4/t VS for the waste sample and 379 m3 CH4/t VS for the cellulose sample.
Figure 3 shows examples of triplicate curves for food oil (rape seed oil), pork fat, protein (gelatine), paper bags for collecting organic household waste and chemically produced starch and glucose. The theoretical methane potential calculated by assuming full degradation is also shown for each substance. The degradation of the fat was apparently inhibited, may be by accumulation of intermediates (Angelidaki and Ahring, 1992), yielding highly variable methane production curves for the triplicates although the methane potential was determined with reasonable precision. For both fat and oil a significant lag phase (two weeks) was seen. The curves for protein peaked and decreased slightly as the degradation proceeded, probably reflecting inhibition by ammonia, and the methane potential determined as the maximum produced methane varied significantly among the triplicates. For paper bags, starch and glucose, the deviation between the triplicates was modest. The methane potentials achieved for glucose and starch were 94 and 84 % of the theoretical potentials. However, only 63% of the theoretical methane potential was achieved for the paper bags.
Work load
The introduced method seems fairly practical without excessive work. A good working procedure is obtained by running of series with 10-15 samples. Including blanks, cellulose controls and samples, all in triplicates, this involves 36-51 reactors. The time estimates are based on our current experiences:
| Preparation of bottles and inoculum: 1-2 days per series | |
| Preparation of samples: 1-2 hours per sample | |
| Set up of reactors in triplicate: 0.3- 0.5 hours per sample | |
| Monitoring involves determination of CH4 15-20 times during the 50 days of incubation. Furthermore the gas must be released 5-6 times for each sample during the experiment. The time used for the measurements depends on the gas chromatograph used. We used for the monitoring in average 1-1.5 day per sample (15-20 measurements, 5-6 gas releases). | |
| Data evaluation and presentation by means of an existing Excel-sheet: 1 hour per sample. |
Inoculum
The inoculum contains many particles and is not a homogeneous suspension. Thus, a careful set-up procedure is essential to prevent variations between the samples that really originate from variations in the inoculum. The inoculum is thus continuously stirred and distributed to all the bottles in the beginning of the set-up and three bottles are randomly chosen for each sample (triplicates).
We have experienced that we had to discard all data because the cellulose controls or the blanks showed too much variation among triplicates, indicating that the distribution of inoculum to the reactors was not sufficiently homogenous in terms of methane generation in spite of the fact that all reactors had received the same amount of inoculum.
Substrate concentration
The substrate concentration of 2 g VS/100 ml in the reactors is a compromise of, on one hand the need to use a large sample to have good representativity and to get a high easy-to-measure gas production, and on the other hand avoid too large and impractical volumes of reactors and gas production and keep the solution dilute to avoid inhibition from accumulation of VFA and ammonia. If signs of inhibition are observed, as for example for protein in Figure 3, new measurements with a lower substrate concentration and dilute inoculum should be made.
Statistical performance
Although our experience with the methods still is limited with respect to the number of samples that have been determined, we provide the first statistical evaluation of the performance of the DTU-method for determination of methane potentials of organic solid waste. The relative limited number of samples involved in the statistical analysis leads to fairly coarse estimates of uncertainties and large confidence intervals. As more samples are determined these estimates most likely will improve.
Detection limit
The uncertainty of the blanks, i.e. the triplicates with water and inoculum, determines the detection limit of the methane potential measurement, since the average of the blanks is subtracted from the average of the three samples. The mean and standard deviation of triplicate blanks from 6 series of measurements was 5.79 and 0.408 ml CH4/ml solution giving a relative standard deviation of 7.04%. The detection limit DL, given as the limit above which one can quantify a difference between a sample and a blank sample with a probability of 95%, can be calculated from:
![]() ,
,
where
| t(v) | is the 95% quantile in the Student t-distribution with v
degrees of freedom, |
| s2 | is the estimated variance of the blanks, |
| n1 | is the number of replicates used to measure the sample, |
| n2 | is the number of replicates used to measure the blanks. |
In the present case the degrees of freedom are 12 and the numbers n1 and n2
are 3 derived from the use of triplicates for any measurements. Using s = 0.408 ml CH4/ml
solution from above we obtain:
![]()
The interpretation of the DL value is that if the average of a set of sample triplicates exceeds the average of a set of triplicates of blanks with more than 1.45 N ml CH4 / ml solution, then a significant methane production from the samples is obtained, and it can be quantified with a confidence of at least 95%. Typically, the measurement is performed with 500 ml solution and 2 g VS/100 ml, that is 10 g VS in total. Therefore, the above detection limit translates into a DL for methane production of 72.5 Nml CH4/g VS (1.45 Nml CH4/ml solution x 500 ml solution /10 g VS).
This detection limit is acceptable since most samples are in the range of 200 – 500 Nml CH4/g VS (identical to 200 – 500 Nm3 CH4/t VS). If samples with lower methane potentials are measured the detection limit can be lowered by increasing the ratio of sample to inoculum in the set-up of the measurements.
Repeatability and reproducibility
Repeatability and reproducibility is determined on the basis of seven series of triplicate measurements of the methane potential of cellulose. The average and the standard deviation of the average were 377.2 and 9.3 ml CH4/gVS respectively, and the average standard deviation within triplicates was 38.7 ml CH4/gVS.
The uncertainty of the measurement defined as the repeatability (r) (the uncertainty of repeated measurements of the same sample within the same analytical series) can be found from the recommendation in the ISO 5725 standard yielding:
![]()
where
sr = is the standard deviation within series given above as 38.7 ml CH4/gVS
The repeatability is then 107 ml CH4 /gVS, which is the 95% envelope for absolute difference between two single measurements of the same sample. The corresponding repeatability for the an average of three samples, r3 is:
![]()
The reproducibility of the measurement can be found from the same seven experiments of the methane potential of cellulose as presented above. The reproducibility (R) reflects the full uncertainty, since each average is determined in separate series, i.e. different inoculum, different days of set-up and different monitoring. Using ISO 5725 the same formulas appear as above:
![]()
where
sR is the standard deviation including variation within and between the series,
found to be 41.8 ml CH4/gVS:
![]()
The reproducibility R is then = 116 ml CH4/gVS and R3 = 67 ml CH4/gVS. The reproducibility states that two measurements of the same sample performed according to the describe method but on different days in 95% of all cases will be 67 ml CH4/gVS or less apart from each other.
Quality control
The performance of the controls, the cellulose samples, is used as a quality control in each series of measurements (same inoculum, set-up the same day, and monitored the same days). The quality control addresses both the variation among the three individual cellulose samples and the variation of the observed average from previously observed cellulose methane potentials.
If the range (largest minus smallest value) of the three individual control samples is high, it may reflect lack of a homogeneous inoculum and the measurements should be disregarded. Based on classical control chart theory as described in standard text books on statistical control (e.g. Juran, 1976), the upper control limit for the range of triplicate control samples is the average range times 2.5739. The average range of the triplicate controls in the seven series was 60.6 ml CH4/g VS, which gives an acceptable range of the three controls within a single series equal to 156 ml CH4/g VS. This dictates that if the difference between the largest and smallest value of three controls exceeds 156 ml CH4/g VS, then the series should be disregarded.
If the average of the three control samples deviates too much from a previously determined average, it may suggest that the inoculum, although evenly distributed into the reactors, was inhibited or of other reasons produced too little methane. Assuming standard Gaussian assumptions the upper and lower limit for the average of the three control samples can be derived from standard textbooks on statistical process control (e.g. Juran, 1976). Based on an average triplicate range of 60.6 ml CH4/gVS the limits can be calculated as the overall average +/- 1.025•60.6 ml CH4/g VS equalling 315 and 439 ml CH4/g VS, respectively. This means that if the average of the three control samples is outside these control limits the series should be disregarded.
Deviating results
In addition to signs of inhibition, as discussed above, some samples also have shown negative methane potentials. Due to some kind of inhibitory effect from the substrate the samples produced less methane than the blanks (inoculum and water). This effect has mainly been seen in experiments with single waste fractions such as newspaper and magazines. Further experiments must be carried out to determine the inhibitory agent, if such results are obtained.
References
Adani F., Calcaterra E. and Malagutti L. (2001). Preparation of a test for estimating biogas production from pretreated urban waste. Proceeding Sardinia 2001 Eight International Waste Management and Landfill Symposium, Cagliari. Italy.
Angelidaki I., Ahring B.K. (1992). Effects of free long-chain fatty acids on thermophilic anaerobic digestion. Applied Microbiology and Biotechnology, 37, 808-812.
Angelidaki I., Ahring B.K. (1997). Codigestion of oil mill wastewaters together with manure, household waste or sewage sludge. Biodegradation, 8,221-226
Eleazer W.E., Odle W.S.III, Wang Y.-S. and Barlaz M.A. (1997). Biodegradability of municipal solid waste components in laboratory-scale landfills. Environmental Science & Technology, 31, 911-917
Harries C.R., Cross C.J. and Smith R., (2001). Development of a BMP test and application to testing of MSW samples. Proceeding Sardinia 2001 Eight International Waste Management and Landfill Symposium, Cagliari, Italy
Heerenklage J. and Stegmann R., (2001). Comparison of test systems for the determination of the gas potential from waste. Proceeding Sardinia 2001 Eight International Waste Management and Landfill Symposium, Cagliari, Italy.
ISO 5725-2:1994, Accuracy (trueness and precision) of measurement methods and results - Part 2: Basic method for the determination of repeatability and reproducibility of a standard measurement method, International Standard Organization.
Jansen J.l.C., Spliid H., Hansen T.L., Svärd Å. and Christensen T.H. (2002).
Assessment of sampling and chemical analysis of source-separated organic household waste. Submitted.
Juran J.M. (1976): "Quality Control Handbook", McGraw-Hill, New York.
Lay J.J., Li Y.Y., Noike T., Endo J. and Hoshimoto S. (1997). Analysis of environmental factors affecting methane production from high-solids organic waste, Water Science & Technology, 36, 493-500.
Owen W.F., Stuckey D.C., Healy J.B., Jr., Young L.Y. and McCarty P.L. (1979). Bioassay for monitoring biochemical methane potential and anaerobic toxicity. Water Research, 13, 485-492
Owens J.M. and Chinoweth D. P. (1993). Biochemical methane potential of municipal solid waste components. Water Science & Technology, .27, 1-14.
Tong M., McCarthy P.L. and Smith L.H. (1990). Methane fermentation of selected lignocellulosic materials. Biomass, 21, 239-235

Figure 1:
Examples of triplicate methane production curves measured for organic waste separated
from household waste (including inoculum), for blanks containing only inoculum and for
control samples containing cellulose and inoculum.

Figure 2:
Methane production curves measured for organic waste separated from household waste
and for control samples containing cellulose as a reference substrate. The data are
derived from Figure 2.

Figure 3:
Examples of triplicate methane production curves for food oil (rape seed oil), pork
fat, protein (gelatine), paper bags for collection of organic household waste and
chemically produced starch and glucose.
4.2 Gaspotentiale: Resultater
I det følgende præsenteres resultaterne af gaspotentialemålingerne for biomasse og rejekter. Resultaterne er opstillet i forskellige tabeller for at belyse forskellige problemstillinger. De angivne teoretiske gaspotentialer er beregnet ud fra den kemiske sammensætning af de enkelte prøver. Gaspotentiale målingerne angives som Nm3 CH4/t VS, men omregnes ligeledes til henholdsvis Nm3 CH4/t TS, Nm3 CH4/t biomasse og Nm3 CH4/t indsamlet affald. Dette sker ved hjælp af det målte indhold af VS, TS og forbehandlingseffektivitet for den enkelte prøve. Sidst i afsnittet findes oversigtstabeller, hvor alle potentialemålingerne ses samlet.
4.2.1 Indsamlingsområder
I tabel 4.2.1 er gaspotentialerne sorteret efter indsamlingsområde.
Tabel 4.2.1.a
Gaspotentialer for biomasse fra affald indsamlet i Hovedstadområdet forbehandlet med
forskellige forbehandlingsmetoder
Dato
|
Prøve
|
Teoretisk gaspot |
Gaspot |
Gaspot |
Gaspot |
Gaspot |
010514 |
Ho_I_He_A |
532 |
489 |
425 |
131 |
88 |
011001 |
Ho_I_He_A |
498 |
298 |
270 |
71 |
51 |
|
|
|
|
|
|
|
010514 |
Ho_F_He_A |
539 |
495 |
445 |
136 |
89 |
011001 |
Ho_F_He_A |
503 |
500 |
433 |
119 |
86 |
|
|
|
|
|
|
|
010521 |
Ho_F_Aa_A |
551 |
- |
- |
- |
- |
020122 |
Ho_F_Aa_A |
530 |
449 |
415 |
111 |
59 |
|
|
|
|
|
|
|
010521 |
Ho_I_Aa_A |
545 |
- |
- |
- |
- |
020122 |
Ho_I_Aa_A |
525 |
435 |
402 |
106 |
55 |
|
|
|
|
|
|
|
011115 |
Ho_I_"Gr"_A |
510 |
463 |
435 |
125 |
125 |
020204 |
Ho_I_"Gr"_A |
521 |
530 |
491 |
141 |
141 |
|
|
|
|
|
|
|
011115 |
Ho_F_"Gr"_A |
522 |
416 |
382 |
116 |
116 |
020204 |
Ho_F_"Gr"_A |
541 |
463 |
438 |
132 |
132 |
Gennemsnit |
526 |
454 |
414 |
119 |
94 |
|
Tabel 4.2.1.b
Gaspotentialer for biomasse fra affald indsamlet i Aalborg forbehandlet med
forskellige forbehandlingsmetoder
Dato
|
Prøve
|
Teoretisk gaspot |
Gaspot |
Gaspot |
Gaspot |
Gaspot |
010521 |
Aa_I_Aa_A |
540 |
- |
- |
- |
- |
020408 |
Aa_I_Aa_A |
544 |
566 |
494 |
124 |
89 |
|
|
|
|
|
|
|
010927 |
Aa_F_Aa_A |
545 |
380 |
329 |
73 |
40 |
020122 |
Aa_F_Aa_A |
550 |
469 |
428 |
116 |
59 |
|
|
|
|
|
|
|
011115 |
Aa_I_He_A |
525 |
464 |
389 |
122 |
76 |
020204 |
Aa_I_He_A |
528 |
546 |
471 |
132 |
95 |
|
|
|
|
|
|
|
011115 |
Aa_F_He_A |
522 |
410 |
359 |
104 |
69 |
Gennemsnit |
536 |
472 |
412 |
112 |
71 |
|
Tabel 4.2.1.c
Gaspotentialer for biomasse fra affald indsamlet i Vejle forbehandlet med forskellige
forbehandlingsmetoder
Dato |
Prøve |
Teoretisk gaspot |
Gaspot |
Gaspot |
Gaspot |
Gaspot |
010514 |
Ve_F_He_A |
432 |
- |
- |
- |
- |
011001 |
Ve_F_He_A |
495 |
515 |
413 |
125 |
91 |
|
|
|
|
|
|
|
010514 |
Ve_I_He_A |
531 |
- |
- |
- |
- |
011001 |
Ve_I_He_A |
498 |
519 |
438 |
124 |
86 |
|
|
|
|
|
|
|
010927 |
Ve_I_Aa_A |
529 |
492 |
424 |
78 |
45 |
020408 |
Ve_I_Aa_A |
541 |
462 |
407 |
108 |
62 |
|
|
|
|
|
|
|
010927 |
Ve_F_Aa_A |
538 |
320 |
260 |
67 |
30 |
020408 |
Ve_F_Aa_A |
530 |
454 |
387 |
141 |
89 |
Gennemsnit |
523 |
460 |
388 |
107 |
67 |
|
Tabel 4.2.1.d
Gaspotentialer for biomasse fra affald indsamlet i Kolding forbehandlet med
forskellige forbehandlingsmetoder
Dato |
Prøve |
Teoretisk gaspot |
Gaspot |
Gaspot |
Gaspot |
Gaspot |
010531 |
Ko_I_Aa_A |
549 |
- |
- |
- |
- |
020307 |
Ko_I_Aa_A |
542 |
521 |
461 |
125 |
78 |
|
|
|
|
|
|
|
010531 |
Ko_F_Aa_A |
558 |
- |
- |
- |
- |
020408 |
Ko_F_Aa_A |
552 |
459 |
380 |
130 |
100 |
|
|
|
|
|
|
|
020116 |
Ko_I_He_A |
539 |
573 |
468 |
153 |
91 |
020321 |
Ko_I_He_A |
543 |
388 |
315 |
96 |
60 |
|
|
|
|
|
|
|
020116 |
Ko_F_He_A |
534 |
404 |
353 |
120 |
67 |
020321 |
Ko_F_He_A |
532 |
504 |
419 |
124 |
68 |
Gennemsnit |
543 |
475 |
399 |
125 |
77 |
|
Tabel 4.2.1.e
Gaspotentialer for biomasse fra affald indsamlet og forbehandlet i Grindsted
Dato |
Prøve |
Teoretisk
gaspot |
Gaspot |
Gaspot |
Gaspot |
Gaspot |
011003 |
Gr_Gr |
537 |
495 |
456 |
128 |
128 |
020220 |
Gr_Gr |
509 |
513 |
458 |
144 |
144 |
Gennemsnit |
523 |
504 |
457 |
136 |
136 |
|
Tabel 4.2.1.f
Gaspotentialer for biomasse fra affald indsamlet i Malmö forbehandlet med forskellige
forbehandlingsmetoder
Dato |
Prøve |
Teoretisk gaspot |
Gaspot |
Gaspot |
Gaspot |
Gaspot |
020416 |
Ma_S_A_1 |
519 |
556 |
482 |
152 |
55 |
020530 |
Ma_S_A_2 |
507 |
516 |
413 |
126 |
55 |
020201 |
Ma_K_A_1 |
548 |
445 |
408 |
15 |
15 |
020417 |
Ma_K_A_2 |
653 |
472 |
448 |
26 |
26 |
Gennemsnit |
557 |
497 |
438 |
80 |
38 |
|
4.2.2 Forbehandlingsmetoder
Tabel 4.2.2 viser gaspotentialerne opdelt på forbehandlingsmetoder.
Tabel 4.2.2.a
Gaspotentialer for biomasse forbehandlet på rullesigte
Rullesigte |
Teoretisk
gaspot |
Gaspot |
Gaspot |
Gaspot |
Gaspot |
|
Dato |
Prøve |
|||||
010514 |
Ho_I_He_A |
532 |
489 |
425 |
131 |
88 |
011001 |
Ho_I_He_A |
498 |
298 |
270 |
71 |
51 |
|
|
|
|
|
|
|
010514 |
Ho_F_He_A |
539 |
495 |
445 |
136 |
89 |
011001 |
Ho_F_He_A |
503 |
500 |
433 |
119 |
86 |
|
|
|
|
|
|
|
011115 |
Aa_I_He_A |
525 |
464 |
389 |
122 |
76 |
020204 |
Aa_I_He_A |
528 |
546 |
471 |
132 |
95 |
|
|
|
|
|
|
|
011115 |
Aa_F_He_A |
533 |
410 |
359 |
104 |
69 |
|
|
|
|
|
|
|
010514 |
Ve_I_He_A |
531 |
- |
- |
- |
- |
011001 |
Ve_I_He_A |
498 |
519 |
438 |
124 |
86 |
|
|
|
|
|
|
|
010514 |
Ve_F_He_A |
532 |
- |
- |
- |
- |
011001 |
Ve_F_He_A |
495 |
515 |
413 |
125 |
91 |
|
|
|
|
|
|
|
020116 |
Ko_I_He_A |
539 |
573 |
468 |
153 |
91 |
020321 |
Ko_I_He_A |
543 |
388 |
315 |
96 |
60 |
|
|
|
|
|
|
|
020116 |
Ko_F_He_A |
534 |
404 |
353 |
120 |
67 |
020321 |
Ko_F_He_A |
532 |
504 |
419 |
124 |
68 |
Gennemsnit |
524 |
470 |
400 |
120 |
78 |
|
Tabel 4.2.2.b
Gaspotentialer for biomasse forbehandlet på skrueseparator
Skrueseparator |
Teoretisk
gaspot |
Gaspot |
Gaspot |
Gaspot |
Gaspot |
|
Dato |
Prøve |
|||||
010521 |
Ho_I_Aa_A |
545 |
- |
- |
- |
- |
020122 |
Ho_I_Aa_A |
525 |
435 |
402 |
106 |
55 |
|
|
|
|
|
|
|
010521 |
Ho_F_Aa_A |
551 |
- |
- |
- |
- |
020122 |
Ho_F_Aa_A |
530 |
449 |
415 |
111 |
59 |
|
|
|
|
|
|
|
010521 |
Aa_I_Aa_A |
540 |
- |
- |
- |
- |
020408 |
Aa_I_Aa_A |
544 |
566 |
494 |
124 |
89 |
|
|
|
|
|
|
|
010927 |
Aa_F_Aa_A |
545 |
380 |
329 |
73 |
40 |
020122 |
Aa_F_Aa_A |
550 |
469 |
428 |
116 |
59 |
|
|
|
|
|
|
|
010927 |
Ve_I_Aa_A |
529 |
492 |
424 |
78 |
45 |
020408 |
Ve_I_Aa_A |
541 |
462 |
407 |
108 |
62 |
|
|
|
|
|
|
|
010927 |
Ve_F_Aa_A |
538 |
320 |
260 |
67 |
30 |
020408 |
Ve_F_Aa_A |
530 |
454 |
387 |
141 |
89 |
|
|
|
|
|
|
|
010531 |
Ko_I_Aa_A |
549 |
- |
- |
- |
- |
020307 |
Ko_I_Aa_A |
542 |
521 |
461 |
125 |
78 |
|
|
|
|
|
|
|
010531 |
Ko_F_Aa_A |
558 |
- |
- |
- |
- |
020408 |
Ko_F_Aa_A |
552 |
459 |
380 |
130 |
100 |
Gennemsnit |
542 |
455 |
399 |
107 |
64 |
|
Tabel 4.2.2.c
Gaspotentialer for biomasse forbehandlet med neddeler + magnet
Neddeler+magnet |
Teoretisk
gaspot |
Gaspot |
Gaspot |
Gaspot |
Gaspot |
|
Dato |
Prøve |
|||||
011115 |
Ho_I_"Gr"_A |
510 |
463 |
435 |
125 |
125 |
020204 |
Ho_I_"Gr"_A |
521 |
530 |
491 |
141 |
141 |
|
|
|
|
|
|
|
011115 |
Ho_F_"Gr"_A |
522 |
416 |
382 |
116 |
116 |
020204 |
Ho_F_"Gr"_A |
541 |
463 |
438 |
132 |
132 |
|
|
|
|
|
|
|
011003 |
Gr_Gr |
537 |
495 |
456 |
128 |
128 |
020220 |
Gr_Gr |
509 |
513 |
458 |
144 |
144 |
Gennemsnit |
523 |
480 |
443 |
131 |
131 |
|
Tabel 4.2.2.d
Gaspotentialer for biomasse forbehandlet med stempelseparator
Centralsug + stempelsep. |
Teoretisk
gaspot |
Gaspot |
Gaspot |
Gaspot |
Gaspot |
|
Dato |
Prøve |
|||||
020416 |
Ma_S_A_1 |
519 |
556 |
482 |
152 |
55 |
020530 |
Ma_S_A_2 |
507 |
516 |
413 |
126 |
55 |
Gennemsnit |
513 |
536 |
448 |
139 |
55 |
|
Tabel 4.2.2.e
Gaspotentialer for biomasse forbehandlet med køkkenkværn
Køkkenkværn |
Teoretisk
gaspot |
Gaspot |
Gaspot |
Gaspot |
Gaspot |
|
Dato |
Prøve |
|||||
020201 |
Ma_K_A_1 |
548 |
445 |
408 |
15 |
15 |
020417 |
Ma_K_A_2 |
653 |
472 |
448 |
26 |
26 |
Gennemsnit |
601 |
459 |
428 |
20 |
20 |
|
4.2.3 Gaspotentialer for rejektprøver
Der blev målt biogaspotentiale på en udvalgt mængde rejektprøver. Målingen er foretaget efter sortering af rejektet og der er udelukkende målt biogaspotentiale på den organiske fraktion af rejektet. Tabel 4.2.3 viser de målte gaspotentialer for rejektprøverne. Til sammenligning er gaspotentialerne for de tilhørende biomasse ligeledes angivet i tabellen. På trods af sortering og neddeling af den organiske fraktion var rejektprøverne stadig relativt inhomogene, hvilket sandsynligvis er grunden til de relativt store standardafvigelser på triplikaterne i nogen af forsøgene.
Tabel 4.2.3
Gaspotentialer for biomasseprøver og den organiske fraktion af rejektet
Dato |
Prøve |
Gaspot, biomasse |
Gaspot, rejekt |
Stdev [%] |
011001 |
Ho_I_He |
298 |
553 |
14 |
011001 |
Ho_F_He |
500 |
325 |
26 |
020122 |
Ho_I_Aa |
435 |
367 |
8 |
020122 |
Ho_F_Aa |
449 |
426 |
22 |
Gennemsnit |
420 |
418 |
18 |
|
011115 |
Aa_I_He |
464 |
329 |
32 |
020204 |
Aa_I_He |
546 |
307 |
12 |
010927 |
Aa_F_Aa |
380 |
276 |
3 |
020122 |
Aa_F_Aa |
469 |
442 |
9 |
Gennemsnit |
465 |
339 |
14 |
|
010514 |
Ve_I_He |
362* |
105 |
52 |
010514 |
Ve_F_He |
388* |
156 |
16 |
010927 |
Ve_I_Aa |
492 |
312 |
9 |
010927 |
Ve_F_Aa |
320 |
210 |
24 |
Gennemsnit |
390 |
196 |
25 |
|
020116 |
Ko_I_He |
573 |
257 |
42 |
020116 |
Ko_F_He |
404 |
204 |
33 |
010531 |
Ko_I_Aa |
411* |
417 |
12 |
010531 |
Ko_F_Aa |
394* |
390 |
15 |
Gennemsnit |
446 |
317 |
25 |
|
*) Disse målinger af metanpotentiale på biomassen er behæftet med store usikkerheder og ikke angivat andre steder i rapporten.
4.2.4 Oversigtstabeller
Tabel 4.2.4 er en oversigttabel, der viser teoretiske og målte gaspotentialer for biomasse. Prøverne er opstillet i kronologisk rækkefølge. Det teoretiske metanpotentiale er beregnet ud fra den kemiske komposition af biomasse. Sammen med de målte biogaspotentialer er angivet standardafvigelsen på triplikaterne i de enkelte forsøg. Sidste kolonne angiver, hvor stor en del af det teoretiske mentanpotentiale der er opnået ved potentialemålingen.Tabel 4.2.5 viser samtlige målte gaspotentialer angivet med forskellige enheder.
Tabel 4.2.4
Teoretisk og målt gaspotentiale for samtlige prøver målt (biomasse)
Dato
|
Prøve
|
Teoretisk gaspot |
Målt gaspot |
Stdev |
Opnået potentiale |
010514
|
Ho_I_He_A |
532 |
489 |
1 |
92 |
Ho_F_He_A |
539 |
495 |
5 |
92 |
|
Ve_F_He_A |
532 |
- |
- |
- |
|
Ve_I_He_A |
531 |
- |
- |
- |
|
010521
|
Aa_I_Aa_A |
540 |
- |
- |
- |
Ho_F_Aa_A |
551 |
- |
- |
- |
|
Ho_I_Aa_A |
545 |
- |
- |
- |
|
10531
|
Ko_I_Aa_A |
549 |
- |
- |
- |
Ko_F_Aa_A |
558 |
- |
- |
- |
|
010927
|
Ve_I_Aa_A |
529 |
492 |
4 |
93 |
Ve_F_Aa_A |
538 |
320 |
27 |
59 |
|
Aa_F_Aa_A |
545 |
380 |
5 |
70 |
|
011001
|
Ho_I_He_A |
498 |
298 |
4 |
60 |
Ho_F_He_A |
503 |
500 |
1 |
99 |
|
Ve_I_He_A |
498 |
519 |
2 |
104 |
|
Ve_F_He_A |
495 |
515 |
3 |
104 |
|
011003 |
Gr_Gr |
537 |
495 |
2 |
92 |
011115
|
Ho_I_"Gr"_A |
510 |
463 |
9 |
91 |
Ho_F_"Gr"_A |
522 |
416 |
3 |
80 |
|
Aa_I_He_A |
525 |
464 |
9 |
88 |
|
Aa_F_He_A |
533 |
410 |
7 |
77 |
|
020116
|
Ko_I_He_A |
539 |
573 |
1 |
106 |
Ko_F_He_A |
534 |
404 |
2 |
76 |
|
020122
|
Ho_F_Aa_A |
530 |
449 |
10 |
85 |
Ho_I_Aa_A |
525 |
435 |
13 |
83 |
|
Aa_F_Aa_A |
550 |
469 |
1 |
85 |
|
020204
|
Aa_I_He_A |
528 |
546 |
2 |
103 |
Ho_I_"Gr"_A |
521 |
530 |
10 |
102 |
|
Ho_F_"Gr"_A |
541 |
463 |
2 |
86 |
|
020220 |
Gr_Gr |
509 |
513 |
35 |
101 |
020307 |
Ko_I_Aa_A |
542 |
521 |
4 |
96 |
020321
|
Ko_I_He_A |
543 |
388 |
10 |
71 |
Ko_F_He_A |
532 |
504 |
2 |
95 |
|
020408
|
Ve_F_Aa_A |
530 |
454 |
10 |
86 |
Ve_I_Aa_A |
541 |
462 |
23 |
85 |
|
Aa_I_Aa_A |
544 |
566 |
8 |
104 |
|
Ko_F_Aa_A |
552 |
459 |
5 |
83 |
|
020416 |
Ma_S_A_1 |
519 |
556 |
14 |
107 |
020530 |
Ma_S_A_2 |
507 |
516 |
1 |
102 |
020201 |
Ma_K_A_1 |
548 |
445 |
65 |
81 |
020417 |
Ma_K_A_2 |
653 |
472 |
38 |
72 |
Tabel 4.2.5
Gaspotentialer (angivet med forskellige enheder) for samtlige prøver målt (biomasse)
Dato
|
Prøve
|
Teoretisk gaspot |
Gaspot |
Gaspot |
Gaspot |
Gaspot |
010514
|
Ho_I_He_A |
532 |
489 |
425 |
131 |
88 |
Ho_F_He_A |
539 |
495 |
445 |
136 |
89 |
|
010927
|
Ve_I_Aa_A |
529 |
492 |
424 |
78 |
45 |
Ve_F_Aa_A |
538 |
320 |
260 |
67 |
30 |
|
Aa_F_Aa_A |
545 |
380 |
329 |
73 |
40 |
|
011001
|
Ho_I_He_A |
498 |
298 |
270 |
71 |
51 |
Ho_F_He_A |
503 |
500 |
433 |
119 |
86 |
|
Ve_I_He_A |
498 |
519 |
438 |
124 |
86 |
|
Ve_F_He_A |
495 |
515 |
413 |
125 |
91 |
|
011003 |
Gr_Gr |
537 |
495 |
456 |
128 |
128 |
011115
|
Ho_I_"Gr"_A |
510 |
463 |
435 |
125 |
125 |
Ho_F_"Gr"_A |
522 |
416 |
382 |
116 |
116 |
|
Aa_I_He_A |
525 |
464 |
389 |
122 |
76 |
|
Aa_F_He_A |
533 |
410 |
359 |
104 |
69 |
|
020116
|
Ko_I_He_A |
539 |
573 |
468 |
153 |
91 |
Ko_F_He_A |
534 |
404 |
353 |
120 |
67 |
|
020122
|
Ho_F_Aa_A |
530 |
449 |
415 |
111 |
59 |
Ho_I_Aa_A |
525 |
435 |
402 |
106 |
55 |
|
Aa_F_Aa_A |
550 |
469 |
428 |
116 |
59 |
|
020204
|
Aa_I_He_A |
528 |
546 |
471 |
132 |
95 |
Ho_I_"Gr"_A |
521 |
530 |
491 |
141 |
141 |
|
Ho_F_"Gr"_A |
541 |
463 |
438 |
132 |
132 |
|
020220 |
Gr_Gr |
509 |
513 |
458 |
144 |
144 |
020307 |
Ko_I_Aa_A |
542 |
521 |
461 |
125 |
78 |
020321
|
Ko_I_He_A |
543 |
388 |
315 |
96 |
60 |
Ko_F_He_A |
532 |
504 |
419 |
124 |
68 |
|
020408
|
Ve_F_Aa_A |
530 |
454 |
387 |
141 |
89 |
Ve_I_Aa_A |
541 |
462 |
407 |
108 |
62 |
|
Aa_I_Aa_A |
544 |
566 |
494 |
124 |
89 |
|
Ko_F_Aa_A |
552 |
459 |
380 |
130 |
100 |
|
020416 |
Ma_S_A_1 |
519 |
556 |
482 |
152 |
55 |
020530 |
Ma_S_A_2 |
507 |
516 |
413 |
126 |
55 |
020201 |
Ma_K_A_1 |
548 |
445 |
408 |
15 |
15 |
020417 |
Ma_K_A_2 |
653 |
472 |
448 |
26 |
26 |
4.3 Udrådningsforsøg i pilotskala: metode
Åsa Svärd og Jes la Cour Jansen, Avdelningen för Vattenförsörjnings- och Avloppsteknik, Lunds Tekniska Högskola.
Sjölundaverket i Malmö (byens store renseanlæg) har etableret en forsøgsstation med 5 parallelt opstillede pilot rådnetanke med tilhørende gasklokker. Udstyret blev etableret til forsøg med udrådning af slam og dimensioner af rådnetanke og gasklokker var oprindeligt valgt svarende til sådanne forsøg. Det enkelte system er indrettet svarende til et fuldskalaanlæg med temperaturregulering og omrøring i rådnetanken og med gasopsamling i en gasklokke. Indfødning og udtag af udrådnet materiale sker manuelt. Nedenfor beskrives forsøgsudstyret, det affald der indgår i undersøgelserne, forsøgsdriften, opstart af den enkelte forsøgsreaktor samt bestemmelsen af metanudbyttet og karakteren af biomassen efter udrådning.
4.3.1 Forsøgsudstyr
Hvert af de 5 parallelt opstillede pilotanlæg består af rådnetank og gasopsamlingssystem som vist i figur 4.3.1, hvor de centrale driftsparametre ligeledes er angivet.
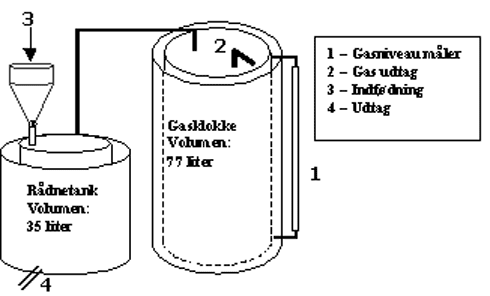
Driftsparametre:
Opholdstid: 15 døgn
Temperatur: 55 ºC
Tørstofindhold i biomasse: 5 %
Organisk belastning: 2,8 kg VS/m3·d
Indfødning og udtag af biomasse: En gang i døgnet
Figur 4.3.1:
Rådnetank med gasklokke
4.3.1.1 Rådnetanke
Rådnetankene er cylinderformede og udført i rustfrit stål med et totalvolumen af den enkelte reaktor på ca. 35 l med et effektivt væskevolumen på 20 l. Tankene er forsynet med temperaturreguleringsudstyr, således at de kan drives ved en konstant forvalgt temperatur, her 55 ºC. Indfødning af biomasse sker gennem en 1" ventil i toppen af tanken og udtag af udrådnet materiale sker gennem en 1 ¼ " ventil nederst på reaktorens side. I den første undersøgelsesrunde blev det konstateret at gasproduktionen var så stor at de eksisterende gasklokker ikke kunne rumme 1 døgns gasproduktion og det blev derfor nødvendigt successivt at udbygge disse. I den første runde blev problemet løst ved dels at bygge en ny gasklokke og dels ved at parallelkoble to af de eksisterende.
4.3.1.2 Varmesystem
Reaktorerne er placeret i et elektrisk opvarmet vandbad. For at reducere fordampningen fra vandbadene er de åbne områder dækket med isolerende materiale.
4.3.1.3 Opblanding
Opblandingen i reaktorerne sker med topmonterede omrørere af propellertypen, se figur 4.3.2. Omrørerne er af rustfrit stål med en diameter på 335 mm. De er placeret 300 mm nede i reaktoren og roterer med 23 omdrejninger pr minut.

Figur 4.3.2:
Omrørerpropel set fra siden.
Opholdstiden i hver rådnetank er kontrolleret med sporstofforsøg. Flere forskellige sporstoffer er tilsat samtidig og udvaskningen er fulgt i den efterfølgende periode.
4.3.1.4 Gasopsamlingssystem
Gassen forlader rådnetanken i toppen og føres gennem en slange til gasklokkens top. Denne er af rustfrit stål og består af en omvendt cylinder placeret i et cylinderformet delvist vandfyldt kar. De små gasklokker, der blev anvendt i første forsøgsrunde har et volumen på ca. 33 liter. De store glasklokker har volumen 77 liter. En ventil til prøvetagning af gassen og til tømning af gasklokken findes på toppen.
Måling af den producerede mængde gas gøres på et niveaurør af glas som viser væskeniveauet i gasklokken.
Måling af gasproduktionen er påvirket af en række usikkerhedsmomenter.
Usikkerhed ved aflæsning af væskeniveauet position
Aflæsningen af væskeniveauets position forventes at kunne aflæses med 1 mm's nøjagtighed. Det betyder at usikkerheden på metanmængden bliver ca. 0,1 l . Den typiske gasproduktion er ca. 30 l metan om dagen således at usikkerheden på metanmængden bliver 0,3 % pr. døgn.
Usikkerhed pga. overtryk i gasklokken.
Når gassen i gasklokken fortrænger væsken opbygges et stigende overtryk i gasklokken i reaktoren og i slangerne. Det større tryk betyder at den aflæste gasmængde undervurderes med op til ca. 1 %.
Usikkerhed som følge af opløsning af gas i vandet
I gasklokken er der et højt partialtryk af metan og kuldioxid. Opløseligheden af metan i vand er så lille at det ikke har betydning for bestemmelsen af gasmængden. Derimod er opløseligheden af kuldioxid høj, således at alene metangasproduktionen bestemmes i forbindelse med undersøgelserne.
4.3.2 Affaldet
Det enkelte udrådningsforsøg har en varighed på 2-3 måneder. I hvert forsøg anvendes biomasse bestående af forbehandlet, kildesorteret organisk dagrenovation fra samme indsamlingsdag. I forbindelse med den enkelt prøvetagning er delmængder af biomassen nedfrosset separat, således at biomassen er nedfrosset indtil den skal anvendes. For at undgå organisk overbelastning af reaktorerne og for at sikre en tilstrækkelig opblanding i reaktorerne også af biomasse med et stort papir eller plastindhold er det valgt at dosere biomassen med et tørstofindhold på ca. 5%. Da biomassen i de fleste tilfælde har et væsentligt større tørstofindhold end 5% fortyndes den i forbindelse med forberedelse til indfødning.
Det typiske forsøg består af en opstartsperiode på 2-3 uger og en periode med fuld belastning på ca. 2 måneder efterfulgt af en efterafgasningsperiode på ca. 1 uge, hvor gasproduktionen uden indfødning følges. Denne fase startes når der er opnået en længere periode med stabil drift således at podematerialets effekt på gasproduktionen er uden betydning og således at der opnås et godt grundlag for bestemmelse af metanudbyttet ved udrådningen. Nedenfor beskrives den praktiske forsøgsdrift medens de enkelte faser i forsøget beskrives i afsnit 4.3.4 - 4.3.6.
4.3.3.1 Indfødning og udtag af biomasse
Indfødning af biomasse er foretaget manuelt 7 dage pr uge. Biomassen er opmålt i målebæger og hældt i en tragt placeret på tilløbsventilen. Herefter åbnes ventilen således at biomassen løber ind i reaktoren. Overskydende biomasse opbevares i køleskab til næste dag.
Udtag af udrådnet biomasse er foretaget manuelt hver dag inden indfødningen. Den udtagne mængde biomasse er opmålt i målebæger og pH og temperatur er kontrolleret. En prøve på 100 ml er udtaget hver dag til analyse. Den er nedfrosset dersom den ikke direkte er taget i arbejde.
Gasmåling
Måling af gasvolumen og sammensætning af gassen samt tømning af gasklokken foretages hver dag umiddelbart efter udtag af udrådnet biomasse. Samtidig er temperaturen i gasklokkens vandbad målt ligesom lufttemperatur og tryk er aflæst således at der løbende kan foretages korrektioner af de aflæste gasmængder.
Gasvolumen
Gasvolumen er målt ved aflæsning af vandstand i gasklokkens niveaurør.
Gassammensætning
Gassens indhold af CH4 (%) og H2S (ppm) er målt på stedet med en gasmåler koblet til en gummislange på udløbsventilen.
Tømning af gasklokken
Efter udtag af udrådnet biomasse er gasklokken tømt gennem topventilen. Herefter er sket efterfyldning af vand i gasklokkens vandbad således at vandstanden står på samme sted hver dag efter tømning af gasklokken.
Kontrol af gassammensætning
Til kontrol af rutinemålingen af gassammensætningen er gasprøver lejlighedsvis udtaget og sendt til kontrolmålinger på gaskromatograf på Danmarks Tekniske Universitet.
Lækagekontrol
Lækagekontrol er udført regelmæssigt under forsøgene.
4.3.3.2 Indsamling og bearbejdning af driftsdata.
Under forsøgene blev der dagligt indsamlet og registreret følgende driftsdata:
| Tidspunkt og mængde indfødt/udtaget biomasse | |
| pH og temperatur i den udrådnede biomasse | |
| Aflæst gasmængde, metanindhold, svovlbrinteindhold, lufttryk, lufttemperatur og temperatur i gasklokken | |
| Eventuelle kommentarer om driften |
Måling af pH og temperatur er foretaget med en pH måler af typen WTW pH 330. Måleinstrumentet kalibreres 1 gang om ugen på Sjölundaverkets laboratorium.
Nøjagtigheden for instrumentet er: ±0,01 for pH-måling og ±0,1 ºC for temperaturmåling
Måling af gassammensætningen blev foretaget med en måler af typen Gasurveyor 431 Portable Gas Detector, GMI Gas Measurement Instruments Ltd. Måleområdet og nøjagtigheden for de to komponenter er:
CH4 i området 10-100% gas ± (2.0% gas + 3% af aflæsning)
H2S i området 0-200 ppm ± (2 ppm + 10% af aflæsning)
Herudover er der rutinemæssigt en gang om ugen foretaget kemiske analyser på den udrådnede biomasse for at kunne følge processen, identificere driftsproblemer og kontrollere at driftsændringer har den ønskede effekt.
Følgende parametre indgik i programmet:
| HCO3, VFA | |
| TS/VS, COD | |
| pH | |
| P-tot, N-NH4 og N-tot |
Alle parametre er analyseret på Sjölundaverkets akkrediterede laboratorium.
Endelig er der løbende foretaget beregninger og optegnet grafer til kontrol af udviklingen i:
| Metanindhold | |
| Metanproduktion pr. døgn | |
| Metanproduktion som funktion af tilført VS | |
| Akkumuleret mængde produceret metan i forhold til den akkumulerede mængde tilførte VS | |
| Nedbrydningsgrad af det organiske materiale |
4.3.3.3 Driftskorrektioner
Ved nogle opstarter og i enkelte tilfælde under fuld drift er der indtrådt driftsforstyrrelser som har krævet korrigerende indgreb i driften. Følgende driftskorrektioner har været foretaget under forsøgene.
| Ved pludselig pH-reduktion i reaktoren er indfødningen ophørt indtil pH igen er stabiliseret. | |
| Ved reduktion af alkaliniteten til et lavt niveau er der tilsat NaHCO3 | |
| Ved forhøjet ammoniumkoncentration (optrådte ved opstarten 2. gang med podemateriale fra Kalmar) blev indholdet i rådnetankene fortyndet med vand og nyt podemateriale fra rådnetanke i normal drift blev tilsat. |
Biomasse med indhold af store plaststykker viste sig i forsøgenes 2 runde at tilstoppe indfødningsventilen og at stoppe omrøringen i en reaktor. Herefter blev de store plaststykker sigtet fra i en meget grov sigte med maskevidde 25 mm se figur 4.3.3. Den frasigtede mængde udgjorde kun en meget lille del af affaldet således at det ikke forventes at have betydning for bestemmelsen af metanudbyttet målt som produceret gas i forhold til tilført VS.

Figur 4.3.3:
Plasttilbageholdelse på sigte med maskevidde 25 mm efter sigtning af 0,4 l biomasse
med højt plastindhold
Opstarten af det enkelte forsøg blev baseret på podemateriale fra et fuldskala biogasanlæg i normal drift med termofil udrådning. Det blev der tilstræbt at tilsætningen af biomasse skete med jævnt stigende belastning indtil fuld belastning var opnået.
Ved de to første forsøgsrunder blev benyttet podematerialet fra Kalmar biogasanlæg, der udrådner landbrugsaffald og slagteriaffald. Da ammoniumindholdet i dette podemateriale steg til hæmmende koncentrationer i anden forsøgsrunde blev der skiftet til podemateriale fra Vänersborgs biogasanlæg, som udrådner kildesorteret husholdningsaffald.
Podematerialet blev typisk udtaget om formiddagen og transporteret til Malmø, hvor det direkte blev indfødt i rådnetankene således at opvarmningen til termofil udrådning (55 ºC) kunne påbegyndes i løbet af eftermiddagen. Selve opstarten med den første indfødning skete så næste morgen. I et enkelt tilfælde kom podematerialet først frem om morgenen således at det stod ca. 1 døgn i rådnetanken før indfødningen startede.
Opstarten blev påbegyndt med 10 l podemateriale og med en startbelastning på 0,57 l biomasse med tørstofindhold på ca. 5% jævnt stigende til en belastning på 1,33 l biomasse ved fuld dosering. Figur 4.3.4 viser den tilsatte mængde biomasse og den organiske belastnings stigning under indkøringen. Med udgangspunkt i 10 l podemateriale ved starten blev fuld ind og udtag opnået efter 19 døgn. De første 14 dage blev der således alene tilført biomasse og ikke udtaget udrådnet materiale bortset fra at der hver dag blev udtaget 100 ml til analyse.
Den valgte strategi medførte at den organiske belastningen blev øget jævnt fra ca. 2,43 kgVS/m3, døgn i begyndelsen til 2,83 kgVS/m3, døgn.
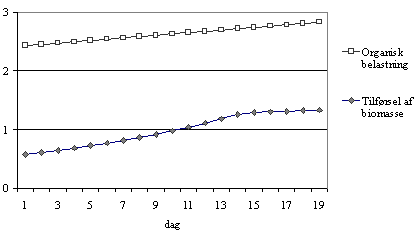
Figur 4.3.4:
Tilførsel af biomasse pr døgn (liter/døgn) og organisk belastning (kg VSind/m3,
døgn) ved opstart af udrådningsforsøgene.
4.3.5 Bestemmelse af metanudbyttet.
Efter etablering af en længere periode med stabil drift er en sammenhængende periode på 10 dage valgt til bedømmelse af metanudbyttet for hver type affald. Det bestemmes ved lineær regression af sammenhængen mellem den akkumulerede metanproduktion som funktion af den tilførte mængde organiske stof opmålt som VS, som det fremgår af figur 4.3.5, hvor sammenhængen og det beregnede metanudbytte er angivet for tre forskellige typer affald.
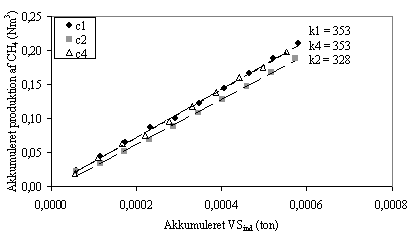
Figur 4.3.5:
Akkumuleret metanproduktion som funktion af akkumuleret tilførsel af organisk stof
målt som VS
Sammenhængen har i alle tilfælde været lineær og altid med en regressionskoefficient > 0,997.
4.3.6 Efterafgasning og karakterisering af udrådnet biomasse ved forsøgets afslutning
Efter en tilstrækkelig lang periode med stabil drift blev indfødningen af biomasse stoppet. 1,5 l udrådnet biomasse blev udtaget af reaktoren og sendt til DTU til efterudrådning i batchforsøg se afsnit 4.4.
Den resterende mængde på ca. 18,5 l blev efterudrådnet i pilotrådnetanken indtil gasproduktionen ophørte. Herefter blev rådnetanken tømt og den resterende mængde materiale blev opmålt og karakteriseret herunder blev indhold af papir, plast, grus og lign. registreret.
4.4 Rötförsök i pilot-skala: Resultat
Åsa Svärd och Jes la Cour Jansen, Avdelningen för Vattenförsörjnings- och Avloppsteknik, Lunds Tekniska Högskola.
I detta kapitel redovisas samlade data från de fyra rötomgångarna som genomförts på försöksstationen på Sjölunda reningsverk i Malmö. Datamaterialet omfattar resultat från rötrestanalyser, resultat från kontroll av metanproduktionens utveckling under ett dygn, bearbetade resultat som innefattar bl.a. nedbrytningsgrad, metanproduktion per dygn, metanproduktion per mängd tillfört organiskt material och metanutbyte, uppdelad/sorterad data och resultat från efterutrötning och analyser av färdigrötat avfall.
4.4.1.1 Resultat från veckoanalyser av rötresten
Under driften av rötkamrarna har ett prov per dygn tagits ut. Ett prov per vecka har analyserats för följande parametrar:
| HCO3, VFA | |
| TS/VS, COD | |
| P-tot, NH4-N och N-tot |
Vätekarbonathalten och andelen flyktiga fettsyror kan användas för att beräkna bikarbonatalkaliteten (BA). BA-halten för respektive avfallstyp från uppstart till och med fulldriftsperioden visas i figur 4.4.1 nedan.


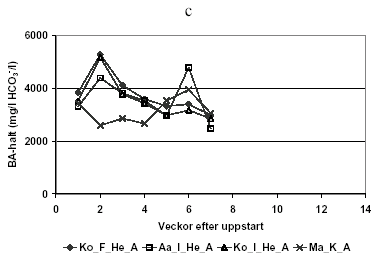

Figur 4.4.1:
BA-halten i rötresten för varje avfallstyp rötad under respektive rötomgång a-d
För vissa avfallstyper har BA-halten sjunkit till värden ner mot 1000, speciellt i uppstartsperioden. BA-halten har därför i vissa fall höjts genom att tillsätta doser av natriumvätekarbonat (NaHCO3).
Ett mått på andelen flyktiga fettsyror (VFA) under belastningsperioden (uppstart och fulldrift) har erhållits genom att analysera halten av acetat i rötresten.
Acetathalten visas i figur 4.4.2.


Figur 4.4.2:
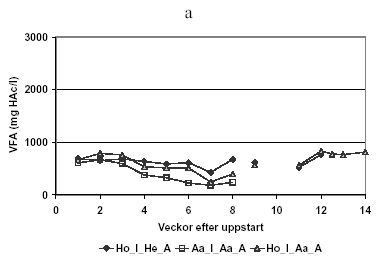
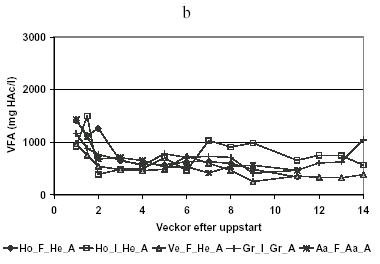
VFA-halten (som acetat) i rötresten för varje avfallstyp rötad under rötomgång
a-d
Under omgång b och c var acetathalten initialt högre (1000-2000 mg/l) i samband med uppstarten men stabiliserade sig vid ett lägre värde för de flesta avfall. För Ma_K_A (kökskvarnsavfall i Malmö) stabiliserade sig acetathalten inte, varken under rötomgång c eller d.
Som ett mått på hur mycket organiskt material som bryts ned under rötningen har VS-halten (volatile solids) och COD-halten analyserats varje vecka från uppstart fram till inmatningsstopp. Eftersom rötrestmaterialet sedimenterar ganska snabbt har det varit svårt att ta ut representativa prover. VS-halten visas i figur 4.4.3 och COD-halten visas i figur 4.4.4.

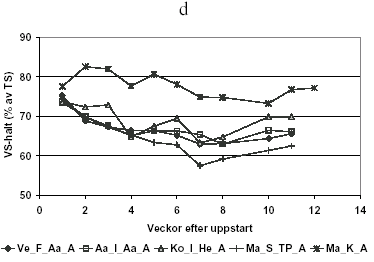
Figur 4.4.3:
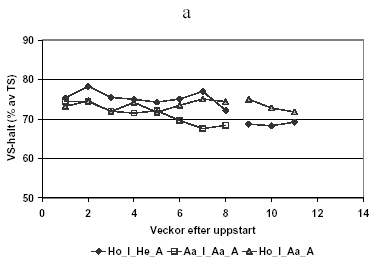
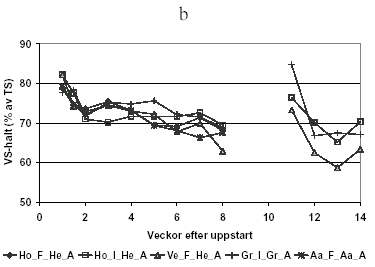
VS-halten (som % av TS) i rötresten för varje avfallstyp rötad under rötomgång
a-d
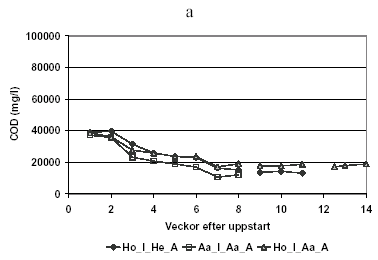


Figur 4.4.4:
COD-halten i rötresten för varje avfallstyp rötad under rötomgång a-d
VS-halten har i de flesta fall minskat från runt 80 % (av TS) till runt 65 % (av TS). Det organiska innehållet vid rötning av Ma_K_A har emellertid inte brutits ned särkilt väl och VS-innehållet ligger därför högt under bägge testperioderna c och d. De tillfälligt höga värdena på VS-halten under vecka 11 i rötomgång b förklaras förmodligen av att uttag/analys av rötrestprov gjorts på felaktigt sätt.
Även COD-halten verkar överlag minska, med vissa undantag. Variationerna i COD-halten är i vissa fall stora på prover uttagna med bara en veckas intervall, framförallt under rötomgång c och d, vilket gör att COD-halterna inte använts för några vidare driftskontroller.
Näringsinnehållet i rötkamrarna har analyserats som totalfosfor, ammoniumkväve och totalkväve.
Totalfosforhalten visas i figur 4.4.5.


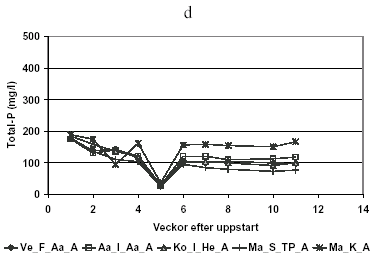
Figur 4.4.5:
Totalfosfor i rötresten för varje avfallstyp rötad under rötomgång a-d
Ammoniumkväve visas i figur 4.4.6.

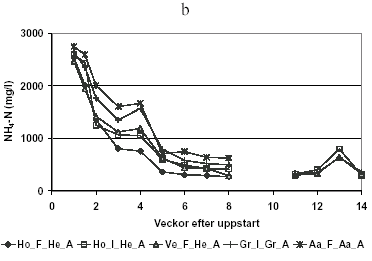
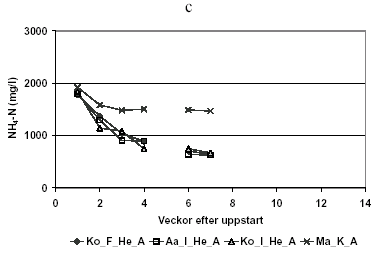
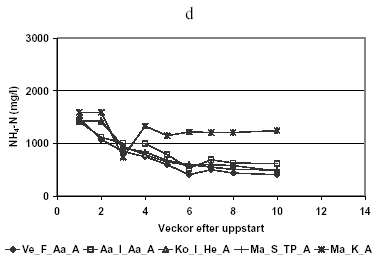
Figur 4.4.6:
Ammoniumkväve (NH4-N) i rötresten för varje avfallstyp rötad under
rötomgång a-d
Ammoniumhalten startar vid ett högre värde, runt 2000 mg/l men stabiliserar sig i de flesta fall runt 500 mg/l, efter att fulldrift uppnåtts. Förklaringen till detta är att ympen innehåller mer ammonium än inmatat avfall. När ympen byts ut mot avfallet minskar ammoniumhalten för alla avfallstyper utom Ma_K_A. Vid rötningen av Ma_K_A stoppades inmatningen vid flera tillfällen får återhämtning och när avfall matades in var det oftast en mindre mängd som tillfördes än i övriga rötkamrar därför byttes aldrig ympen ut i lika stor utsträckning, vilket förklarar en högre ammoniumhalt under hela testperioden i omgång c och d.
Den höga ammoniumhalten (nästan 3000 mg/l) i omgång b kan förklaras av ett högre ammoniuminnehåll i ympmaterialet (pga. att högre andel slaktavfall än tidigare rötades).
Den höga ammoniumhalten gav problem och en mer utdragen uppstartsperiod. I de två sista omgångarna användes istället ymp från Vänersborg.
Totalkvävehalten visas i figur 4.4.7.
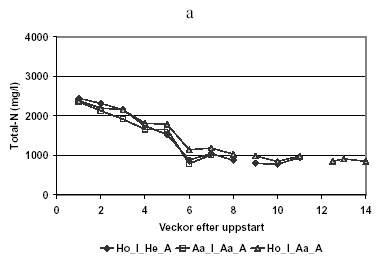
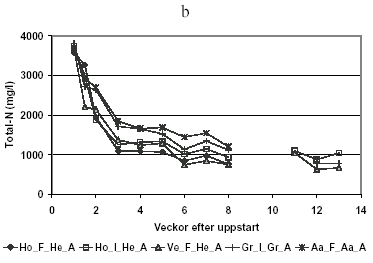
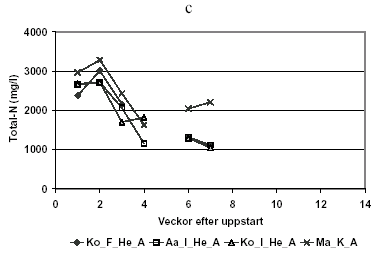

Figur 4.4.7:
Totalkvävehalten (N-tot) i rötresten för varje avfallstyp rötad under rötomgång
a-d
Även här syns ett högre kväveinnehåll initialt i omgång b, pga. den kväverika ympen.
4.4.1.2 Resultat från dagliga analyser av rötresten
Temperatur och pH har mätts på de dagligen uttagna rötrestproverna för kontroll av driften.
pH-värde för varje dag under hela driftperioden, från uppstart till och med efterutrötning, visas i figur 4.4.8.
pH-värdet har tenderat att minska under uppstarten för att stabilisera sig runt 7. Vid slutet av testperioden, vid stoppad inmatning och efterutrötning, har pH stigit åter. Vid plötsliga pH-minskningar har natriumvätekarbonat tillsatts för att höja alkaliteten.
Temperaturen i rötkamrarna har varit inställd på 55 ºC vilket kontrollerats genom temperaturmätning av rötresten varje dag. Uppmätt temperatur under hela testperioden visas i figur 4.4.9.
Temperaturen har som synes varierat lite grann kring 55 ºC. Dessa variationer har emellertid inte medfört någon driftstörning. Den låga temperatur som uppmättes i mitten av juli i första rötomgången (Ho_I_Aa_A) orsakades av att ett överhettningsskydd löste ut två dagar i rad vilket stängde av uppvärmningen.
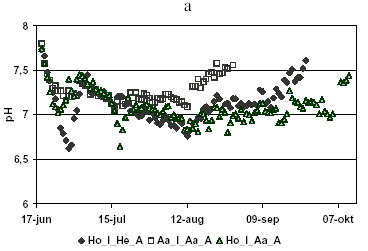
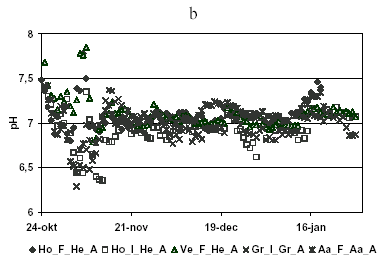
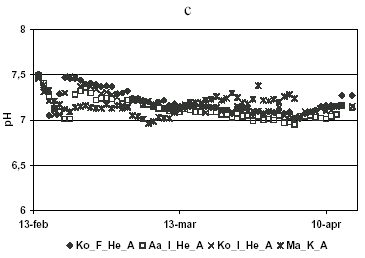

Figur 4.4.8:
pH i rötresten för varje avfallstyp rötad under rötomgång a-d. Ett värde per
dygn.


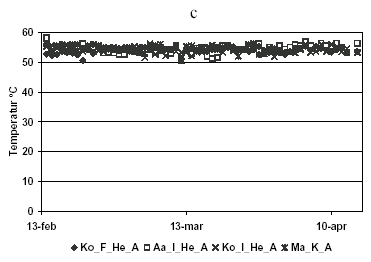

Figur 4.4.9:
Rötrestens temperatur för varje avfallstyp rötad under rötomgång a-d. Ett värde
per dygn.
4.4.1.3 Kontroll av metanutvecklingen under ett dygn
under rötomgång b-d har gasproduktionen avlästs flera gånger under samma dygn för att kontrollera hur långt efter inmatningen som metanproduktionen kommer igång och om den avtar eller faktiskt avstannar efter en viss tid.
Den samlade metanproduktionen under ett dygn visas i figur 4.4.10.
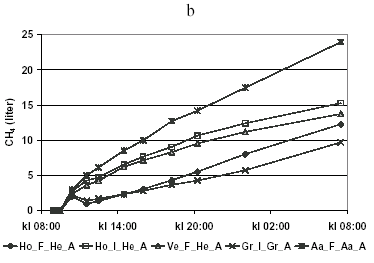

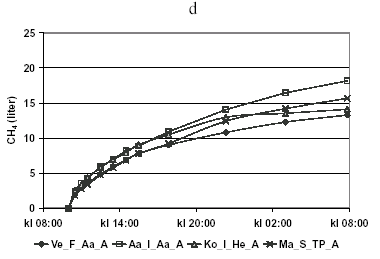
Figur 4.4.10:
Kontroll av metanproduktionen under ett dygn. Totalt bildad metanmängd vid olika
tidpunkter för varje avfallstyp rötad under rötomgång b-d. Under första rötomgången
(a) gjordes ej denna kontroll.
Metangasen produceras snabbast precis i början av mätningarna (strax efter inmatning) därefter är den ganska jämn ett tag för att plana ut under slutet av mätperioden. Metanproduktionen stannar aldrig av helt.
I omgång b blev inmatningsventilerna för två av rötkamrarna (Ho_F_He_A och Gr_I_Gr_A) utbytta samma dag som mätningarna gjordes. Bytet gjordes någon timme efter inmatning vilket kan förklara att dessa avfalls metanutveckling inte följer de övriga.
4.4.1.4 Bearbetade data
Utifrån dagliga mätningar och analyser gjorda en gång per vecka har ett antal parametrar beräknats. Dessa har använts för kontroll av driften och för att slutligen utvärdera respektive avfallstyps metanutbyte. Följande parametrar kommer att visas i detta avsnitt:
| Metaninnehåll | |
| Metanproduktion per dygn | |
| Nedbrytningsgrad | |
| Metanproduktion per tillförd mängd organiskt material för varje dygn | |
| Ackumulerad mängd producerad metan mot ackumulerad mängd tillfört organiskt material (VS) under en utvald stabil period (tio dygn) |
Figur 4.4.11 visar metaninnehållet i producerad gas från respektive avfallstyp under hela testperioden (från uppstart till och med efterutrötning).
Figur 4.4.12 visar den dagliga metanproduktionen uttryckt i normalkubikmeter (dvs. uppmätta värden är omräknade till normaltryck, 1 atm och normaltemperatur, 0 ºC).


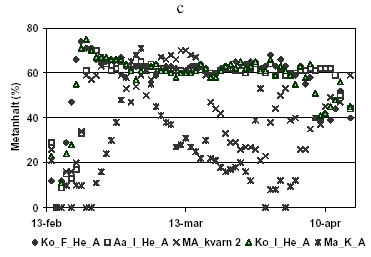
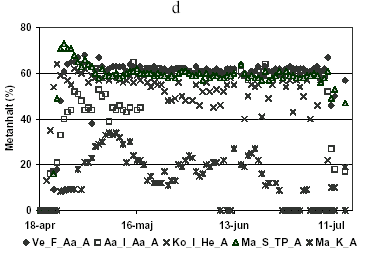
Figur 4.4.11:
Metanhalt i dagligen producerad biogas
Metanhalten har vid fulldrift legat runt 65 % med undantag för driftstörningar. Vid stoppad inmatning syns en tydlig minskning av metanhalten. Vid rötning av avfallstypen Ma_K_A i omgångarna c och d stabiliserar sig dock aldrig metanhalten.
Den låga metanhalten för Ho_I_Aa_A i mitten av juli under omgång a sammanfaller med att värmningen stängdes av pga. utlöst överhettningsskydd. Metanproduktionen per dygn var också låg under denna period men hämtar sig efter ett par veckor.
Metanproduktionen per dygn stiger gradvis under uppstartsperioden, stabiliserar sig under en period och faller relativt snabbt efter stoppad inmatning.
Den plötsliga stigningen för Ho_I_He_A i omgång a förklaras av att en läcka tätades i början av augusti. Samma fenomen syns tydligt för Aa_I_Aa_A i rötomgång d där en läcka hittades i mitten av maj.


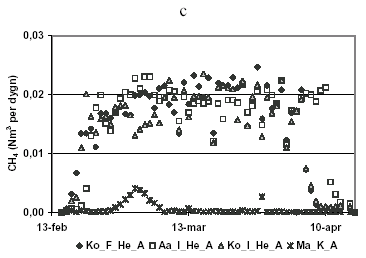

Figur 4.4.12:
Metanproduktion per dygn (Nm3 CH4 per dygn)
Nedbrytningsgrad har beräknats utifrån gjorda analyser av VS-innehållet i rötresten och ger ett mått på hur mycket av det organiska material som tillförts rötkammaren som brutits ned.
Nedbrytningsgraden visas i figur 4.4.13.
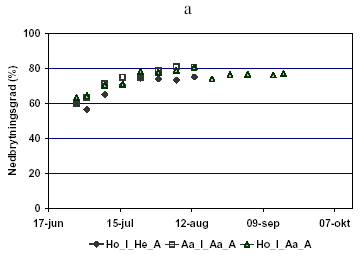
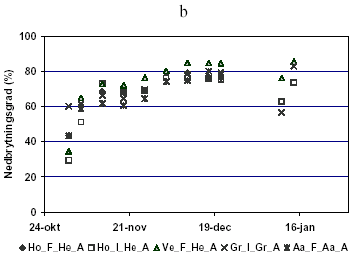

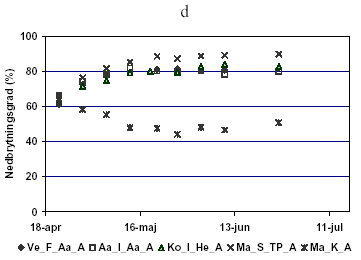
Figur 4.4.13:
Nedbrytningsgrad för varje avfallstyp rötad under rötomgång a-d.
Nedbrytningsgraden stabiliserar sig kring 80 % för alla avfall som uppnår stabil drift. För Ma_K_A som ej uppnår stabil drift är nedbrytningsgraden låg.
I tabel 4.4.1 visas den dagliga metanproduktionen per inmatad VS under den "stabila" driftperioden. Med "stabil" avses här en period som börjar någon eller några veckor efter att full inmatning påbörjats (då någorlunda "normala" värden uppmätts och ympens påverkan är väsentligt reducerad) och som slutar när inmatningen stoppas och efterutrötningen påbörjas. Inom en "stabil" driftperiod kan tillfälliga driftstörningar ha skett som t.ex. motorhaverier, läckage, uppvärmningsproblem, vilket förklarar en del låga värden i tabellen. Den utvalda 10 dygnsperioden för utvärdering har inte inkluderat någon period med någon sådan driftstörning.
Variationer i metanproduktionen beror delvis på att avläst gasproduktion och inmatning av nytt avfall inte skett på exakt samma tidpunkt varje dag. Speciellt förekommer sådana avvikelser under helger.
För Ma_K_A finns det inga resultat eftersom försöksrötningarna av detta avfall (i omgång c och d) aldrig uppnådde stabil drift.
Tabel 4.4.1.
Metanproduktion i Nm3 per ton VSin och dygn för den stabila
driftperioden. (Gråmarkerade fält anger den utvärderade 10-dygnsperioden).
Figur 4.4.14 visar den ackumulerade metanproduktionen som funktion av den ackumulerade mängden organiskt material som tillförts under de utvalda 10-dygnsperioderna. Till datapunkterna har anpassats en linjär regressionslinje för varje avfallstyp. Lutningen på respektive regressionslinje ger metanutbytet som Nm3 metan per kg VSin.

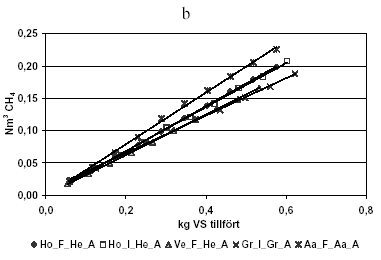
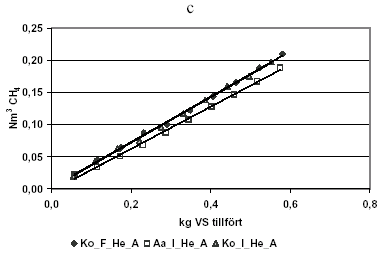
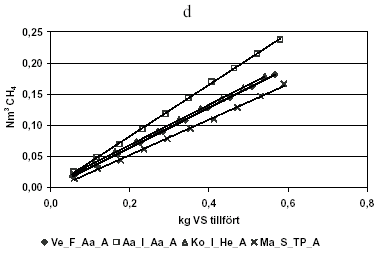
Figur 4.4.14:
Ackumulerad metanproduktion som funktion av ackumulerad mängd tillförd VS
under de utvalda 10-dygnsperioderna
Ma_K_A utgår i omgång c och d eftersom stabil fulldrift aldrig uppnåddes.
Anpassningen av linjerna till punkterna är god för alla avfallstyperna. Alla linjer har ett R2-värde över 0,997, dvs. nästan 1.
I detta avsnitt har de beräknade metanutbytena använts för att jämföra olika parametrar som skiljer avfallen åt.
I tabel 4.4.2 visas alla metanutbyten som uppmätts under testomgångarna. Avfallens ursprung och förbehandlingsmetod presenteras.
Tabel 4.4.2.
Metanutbyte som Nm3 CH4 per ton VSin (organiskt
innehåll) för respektive förbehandlingsmetod. De avfallstyper som ej kunnat utvärderas
eftersom ej stabil drift uppnåtts markeras med streck.
|
|
Skivsikt |
Skruv- |
Shredder + |
Kökskvarnar |
Kolv- |
011003 |
Gr_Gr_A |
|
|
289 |
|
|
010514 |
Ho_I_He_A |
347 |
|
|
|
|
011001 |
Ho_I_He_A |
340 |
|
|
|
|
011001 |
Ho_F_He_A |
349 |
|
|
|
|
010521 |
Ho_I_Aa_A |
|
275 |
|
|
|
020116 |
Ko_I_He_A |
353 |
|
|
|
|
020321 |
Ko_I_He_A |
322 |
|
|
|
|
020116 |
Ko_F_He_A |
353 |
|
|
|
|
011001 |
Ve_F_He_A |
311 |
|
|
|
|
020408 |
Ve_F_Aa_A |
|
319 |
|
|
|
020116 |
Aa_I_He_A |
328 |
|
|
|
|
010521 |
Aa_ I_ Aa_ A |
|
367 |
|
|
|
020408 |
Aa_I_Aa_A |
|
410 |
|
|
|
010927 |
Aa_F_Aa_A |
|
400 |
|
|
|
020201 |
Ma_K_A |
|
|
|
- |
|
020417 |
Ma_K_A |
|
|
|
- |
|
020416 |
Ma_S_TP_A |
|
|
|
|
284 |
I tabel 4.4.3 visas medelvärden (och standardavvikelser) för metanutbyten av avfall med
samma karaktär i fråga om förbehandlingsmetod, ursprung, köksemballage och säcktyp.
Tabel 4.4.3.
Beräknade medelvärden av metanutbyten (Nm3 CH4 per ton inmatad
VS) tillsammans med standardavvikelse och antal testade avfall av respektive typ (n) för
jämförelse av olika förbehandlingsmetod, ursprung, köksemballage, säcktyp.
Medelvärden för avfall teströtade med respektive ymp och avfall i respektive
rötomgång har också tagits med
|
Metanutbyte |
Standard- avvikelse |
n
|
Förbehandling |
|
|
|
Skruvseparator |
354 |
57 |
5 |
Skivsikt |
338 |
16 |
8 |
Ursprung |
|
|
|
Individuella avfallskärl |
337 |
40 |
9 |
Gemensamma avfallskärl |
336 |
40 |
6 |
Emballage i köket |
|
|
|
Plast |
351 |
36 |
9 |
Papper |
314 |
35 |
6 |
Säcktyp |
|
|
|
Papper |
329 |
31 |
4 |
Ingen |
339 |
43 |
11 |
Ymp |
|
|
|
Kalmar |
335 |
41 |
8 |
Vänersborg |
338 |
39 |
7 |
Rötomgång |
|
|
|
1 |
330 |
48 |
3 |
2 |
338 |
42 |
5 |
3 |
345 |
14 |
3 |
4 |
323 |
58 |
4 |
De största skillnaderna hittas i jämförelse mellan förbehandlingstyperna
skruvseparator och skivsikt och i jämförelse mellan plast och papper som emballage i
köket. Skillnaden mellan plast och papper som emballage har visat sig statistiskt
signifikant vid tvåsidigt t-test på en 90 % nivå, men skillnaden mellan
förbehandlingstyperna är inte statistiskt signifikant.
I tabel 4.4.4 och tabel 4.4.5 visas resultat av de analyser och mätningar som gjorts på rötresten efter att inmatningen stoppats i respektive rötomgång.
Restmetanutbyte har mätts på en del av rötresten genom batchförsök på DTU samtidigt som återstående rötrest efterutrötats i pilotrötkamrarna på Sjölunda.
Tabel 4.4.4.
Restmetanutbyte mätt dels på DTU och dels på Sjölunda samt analysresultat av DLGs
analyser av rötrest uttagen första dagen efter inmatningsstopp.
Avfallstyp
|
Restme- tanutbyte |
Restmetan |
Råfett |
Rå- pro- tein |
Ved- ämne |
Aska |
EFOS |
Stärk- else |
Socker |
Ho_I_He_A |
38 |
70 |
6 |
27 |
15 |
28 |
47 |
|
|
Aa_I_ Aa_A |
48 |
27 |
8 |
22 |
19 |
30 |
36 |
0,2 |
|
Ho_I_Aa_A |
48 |
75 * |
|
|
|
|
|
|
|
Ho_F_He_A |
25 |
47 |
|
|
|
|
|
|
|
Ho_I_He_A |
53 |
25 * |
5 |
24 |
16 |
30 |
46 |
0,3 |
0,8 |
Ve_F_He_A |
35 |
31 |
5 |
21 |
16 |
38 |
40 |
0,7 |
0,3 |
Gr_I_Gr_A |
72 |
4 * |
7 |
23 |
16 |
32 |
50 |
0,9 |
|
Aa_F_Aa_A |
35 |
39 |
|
|
|
|
|
|
|
Ko_F_He_A |
42 |
20 |
7 |
22 |
8 |
38 |
51 |
0,4 |
0,1 |
Aa_I_He_A |
- |
13 |
|
|
|
|
|
|
|
Ko_I_He_A |
43 |
14 |
6 |
22 |
19 |
27 |
39 |
0,3 |
0,3 |
Ma_K_A |
166 |
30 |
7 |
21 |
13 |
34 |
39 |
9,9 |
0,0 |
Ve_F_Aa_A |
35 |
13 |
5 |
22 |
14 |
31 |
48 |
0,3 |
0,0 |
Aa_I_Aa_A |
44 |
5 |
4 |
20 |
9 |
39 |
57 |
0,4 |
0,3 |
Ko_I_He_A |
37 |
27 |
|
|
|
|
|
|
|
Ma_S_TP_A |
35 |
6 |
7 |
20 |
13 |
35 |
50 |
0,3 |
0,0 |
Ma_K_A |
13 |
0 |
6 |
18 |
16 |
35 |
44 |
0,3 |
0,2 |
* Efterutrötningen stoppades medan rötresten fortfarande gav en del gas, dvs värdet får anses som minimumvärde
Tabel 4.4.5.
Resultat av ALcontrols analyser av rötrest uttagen första dagen efter
inmatningsstopp. Endast sex av 17 avfall har analyserats pga. för liten torr mängd i
uttaget prov.
Avfallstyp
|
Glöd- |
VS |
K |
Tot P |
Tot N |
Kol |
Väte |
Tot S |
Värme- värde |
Cl |
Ho_I_He_A |
31 |
69 |
2,9 |
0,7 |
4,9 |
43 |
6,1 |
0,4 |
18 |
1,7 |
Gr_I_Gr_A |
34 |
66 |
3,4 |
1,3 |
4,0 |
44 |
6,1 |
0,5 |
16 |
1,6 |
Ve_F_Aa_A |
32 |
69 |
4,5 |
0,8 |
3,3 |
39 |
5,1 |
0,5 |
17 |
3,1 |
Aa_I_Aa_A |
40 |
60 |
4,9 |
1,0 |
2,8 |
32 |
4,3 |
0,6 |
15 |
4,3 |
Ma_S_TP_A |
36 |
64 |
3,9 |
0,9 |
3,1 |
36 |
4,7 |
0,6 |
16 |
3,7 |
Ma_K_A |
35 |
65 |
2,8 |
0,8 |
2,7 |
36 |
4,9 |
0,5 |
16 |
2,8 |