|
| Forside | | Indhold | | Tilbage | | Udskriftsvejledning |
Værditab ved salg af forurenede eller tidligere forurenede ejendomme med helårsbeboelse
Bilag C
GET
FILE='W:\sag\1243\Data\Databearbejdning\SPSS\Dataset\Hyp1.sav'.
*Define Variable Properties.
*DEPOTSTATUS.
VARIABLE LABELS DEPOTSTATUS 'Depotstatus'.
VALUE LABELS DEPOTSTATUS
1 'Mistanke'
2 'Forurenet'
3 'Oprenset'
4 'Restforurening'
5 'Undersřgt uden fund'
6 'Ikke forurenet' .
*OMRAADE.
VALUE LABELS OMRAADE
1 'Křbenhavn og omegn'
2 'Řv. Sjćlland og Fyn'
3 'Jylland' .
*lnRH.
VARIABLE LABELS lnRH 'ln (relativ handelspris)'.
FORMATS lnRH (F8.2).
EXECUTE.
SAVE OUTFILE='W:\sag\1243\Data\Databearbejdning\SPSS\Dataset\hyp1.sav'
/COMPRESSED.
GET
FILE='W:\sag\1243\Data\Databearbejdning\SPSS\Dataset\Hyp1.sav'.
USE ALL.
SUMMARIZE
/TABLES=LnRH BY DEPOTSTATUS
/FORMAT=NOLIST TOTAL
/TITLE='Alle observationer'
/MISSING=VARIABLE
/CELLS=COUNT MEAN MEDIAN MIN MAX STDDEV KURT SKEW .
Summarize
Notes
| Output Created |
23-AUG-2005 13:35:10 |
|---|
| Comments |
|
|---|
| Input |
Data |
W:\sag\1243\Data\Databearbejdning\SPSS\Dataset\Hyp1.sav |
|---|
| Filter |
<none> |
|---|
| Weight |
<none> |
|---|
| Split File |
<none> |
|---|
| N of Rows in Working Data File |
605407 |
|---|
| Missing Value Handling |
Definition of Missing |
For each dependent variable in a table, user-defined missing values for the dependent and all grouping variables are treated as missing. |
|---|
| Cases Used |
Cases used for each table have no missing values in any independent variable, and not all dependent variables have missing values. |
|---|
| Syntax |
SUMMARIZE
/TABLES=LnRH BY DEPOTSTATUS
/FORMAT=NOLIST TOTAL
/TITLE='Alle observationer'
/MISSING=VARIABLE
/CELLS=COUNT MEAN MEDIAN MIN MAX STDDEV KURT SKEW .
|
|---|
| Resources |
Elapsed Time |
0:00:12,05 |
|---|
Case Processing Summary
|
Cases |
|---|
| Included |
Excluded |
Total |
|---|
| N |
Percent |
N |
Percent |
N |
Percent |
|---|
| ln (relativ handelspris) * Depotstatus |
605407 |
100,0% |
0 |
,0% |
605407 |
100,0% |
|---|
Alle observationer
ln (relativ handelspris)
| Depotstatus |
N |
Mean |
Median |
Minimum |
Maximum |
Std. Deviation |
Kurtosis |
Skewness |
|---|
| Mistanke |
2600 |
,1191 |
,1276 |
-11,51 |
3,50 |
,46618 |
159,302 |
-6,941 |
|---|
| Forurenet |
2727 |
,1916 |
,1647 |
-4,28 |
3,86 |
,42012 |
18,490 |
,104 |
|---|
| Oprenset |
730 |
,1589 |
,1596 |
-5,14 |
2,82 |
,48870 |
32,532 |
-2,878 |
|---|
| Restforurening |
601 |
,1138 |
,1001 |
-6,49 |
3,62 |
,52662 |
55,603 |
-4,101 |
|---|
| Undersřgt uden fund |
267 |
,0985 |
,0861 |
-2,77 |
2,05 |
,36894 |
29,770 |
-2,981 |
|---|
| Ikke forurenet |
598482 |
,1410 |
,1476 |
-15,98 |
5,98 |
,34408 |
131,593 |
-4,955 |
|---|
| Total |
605407 |
,1411 |
,1475 |
-15,98 |
5,98 |
,34554 |
130,851 |
-4,934 |
|---|
SUMMARIZE
  /TABLES=LnRH  BY OMRAADE
  /FORMAT=NOLIST TOTAL
  /TITLE='Alle observationer'
  /MISSING=VARIABLE
  /CELLS=COUNT MEAN MEDIAN MIN MAX STDDEV KURT SKEW .
Summarize
Notes
| Output Created |
23-AUG-2005 13:35:22 |
|---|
| Comments |
|
|---|
| Input |
Data |
W:\sag\1243\Data\Databearbejdning\SPSS\Dataset\Hyp1.sav |
|---|
| Filter |
<none> |
|---|
| Weight |
<none> |
|---|
| Split File |
<none> |
|---|
| N of Rows in Working Data File |
605407 |
|---|
| Missing Value Handling |
Definition of Missing |
For each dependent variable in a table, user-defined missing values for the dependent and all grouping variables are treated as missing. |
|---|
| Cases Used |
Cases used for each table have no missing values in any independent variable, and not all dependent variables have missing values. |
|---|
| Syntax |
SUMMARIZE
/TABLES=LnRH BY OMRAADE
/FORMAT=NOLIST TOTAL
/TITLE='Alle observationer'
/MISSING=VARIABLE
/CELLS=COUNT MEAN MEDIAN MIN MAX STDDEV KURT SKEW .
|
|---|
| Resources |
Elapsed Time |
0:00:11,47 |
|---|
Case Processing Summary
|
Cases |
|---|
| Included |
Excluded |
Total |
|---|
| N |
Percent |
N |
Percent |
N |
Percent |
|---|
| ln (relativ handelspris) * OMRAADE |
605407 |
100,0% |
0 |
,0% |
605407 |
100,0% |
|---|
Alle observationer
ln (relativ handelspris)
| OMRAADE |
N |
Mean |
Median |
Minimum |
Maximum |
Std. Deviation |
Kurtosis |
Skewness |
|---|
| Křbenhavn og omegn |
199195 |
,2026 |
,1859 |
-15,42 |
5,98 |
,30457 |
153,439 |
-3,984 |
|---|
| Řv. Sjćlland og Fyn |
131530 |
,1125 |
,1324 |
-13,73 |
5,39 |
,36831 |
120,930 |
-5,232 |
|---|
| Jylland |
274682 |
,1103 |
,1233 |
-15,98 |
5,47 |
,35617 |
128,214 |
-5,248 |
|---|
| Total |
605407 |
,1411 |
,1475 |
-15,98 |
5,98 |
,34554 |
130,851 |
-4,934 |
|---|
SUMMARIZE
  /TABLES=LnRH  BY DEPOTSTATUS BY OMRAADE
  /FORMAT=NOLIST TOTAL
  /TITLE='Alle observationer'
  /MISSING=VARIABLE
  /CELLS=COUNT MEAN MEDIAN MIN MAX STDDEV KURT SKEW .
Summarize
Notes
| Output Created |
23-AUG-2005 13:35:34 |
|---|
| Comments |
|
|---|
| Input |
Data |
W:\sag\1243\Data\Databearbejdning\SPSS\Dataset\Hyp1.sav |
|---|
| Filter |
<none> |
|---|
| Weight |
<none> |
|---|
| Split File |
<none> |
|---|
| N of Rows in Working Data File |
605407 |
|---|
| Missing Value Handling |
Definition of Missing |
For each dependent variable in a table, user-defined missing values for the dependent and all grouping variables are treated as missing. |
|---|
| Cases Used |
Cases used for each table have no missing values in any independent variable, and not all dependent variables have missing values. |
|---|
| Syntax |
SUMMARIZE
/TABLES=LnRH BY DEPOTSTATUS BY OMRAADE
/FORMAT=NOLIST TOTAL
/TITLE='Alle observationer'
/MISSING=VARIABLE
/CELLS=COUNT MEAN MEDIAN MIN MAX STDDEV KURT SKEW .
|
|---|
| Resources |
Elapsed Time |
0:00:27,56 |
|---|
Case Processing Summary
|
Cases |
|---|
| Included |
Excluded |
Total |
|---|
| N |
Percent |
N |
Percent |
N |
Percent |
|---|
| ln (relativ handelspris) * Depotstatus * OMRAADE |
605407 |
100,0% |
0 |
,0% |
605407 |
100,0% |
|---|
Alle observationer
ln (relativ handelspris)
| Depotstatus |
OMRAADE |
N |
Mean |
Median |
Minimum |
Maximum |
Std. Deviation |
Kurtosis |
Skewness |
|---|
| Mistanke |
Křbenhavn og omegn |
1139 |
,2198 |
,1826 |
-2,62 |
2,01 |
,33419 |
12,407 |
-,735 |
|---|
| Řv. Sjćlland og Fyn |
593 |
,0434 |
,0766 |
-2,07 |
3,38 |
,38036 |
13,985 |
-,104 |
|---|
| Jylland |
868 |
,0387 |
,0633 |
-11,51 |
3,50 |
,61837 |
146,973 |
-8,464 |
|---|
| Total |
2600 |
,1191 |
,1276 |
-11,51 |
3,50 |
,46618 |
159,302 |
-6,941 |
|---|
| Forurenet |
Křbenhavn og omegn |
1917 |
,2123 |
,1813 |
-3,33 |
3,12 |
,32088 |
17,732 |
,273 |
|---|
| Řv. Sjćlland og Fyn |
421 |
,2251 |
,1350 |
-4,28 |
3,86 |
,66058 |
10,146 |
,422 |
|---|
| Jylland |
389 |
,0535 |
,0457 |
-3,16 |
2,66 |
,48663 |
11,971 |
-,868 |
|---|
| Total |
2727 |
,1916 |
,1647 |
-4,28 |
3,86 |
,42012 |
18,490 |
,104 |
|---|
| Oprenset |
Křbenhavn og omegn |
323 |
,2444 |
,2094 |
-1,49 |
2,32 |
,30592 |
11,113 |
,532 |
|---|
| Řv. Sjćlland og Fyn |
118 |
,0612 |
,0875 |
-2,79 |
,95 |
,43300 |
15,837 |
-2,678 |
|---|
| Jylland |
289 |
,1032 |
,0964 |
-5,14 |
2,82 |
,63915 |
24,390 |
-2,755 |
|---|
| Total |
730 |
,1589 |
,1596 |
-5,14 |
2,82 |
,48870 |
32,532 |
-2,878 |
|---|
| Restforurening |
Křbenhavn og omegn |
341 |
,1264 |
,1068 |
-6,49 |
2,28 |
,50541 |
93,064 |
-7,136 |
|---|
| Řv. Sjćlland og Fyn |
69 |
,1019 |
,1012 |
-2,64 |
3,62 |
,71056 |
12,931 |
,253 |
|---|
| Jylland |
191 |
,0957 |
,0800 |
-3,17 |
3,09 |
,48715 |
29,807 |
-2,409 |
|---|
| Total |
601 |
,1138 |
,1001 |
-6,49 |
3,62 |
,52662 |
55,603 |
-4,101 |
|---|
| Undersřgt uden fund |
Křbenhavn og omegn |
71 |
,1924 |
,1144 |
-,13 |
,95 |
,24789 |
1,633 |
1,550 |
|---|
| Řv. Sjćlland og Fyn |
71 |
,1023 |
,0524 |
-,78 |
,88 |
,22850 |
4,114 |
,147 |
|---|
| Jylland |
125 |
,0430 |
,0786 |
-2,77 |
2,05 |
,46868 |
22,513 |
-3,025 |
|---|
| Total |
267 |
,0985 |
,0861 |
-2,77 |
2,05 |
,36894 |
29,770 |
-2,981 |
|---|
| Ikke forurenet |
Křbenhavn og omegn |
195404 |
,2024 |
,1861 |
-15,42 |
5,98 |
,30375 |
156,464 |
-4,034 |
|---|
| Řv. Sjćlland og Fyn |
130258 |
,1125 |
,1328 |
-13,73 |
5,39 |
,36659 |
123,818 |
-5,368 |
|---|
| Jylland |
272820 |
,1107 |
,1236 |
-15,98 |
5,47 |
,35419 |
127,097 |
-5,197 |
|---|
| Total |
598482 |
,1410 |
,1476 |
-15,98 |
5,98 |
,34408 |
131,593 |
-4,955 |
|---|
| Total |
Křbenhavn og omegn |
199195 |
,2026 |
,1859 |
-15,42 |
5,98 |
,30457 |
153,439 |
-3,984 |
|---|
| Řv. Sjćlland og Fyn |
131530 |
,1125 |
,1324 |
-13,73 |
5,39 |
,36831 |
120,930 |
-5,232 |
|---|
| Jylland |
274682 |
,1103 |
,1233 |
-15,98 |
5,47 |
,35617 |
128,214 |
-5,248 |
|---|
| Total |
605407 |
,1411 |
,1475 |
-15,98 |
5,98 |
,34554 |
130,851 |
-4,934 |
|---|
EXAMINE
  VARIABLES=LnRH BY DEPOTSTATUS
  /PLOT BOXPLOT STEMLEAF
  /COMPARE GROUP
  /PERCENTILES(5,10,25,50,75,90,95) HAVERAGE
  /STATISTICS DESCRIPTIVES
  /CINTERVAL 95
  /MISSING LISTWISE
  /NOTOTAL.
Explore
Notes
| Output Created |
23-AUG-2005 13:36:01 |
|---|
| Comments |
|
|---|
| Input |
Data |
W:\sag\1243\Data\Databearbejdning\SPSS\Dataset\Hyp1.sav |
|---|
| Filter |
<none> |
|---|
| Weight |
<none> |
|---|
| Split File |
<none> |
|---|
| N of Rows in Working Data File |
605407 |
|---|
| Missing Value Handling |
Definition of Missing |
User-defined missing values for dependent variables are treated as missing. |
|---|
| Cases Used |
Statistics are based on cases with no missing values for any dependent variable or factor used. |
|---|
| Syntax |
EXAMINE
VARIABLES=LnRH BY DEPOTSTATUS
/PLOT BOXPLOT STEMLEAF
/COMPARE GROUP
/PERCENTILES(5,10,25,50,75,90,95) HAVERAGE
/STATISTICS DESCRIPTIVES
/CINTERVAL 95
/MISSING LISTWISE
/NOTOTAL.
|
|---|
| Resources |
Elapsed Time |
0:01:26,74 |
|---|
Depotstatus
ln (relativ handelspris)
Stem-and-Leaf Plots
ln (relativ handelspris) Stem-and-Leaf Plot for
DEPOTSTATUS= Mistanke

 Frequency    Stem &  Leaf

   110,00 Extremes    (=<-,47)
     7,00       -4 .  5&
    23,00       -4 .  024&
    13,00       -3 .  7&
    26,00       -3 .  0123&
    46,00       -2 .  55667889
    49,00       -2 .  0112344
    48,00       -1 .  56677889
    99,00       -1 .  000111122233344
   133,00       -0 .  555566667777778888899
   150,00       -0 .  0000111111222233333444444
   247,00        0 .  00000000000000111111111222223333334444444
   223,00        0 .  555555556666666677777788888888999999
   246,00        1 .  0000000001111111222222333333333444444444
   192,00        1 .  55555666666677777778888889999999
   221,00        2 .  0000000001111112222222333333333444444
   160,00        2 .  555555556666777777888899999
   137,00        3 .  00000011111122233334444
    98,00        3 .  555666667788999
    66,00        4 .  00111223334
    58,00        4 .  5566678899
    38,00        5 .  012234
    27,00        5 .  55689&
    29,00        6 .  012344
    19,00        6 .  689&
     9,00        7 .  &
   126,00 Extremes    (>=,74)

 Stem width:       ,10
 Each leaf:       6 case(s)


 & denotes fractional leaves.
ln (relativ handelspris) Stem-and-Leaf Plot for
DEPOTSTATUS= Forurenet

 Frequency    Stem &  Leaf

   113,00 Extremes    (=<-,41)
     4,00       -4 .  0
     8,00       -3 .  5&
    21,00       -3 .  0134&
    14,00       -2 .  67&
    32,00       -2 .  01234
    42,00       -1 .  56689&
    62,00       -1 .  001122344
   103,00       -0 .  555556667778899
   150,00       -0 .  000011112222233334444
   246,00        0 .  00000000011111112222233333334444444
   224,00        0 .  5555556666666777777888888999999
   259,00        1 .  00000001111111122222223333333444444444
   293,00        1 .  5555555566666666677777777778888888889999999
   229,00        2 .  00000001111112222222333333344444
   190,00        2 .  5555566666667777777888899999
   145,00        3 .  000011111222223333444
    90,00        3 .  5556677788899
    83,00        4 .  00111223344
    53,00        4 .  5567789
    42,00        5 .  011234
    41,00        5 .  5567789
    37,00        6 .  01234
    37,00        6 .  56789
    34,00        7 .  012344
     2,00        7 .  &
   173,00 Extremes    (>=,75)

 Stem width:       ,10
 Each leaf:       7 case(s)


 & denotes fractional leaves.
ln (relativ handelspris) Stem-and-Leaf Plot for
DEPOTSTATUS= Oprenset

 Frequency    Stem &  Leaf

    40,00 Extremes    (=<-,40)
     9,00       -3 .  01&
    16,00       -2 .  234&&
    29,00       -1 .  034569&
    44,00       -0 .  012234568&
   139,00        0 .  000001112223334444455667778889999
   148,00        1 .  000001122223334444555566666777888999
   119,00        2 .  0001112234445556666677888899
    69,00        3 .  0011234445667899
    35,00        4 .  0123468&
    21,00        5 .  019&&
    12,00        6 .  29&
     1,00        7 .  &
    48,00 Extremes    (>=,72)

 Stem width:       ,10
 Each leaf:       4 case(s)


 & denotes fractional leaves.
ln (relativ handelspris) Stem-and-Leaf Plot for
DEPOTSTATUS= Restforurening

 Frequency    Stem &  Leaf

    14,00 Extremes    (=<-,48)
     1,00       -4 .  &
     6,00       -3 .  5&
     9,00       -2 .  8&
    42,00       -1 .  000133479&
    95,00       -0 .  0011222223334445567789
   132,00        0 .  0000011122233345555666667778899
   113,00        1 .  00001111222333444556677899
    78,00        2 .  00112223344566789
    33,00        3 .  0124789&
    19,00        4 .  1358&
    16,00        5 .  246&&
     4,00        6 .  &
    39,00 Extremes    (>=,63)

 Stem width:       ,10
 Each leaf:       4 case(s)


 & denotes fractional leaves.
ln (relativ handelspris) Stem-and-Leaf Plot for
DEPOTSTATUS= Undersřgt uden fund
Frequency Stem & Leaf
8,00 Extremes (=<-,35)
4,00 -2 . 7789
5,00 -2 . 03344
5,00 -1 . 55699
9,00 -1 . 012244444
12,00 -0 . 555567788889
25,00 -0 . 0000111122222222233333344
39,00 0 . 000000000001111111122222333333344444444
40,00 0 . 5555555566666777777788888888889999999999
28,00 1 . 0000001112222223334444444444
27,00 1 . 555555566666777778888888999
12,00 2 . 001112233444
8,00 2 . 55556788
15,00 3 . 001122333444444
4,00 3 . 6789
2,00 4 . 24
4,00 4 . 6788
20,00 Extremes (>=,51)
Stem width: ,10
Each leaf: 1 case(s)
ln (relativ handelspris) Stem-and-Leaf Plot for
DEPOTSTATUS= Ikke forurenet

 Frequency    Stem &  Leaf

 21546,00 Extremes    (=<-,36)
   355,00       -3 .  &
  3892,00       -3 .  013&
  5039,00       -2 .  56789
  6993,00       -2 .  01234
 10586,00       -1 .  5566789
 15227,00       -1 .  00011223344
 22323,00       -0 .  5555666777888999
 32591,00       -0 .  0000111112222233334444
 58388,00        0 .  000000000001111111222222223333333344444444
 60794,00        0 .  5555555566666666677777777888888888999999999
 64817,00        1 .  0000000001111111112222222223333333333444444444
 63235,00        1 .  555555555666666666777777777888888888999999999
 55538,00        2 .  00000000111111112222222233333334444444
 44804,00        2 .  55555556666666777777888888999999
 35260,00        3 .  0000001111122222333334444
 25735,00        3 .  555566667777888999
 18585,00        4 .  0001112223344
 13076,00        4 .  5566778899
  9180,00        5 .  01234
  6518,00        5 .  56789
  4740,00        6 .  01234
   824,00        6 .  5&
 18436,00 Extremes    (>=,66)

 Stem width:       ,10
 Each leaf:    1410 case(s)


 & denotes fractional leaves.
USE ALL.
COMPUTE filter_$=((LnRH>=-0.47 and LnRH<=0.74 and DEPOTSTATUS=1) or
(LnRH>=-0.41 and LnRH<=0.75 and DEPOTSTATUS=2) or
(LnRH>=-0.40 and LnRH<=0.72 and DEPOTSTATUS=3) or
(LnRH>=-0.48 and LnRH<=0.63 and DEPOTSTATUS=4) or
(LnRH>=-0.35 and LnRH<=0.51 and DEPOTSTATUS=5) or
(LnRH>=-0.36 and LnRH<=0.66 and DEPOTSTATUS=6)).
VARIABLE LABEL filter_$ '(LnRH>=-0.47 and LnRH<=0.74 and DEPOTSTATUS=1) or'+
'(LnRH>=-0.41 and LnRH<=0.75 and DEPOTSTATUS=2) or'+
'(LnRH>=-0.40 and LnRH... (FILTER)'.
VALUE LABELS filter_$ 0 'Not Selected' 1 'Selected'.
FORMAT filter_$ (f1.0).
FILTER BY filter_$.
EXECUTE .
SUMMARIZE
/TABLES=LnRH BY DEPOTSTATUS
/FORMAT=NOLIST TOTAL
/TITLE='Afskĺret med depotstatusvis stem-leaf-plot'
/MISSING=VARIABLE
/CELLS=COUNT MEAN MEDIAN MIN MAX STDDEV KURT SKEW .
Summarize
Notes
| Output Created |
23-AUG-2005 13:37:36 |
|---|
| Comments |
|
|---|
| Input |
Data |
W:\sag\1243\Data\Databearbejdning\SPSS\Dataset\Hyp1.sav |
|---|
| Filter |
(LnRH>=-0.47 and LnRH<=0.74 and DEPOTSTATUS=1) or(LnRH>=-0.41 and LnRH<=0.75 and DEPOTSTATUS=2) or(LnRH>=-0.40 and LnRH... (FILTER) |
|---|
| Weight |
<none> |
|---|
| Split File |
<none> |
|---|
| N of Rows in Working Data File |
565043 |
|---|
| Missing Value Handling |
Definition of Missing |
For each dependent variable in a table, user-defined missing values for the dependent and all grouping variables are treated as missing. |
|---|
| Cases Used |
Cases used for each table have no missing values in any independent variable, and not all dependent variables have missing values. |
|---|
| Syntax |
SUMMARIZE
/TABLES=LnRH BY DEPOTSTATUS
/FORMAT=NOLIST TOTAL
/TITLE='Afskĺret med depotstatusvis stem-leaf-plot'
/MISSING=VARIABLE
/CELLS=COUNT MEAN MEDIAN MIN MAX STDDEV KURT SKEW .
|
|---|
| Resources |
Elapsed Time |
0:00:12,36 |
|---|
Case Processing Summary
|
Cases |
|---|
| Included |
Excluded |
Total |
|---|
| N |
Percent |
N |
Percent |
N |
Percent |
|---|
| ln (relativ handelspris) * Depotstatus |
565043 |
100,0% |
0 |
,0% |
565043 |
100,0% |
|---|
Afskĺret med depotstatusvis stem-leaf-plot
ln (relativ handelspris)
| Depotstatus |
N |
Mean |
Median |
Minimum |
Maximum |
Std. Deviation |
Kurtosis |
Skewness |
|---|
| Mistanke |
2367 |
,1296 |
,1257 |
-,46 |
,74 |
,21896 |
,166 |
,057 |
|---|
| Forurenet |
2439 |
,1724 |
,1607 |
-,41 |
,75 |
,20915 |
,356 |
,352 |
|---|
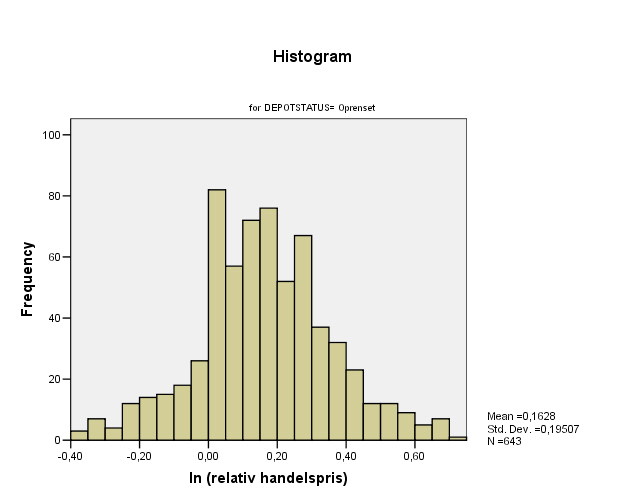
| Oprenset |
643 |
,1628 |
,1563 |
-,40 |
,71 |
,19507 |
,294 |
,063 |
|---|
| Restforurening |
548 |
,1054 |
,0881 |
-,40 |
,63 |
,18324 |
,421 |
,389 |
|---|
| Undersřgt uden fund |
240 |
,0874 |
,0806 |
-,29 |
,51 |
,15409 |
,312 |
,175 |
|---|
| Ikke forurenet |
558806 |
,1546 |
,1485 |
-,36 |
,66 |
,18220 |
,071 |
,075 |
|---|
| Total |
565043 |
,1545 |
,1484 |
-,46 |
,75 |
,18252 |
,079 |
,077 |
|---|
SUMMARIZE
/TABLES=LnRH BY OMRAADE
/FORMAT=NOLIST TOTAL
/TITLE='Afskĺret med depotstatusvis stem-leaf-plot'
/MISSING=VARIABLE
/CELLS=COUNT MEAN MEDIAN MIN MAX STDDEV KURT SKEW .
Summarize
Notes
| Output Created |
23-AUG-2005 13:37:48 |
|---|
| Comments |
|
|---|
| Input |
Data |
W:\sag\1243\Data\Databearbejdning\SPSS\Dataset\Hyp1.sav |
|---|
| Filter |
(LnRH>=-0.47 and LnRH<=0.74 and DEPOTSTATUS=1) or(LnRH>=-0.41 and LnRH<=0.75 and DEPOTSTATUS=2) or(LnRH>=-0.40 and LnRH... (FILTER) |
|---|
| Weight |
<none> |
|---|
| Split File |
<none> |
|---|
| N of Rows in Working Data File |
565043 |
|---|
| Missing Value Handling |
Definition of Missing |
For each dependent variable in a table, user-defined missing values for the dependent and all grouping variables are treated as missing. |
|---|
| Cases Used |
Cases used for each table have no missing values in any independent variable, and not all dependent variables have missing values. |
|---|
| Syntax |
SUMMARIZE
/TABLES=LnRH BY OMRAADE
/FORMAT=NOLIST TOTAL
/TITLE='Afskĺret med depotstatusvis stem-leaf-plot'
/MISSING=VARIABLE
/CELLS=COUNT MEAN MEDIAN MIN MAX STDDEV KURT SKEW .
|
|---|
| Resources |
Elapsed Time |
0:00:12,31 |
|---|
Case Processing Summary
|
Cases |
|---|
| Included |
Excluded |
Total |
|---|
| N |
Percent |
N |
Percent |
N |
Percent |
|---|
| ln (relativ handelspris) * OMRAADE |
565043 |
100,0% |
0 |
,0% |
565043 |
100,0% |
|---|
Afskĺret med depotstatusvis stem-leaf-plot
ln (relativ handelspris)
| OMRAADE |
N |
Mean |
Median |
Minimum |
Maximum |
Std. Deviation |
Kurtosis |
Skewness |
|---|
| Křbenhavn og omegn |
187222 |
,1871 |
,1797 |
-,46 |
,75 |
,17081 |
,216 |
,089 |
|---|
| Řv. Sjćlland og Fyn |
121788 |
,1436 |
,1382 |
-,46 |
,75 |
,18840 |
-,013 |
,076 |
|---|
| Jylland |
256033 |
,1359 |
,1278 |
-,46 |
,74 |
,18473 |
,056 |
,131 |
|---|
| Total |
565043 |
,1545 |
,1484 |
-,46 |
,75 |
,18252 |
,079 |
,077 |
|---|
SUMMARIZE
/TABLES=LnRH BY DEPOTSTATUS BY OMRAADE
/FORMAT=NOLIST TOTAL
/TITLE='Afskĺret med depotstatusvis stem-leaf-plot'
/MISSING=VARIABLE
/CELLS=COUNT MEAN MEDIAN MIN MAX STDDEV KURT SKEW .
Summarize
Notes
| Output Created |
23-AUG-2005 13:38:01 |
|---|
| Comments |
|
|---|
| Input |
Data |
W:\sag\1243\Data\Databearbejdning\SPSS\Dataset\Hyp1.sav |
|---|
| Filter |
(LnRH>=-0.47 and LnRH<=0.74 and DEPOTSTATUS=1) or(LnRH>=-0.41 and LnRH<=0.75 and DEPOTSTATUS=2) or(LnRH>=-0.40 and LnRH... (FILTER) |
|---|
| Weight |
<none> |
|---|
| Split File |
<none> |
|---|
| N of Rows in Working Data File |
565043 |
|---|
| Missing Value Handling |
Definition of Missing |
For each dependent variable in a table, user-defined missing values for the dependent and all grouping variables are treated as missing. |
|---|
| Cases Used |
Cases used for each table have no missing values in any independent variable, and not all dependent variables have missing values. |
|---|
| Syntax |
SUMMARIZE
/TABLES=LnRH BY DEPOTSTATUS BY OMRAADE
/FORMAT=NOLIST TOTAL
/TITLE='Afskĺret med depotstatusvis stem-leaf-plot'
/MISSING=VARIABLE
/CELLS=COUNT MEAN MEDIAN MIN MAX STDDEV KURT SKEW .
|
|---|
| Resources |
Elapsed Time |
0:00:26,62 |
|---|
Case Processing Summary
|
Cases |
|---|
| Included |
Excluded |
Total |
|---|
| N |
Percent |
N |
Percent |
N |
Percent |
|---|
| ln (relativ handelspris) * Depotstatus * OMRAADE |
565043 |
100,0% |
0 |
,0% |
565043 |
100,0% |
|---|
Afskĺret med depotstatusvis stem-leaf-plot
ln (relativ handelspris)
| Depotstatus |
OMRAADE |
N |
Mean |
Median |
Minimum |
Maximum |
Std. Deviation |
Kurtosis |
Skewness |
|---|
| Mistanke |
Křbenhavn og omegn |
1033 |
,1771 |
,1643 |
-,46 |
,74 |
,19586 |
,424 |
,273 |
|---|
| Řv. Sjćlland og Fyn |
540 |
,0947 |
,0896 |
-,46 |
,74 |
,21999 |
,131 |
,015 |
|---|
| Jylland |
794 |
,0916 |
,0719 |
-,46 |
,73 |
,23455 |
-,171 |
,121 |
|---|
| Total |
2367 |
,1296 |
,1257 |
-,46 |
,74 |
,21896 |
,166 |
,057 |
|---|
| Forurenet |
Křbenhavn og omegn |
1767 |
,1923 |
,1768 |
-,41 |
,75 |
,19306 |
,548 |
,428 |
|---|
| Řv. Sjćlland og Fyn |
335 |
,1332 |
,1066 |
-,40 |
,75 |
,25036 |
,014 |
,467 |
|---|
| Jylland |
337 |
,1068 |
,0641 |
-,41 |
,74 |
,22638 |
,081 |
,512 |
|---|
| Total |
2439 |
,1724 |
,1607 |
-,41 |
,75 |
,20915 |
,356 |
,352 |
|---|
| Oprenset |
Křbenhavn og omegn |
297 |
,2168 |
,1967 |
-,31 |
,70 |
,16954 |
,788 |
,127 |
|---|
| Řv. Sjćlland og Fyn |
102 |
,1322 |
,0950 |
-,35 |
,71 |
,22475 |
,084 |
,395 |
|---|
| Jylland |
244 |
,1099 |
,0949 |
-,40 |
,70 |
,19432 |
,173 |
,121 |
|---|
| Total |
643 |
,1628 |
,1563 |
-,40 |
,71 |
,19507 |
,294 |
,063 |
|---|
| Restforurening |
Křbenhavn og omegn |
313 |
,0995 |
,0893 |
-,40 |
,63 |
,18264 |
,464 |
,436 |
|---|
| Řv. Sjćlland og Fyn |
56 |
,1255 |
,1001 |
-,40 |
,60 |
,23790 |
-,362 |
,181 |
|---|
| Jylland |
179 |
,1094 |
,0800 |
-,32 |
,61 |
,16438 |
,587 |
,370 |
|---|
| Total |
548 |
,1054 |
,0881 |
-,40 |
,63 |
,18324 |
,421 |
,389 |
|---|
| Undersřgt uden fund |
Křbenhavn og omegn |
61 |
,1033 |
,0964 |
-,13 |
,36 |
,11077 |
,142 |
,445 |
|---|
| Řv. Sjćlland og Fyn |
67 |
,0882 |
,0517 |
-,29 |
,49 |
,16085 |
,444 |
,436 |
|---|
| Jylland |
112 |
,0784 |
,0799 |
-,29 |
,51 |
,16996 |
-,061 |
,091 |
|---|
| Total |
240 |
,0874 |
,0806 |
-,29 |
,51 |
,15409 |
,312 |
,175 |
|---|
| Ikke forurenet |
Křbenhavn og omegn |
183751 |
,1872 |
,1799 |
-,36 |
,66 |
,17038 |
,204 |
,083 |
|---|
| Řv. Sjćlland og Fyn |
120688 |
,1439 |
,1386 |
-,36 |
,66 |
,18798 |
-,021 |
,075 |
|---|
| Jylland |
254367 |
,1362 |
,1278 |
-,36 |
,66 |
,18448 |
,053 |
,131 |
|---|
| Total |
558806 |
,1546 |
,1485 |
-,36 |
,66 |
,18220 |
,071 |
,075 |
|---|
| Total |
Křbenhavn og omegn |
187222 |
,1871 |
,1797 |
-,46 |
,75 |
,17081 |
,216 |
,089 |
|---|
| Řv. Sjćlland og Fyn |
121788 |
,1436 |
,1382 |
-,46 |
,75 |
,18840 |
-,013 |
,076 |
|---|
| Jylland |
256033 |
,1359 |
,1278 |
-,46 |
,74 |
,18473 |
,056 |
,131 |
|---|
| Total |
565043 |
,1545 |
,1484 |
-,46 |
,75 |
,18252 |
,079 |
,077 |
|---|
EXAMINE
  VARIABLES=LnRH BY DEPOTSTATUS
  /PLOT BOXPLOT HISTOGRAM
  /COMPARE GROUP
  /PERCENTILES(5,10,25,50,75,90,95) HAVERAGE
  /STATISTICS DESCRIPTIVES
  /CINTERVAL 95
  /MISSING LISTWISE
  /NOTOTAL.
Explore
Notes
| Output Created |
23-AUG-2005 13:38:27 |
|---|
| Comments |
|
|---|
| Input |
Data |
W:\sag\1243\Data\Databearbejdning\SPSS\Dataset\Hyp1.sav |
|---|
| Filter |
(LnRH>=-0.47 and LnRH<=0.74 and DEPOTSTATUS=1) or(LnRH>=-0.41 and LnRH<=0.75 and DEPOTSTATUS=2) or(LnRH>=-0.40 and LnRH... (FILTER) |
|---|
| Weight |
<none> |
|---|
| Split File |
<none> |
|---|
| N of Rows in Working Data File |
565043 |
|---|
| Missing Value Handling |
Definition of Missing |
User-defined missing values for dependent variables are treated as missing. |
|---|
| Cases Used |
Statistics are based on cases with no missing values for any dependent variable or factor used. |
|---|
| Syntax |
EXAMINE
VARIABLES=LnRH BY DEPOTSTATUS
/PLOT BOXPLOT HISTOGRAM
/COMPARE GROUP
/PERCENTILES(5,10,25,50,75,90,95) HAVERAGE
/STATISTICS DESCRIPTIVES
/CINTERVAL 95
/MISSING LISTWISE
/NOTOTAL.
|
|---|
| Resources |
Elapsed Time |
0:01:09,09 |
|---|
Depotstatus
ln (relativ handelspris)
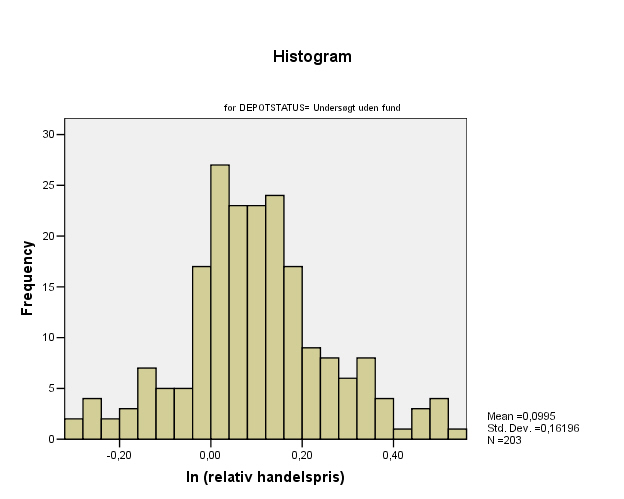
Histograms


UNIANOVA
LnRH BY DEPOTSTATUS OMRAADE
/METHOD = SSTYPE(3)
/INTERCEPT = EXCLUDE
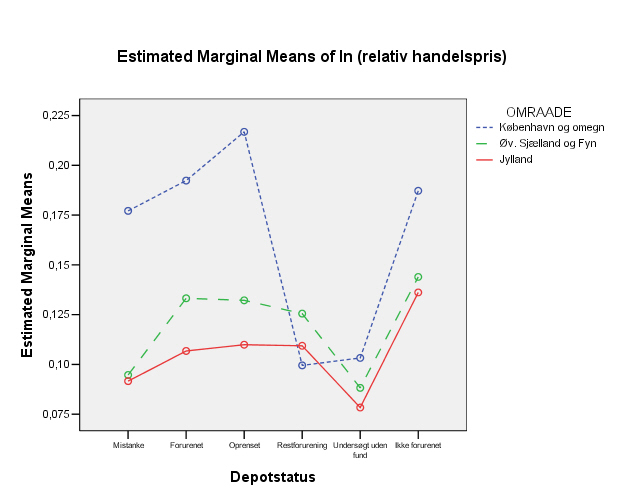
/PLOT = PROFILE( DEPOTSTATUS*OMRAADE )
/EMMEANS = TABLES(DEPOTSTATUS*OMRAADE)
/PRINT = DESCRIPTIVE HOMOGENEITY
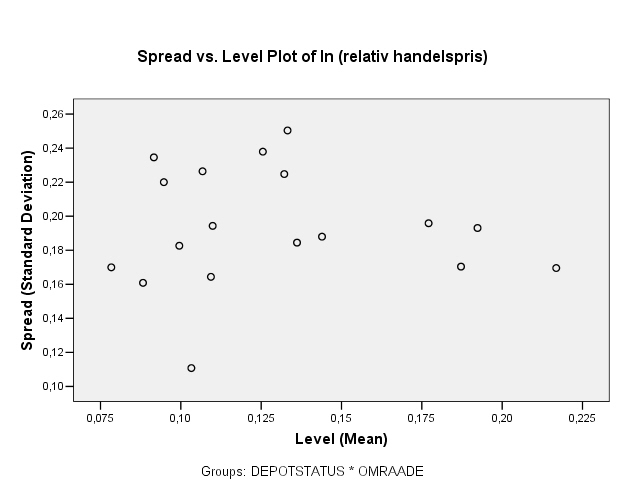
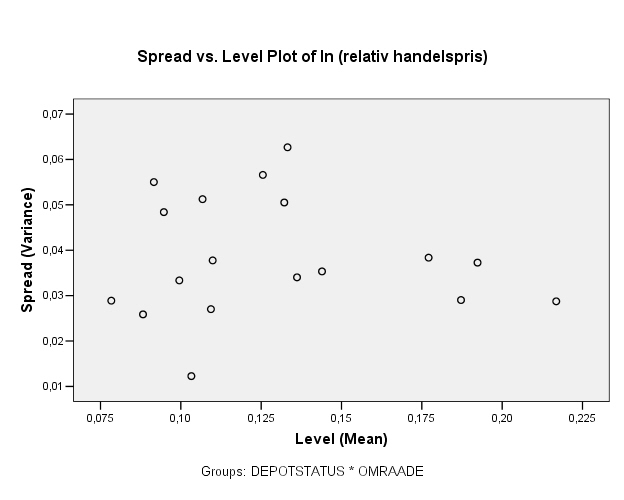
/PLOT = SPREADLEVEL
/CRITERIA = ALPHA(.10)
/DESIGN = DEPOTSTATUS OMRAADE DEPOTSTATUS*OMRAADE .
Univariate Analysis of Variance
Notes
| Output Created |
23-AUG-2005 13:39:36 |
|---|
| Comments |
|
|---|
| Input |
Data |
W:\sag\1243\Data\Databearbejdning\SPSS\Dataset\Hyp1.sav |
|---|
| Filter |
(LnRH>=-0.47 and LnRH<=0.74 and DEPOTSTATUS=1) or(LnRH>=-0.41 and LnRH<=0.75 and DEPOTSTATUS=2) or(LnRH>=-0.40 and LnRH... (FILTER) |
|---|
| Weight |
<none> |
|---|
| Split File |
<none> |
|---|
| N of Rows in Working Data File |
565043 |
|---|
| Missing Value Handling |
Definition of Missing |
User-defined missing values are treated as missing. |
|---|
| Cases Used |
Statistics are based on all cases with valid data for all variables in the model. |
|---|
| Syntax |
UNIANOVA
LnRH BY DEPOTSTATUS OMRAADE
/METHOD = SSTYPE(3)
/INTERCEPT = EXCLUDE
/PLOT = PROFILE( DEPOTSTATUS*OMRAADE )
/EMMEANS = TABLES(DEPOTSTATUS*OMRAADE)
/PRINT = DESCRIPTIVE HOMOGENEITY
/PLOT = SPREADLEVEL
/CRITERIA = ALPHA(.10)
/DESIGN = DEPOTSTATUS OMRAADE DEPOTSTATUS*OMRAADE .
|
|---|
| Resources |
Elapsed Time |
0:00:16,97 |
|---|
Between-Subjects Factors
|
|
Value Label |
N |
|---|
| Depotstatus |
1 |
Mistanke |
2367 |
|---|
| 2 |
Forurenet |
2439 |
|---|
| 3 |
Oprenset |
643 |
|---|
| 4 |
Restforurening |
548 |
|---|
| 5 |
Undersřgt uden fund |
240 |
|---|
| 6 |
Ikke forurenet |
558806 |
|---|
| OMRAADE |
1 |
Křbenhavn og omegn |
187222 |
|---|
| 2 |
Řv. Sjćlland og Fyn |
121788 |
|---|
| 3 |
Jylland |
256033 |
|---|
Descriptive Statistics
Dependent Variable: ln (relativ handelspris)
| Depotstatus |
OMRAADE |
Mean |
Std. Deviation |
N |
|---|
| Mistanke |
Křbenhavn og omegn |
,1771 |
,19586 |
1033 |
|---|
| Řv. Sjćlland og Fyn |
,0947 |
,21999 |
540 |
|---|
| Jylland |
,0916 |
,23455 |
794 |
|---|
| Total |
,1296 |
,21896 |
2367 |
|---|
| Forurenet |
Křbenhavn og omegn |
,1923 |
,19306 |
1767 |
|---|
| Řv. Sjćlland og Fyn |
,1332 |
,25036 |
335 |
|---|
| Jylland |
,1068 |
,22638 |
337 |
|---|
| Total |
,1724 |
,20915 |
2439 |
|---|
| Oprenset |
Křbenhavn og omegn |
,2168 |
,16954 |
297 |
|---|
| Řv. Sjćlland og Fyn |
,1322 |
,22475 |
102 |
|---|
| Jylland |
,1099 |
,19432 |
244 |
|---|
| Total |
,1628 |
,19507 |
643 |
|---|
| Restforurening |
Křbenhavn og omegn |
,0995 |
,18264 |
313 |
|---|
| Řv. Sjćlland og Fyn |
,1255 |
,23790 |
56 |
|---|
| Jylland |
,1094 |
,16438 |
179 |
|---|
| Total |
,1054 |
,18324 |
548 |
|---|
| Undersřgt uden fund |
Křbenhavn og omegn |
,1033 |
,11077 |
61 |
|---|
| Řv. Sjćlland og Fyn |
,0882 |
,16085 |
67 |
|---|
| Jylland |
,0784 |
,16996 |
112 |
|---|
| Total |
,0874 |
,15409 |
240 |
|---|
| Ikke forurenet |
Křbenhavn og omegn |
,1872 |
,17038 |
183751 |
|---|
| Řv. Sjćlland og Fyn |
,1439 |
,18798 |
120688 |
|---|
| Jylland |
,1362 |
,18448 |
254367 |
|---|
| Total |
,1546 |
,18220 |
558806 |
|---|
| Total |
Křbenhavn og omegn |
,1871 |
,17081 |
187222 |
|---|
| Řv. Sjćlland og Fyn |
,1436 |
,18840 |
121788 |
|---|
| Jylland |
,1359 |
,18473 |
256033 |
|---|
| Total |
,1545 |
,18252 |
565043 |
|---|
Levene's Test of Equality of Error Variances(a)
Dependent Variable: ln (relativ handelspris)
| F |
df1 |
df2 |
Sig. |
|---|
| 115,478 |
17 |
565025 |
,000 |
| Tests the null hypothesis that the error variance of the dependent variable is equal across groups. | | a Design: DEPOTSTATUS+OMRAADE+DEPOTSTATUS * OMRAADE |
Tests of Between-Subjects Effects
Dependent Variable: ln (relativ handelspris)
| Source |
Type III Sum of Squares |
df |
Mean Square |
F |
Sig. |
|---|
| Model |
13800,635(a) |
18 |
766,702 |
23396,727 |
,000 |
|---|
| DEPOTSTATUS |
4,438 |
5 |
,888 |
27,085 |
,000 |
|---|
| OMRAADE |
2,611 |
2 |
1,305 |
39,833 |
,000 |
|---|
| DEPOTSTATUS * OMRAADE |
2,144 |
10 |
,214 |
6,542 |
,000 |
|---|
| Error |
18515,657 |
565025 |
,033 |
|
|
|---|
| Total |
32316,292 |
565043 |
|
|
|
|---|
| a R Squared = ,427 (Adjusted R Squared = ,427) |
Estimated Marginal Means
Depotstatus * OMRAADE
Dependent Variable: ln (relativ handelspris)
| Depotstatus |
OMRAADE |
Mean |
Std. Error |
90% Confidence Interval |
|---|
| Lower Bound |
Upper Bound |
|---|
| Mistanke |
Křbenhavn og omegn |
,177 |
,006 |
,168 |
,186 |
|---|
| Řv. Sjćlland og Fyn |
,095 |
,008 |
,082 |
,108 |
|---|
| Jylland |
,092 |
,006 |
,081 |
,102 |
|---|
| Forurenet |
Křbenhavn og omegn |
,192 |
,004 |
,185 |
,199 |
|---|
| Řv. Sjćlland og Fyn |
,133 |
,010 |
,117 |
,149 |
|---|
| Jylland |
,107 |
,010 |
,091 |
,123 |
|---|
| Oprenset |
Křbenhavn og omegn |
,217 |
,011 |
,200 |
,234 |
|---|
| Řv. Sjćlland og Fyn |
,132 |
,018 |
,103 |
,162 |
|---|
| Jylland |
,110 |
,012 |
,091 |
,129 |
|---|
| Restforurening |
Křbenhavn og omegn |
,100 |
,010 |
,083 |
,116 |
|---|
| Řv. Sjćlland og Fyn |
,126 |
,024 |
,086 |
,165 |
|---|
| Jylland |
,109 |
,014 |
,087 |
,132 |
|---|
| Undersřgt uden fund |
Křbenhavn og omegn |
,103 |
,023 |
,065 |
,141 |
|---|
| Řv. Sjćlland og Fyn |
,088 |
,022 |
,052 |
,125 |
|---|
| Jylland |
,078 |
,017 |
,050 |
,106 |
|---|
| Ikke forurenet |
Křbenhavn og omegn |
,187 |
,000 |
,187 |
,188 |
|---|
| Řv. Sjćlland og Fyn |
,144 |
,001 |
,143 |
,145 |
|---|
| Jylland |
,136 |
,000 |
,136 |
,137 |
|---|
Spread-versus-Level Plots
Profile Plots
GET
FILE='W:\sag\1243\Data\Databearbejdning\SPSS\Dataset\Hyp2.sav'.
*Define Variable Properties.
*DEPOTSTATUS.
VARIABLE LABELS DEPOTSTATUS 'Depotstatus'.
VALUE LABELS DEPOTSTATUS
1 'Mistanke'
2 'Forurenet'
3 'Oprenset'
4 'Restforurening'
5 'Undersřgt uden fund'
6 'Ikke forurenet' .
*ZONESTATUS.
VARIABLE LABELS ZONESTATUS 'Zonestatus'.
VALUE LABELS ZONESTATUS
0 'Ukendt'
1 'Byzone'
2 'Landzone' .
*lnRH.
VARIABLE LABELS lnRH 'ln (relativ handelspris)'.
FORMATS lnRH (F8.2).
EXECUTE.
SAVE OUTFILE='W:\sag\1243\Data\Databearbejdning\SPSS\Dataset\hyp2.sav'
/COMPRESSED.
GET
FILE='W:\sag\1243\Data\Databearbejdning\SPSS\Dataset\Hyp2.sav'.
USE ALL.
COMPUTE filter_$=(ZONESTATUS>0).
VARIABLE LABEL filter_$ 'ZONESTATUS>0 (FILTER)'.
VALUE LABELS filter_$ 0 'Not Selected' 1 'Selected'.
FORMAT filter_$ (f1.0).
FILTER BY filter_$.
EXECUTE .
SUMMARIZE
/TABLES=LnRH BY DEPOTSTATUS
/FORMAT=NOLIST TOTAL
/TITLE='Alle observationer'
/MISSING=VARIABLE
/CELLS=COUNT MEAN MEDIAN MIN MAX STDDEV KURT SKEW .
Summarize
Notes
| Output Created |
23-AUG-2005 13:16:56 |
|---|
| Comments |
|
|---|
| Input |
Data |
W:\sag\1243\Data\Databearbejdning\SPSS\Dataset\Hyp2.sav |
|---|
| Filter |
ZONESTATUS>0 (FILTER) |
|---|
| Weight |
<none> |
|---|
| Split File |
<none> |
|---|
| N of Rows in Working Data File |
544375 |
|---|
| Missing Value Handling |
Definition of Missing |
For each dependent variable in a table, user-defined missing values for the dependent and all grouping variables are treated as missing. |
|---|
| Cases Used |
Cases used for each table have no missing values in any independent variable, and not all dependent variables have missing values. |
|---|
| Syntax |
SUMMARIZE
/TABLES=LnRH BY DEPOTSTATUS
/FORMAT=NOLIST TOTAL
/TITLE='Alle observationer'
/MISSING=VARIABLE
/CELLS=COUNT MEAN MEDIAN MIN MAX STDDEV KURT SKEW .
|
|---|
| Resources |
Elapsed Time |
0:00:14,13 |
|---|
Case Processing Summary
|
Cases |
|---|
| Included |
Excluded |
Total |
|---|
| N |
Percent |
N |
Percent |
N |
Percent |
|---|
| ln (relativ handelspris) * Depotstatus |
544375 |
100,0% |
0 |
,0% |
544375 |
100,0% |
|---|
Alle observationer
ln (relativ handelspris)
| Depotstatus |
N |
Mean |
Median |
Minimum |
Maximum |
Std. Deviation |
Kurtosis |
Skewness |
|---|
| Mistanke |
2042 |
,0936 |
,1145 |
-11,51 |
1,82 |
,48909 |
163,470 |
-7,956 |
|---|
| Forurenet |
2031 |
,1531 |
,1437 |
-4,28 |
3,12 |
,40166 |
19,959 |
-1,321 |
|---|
| Oprenset |
646 |
,1475 |
,1617 |
-5,14 |
2,82 |
,50018 |
32,681 |
-3,155 |
|---|
| Restforurening |
474 |
,0968 |
,0953 |
-6,49 |
3,09 |
,55503 |
53,312 |
-4,918 |
|---|
| Undersřgt uden fund |
227 |
,1036 |
,0953 |
-2,77 |
2,05 |
,39192 |
27,450 |
-3,012 |
|---|
| Ikke forurenet |
538955 |
,1385 |
,1470 |
-15,98 |
5,98 |
,34190 |
136,065 |
-5,154 |
|---|
| Total |
544375 |
,1383 |
,1469 |
-15,98 |
5,98 |
,34332 |
135,723 |
-5,167 |
|---|
SUMMARIZE
  /TABLES=LnRH  BY ZONESTATUS
  /FORMAT=NOLIST TOTAL
  /TITLE='Alle observationer'
  /MISSING=VARIABLE
  /CELLS=COUNT MEAN MEDIAN MIN MAX STDDEV KURT SKEW .
Summarize
Notes
| Output Created |
23-AUG-2005 13:17:10 |
|---|
| Comments |
|
|---|
| Input |
Data |
W:\sag\1243\Data\Databearbejdning\SPSS\Dataset\Hyp2.sav |
|---|
| Filter |
ZONESTATUS>0 (FILTER) |
|---|
| Weight |
<none> |
|---|
| Split File |
<none> |
|---|
| N of Rows in Working Data File |
544375 |
|---|
| Missing Value Handling |
Definition of Missing |
For each dependent variable in a table, user-defined missing values for the dependent and all grouping variables are treated as missing. |
|---|
| Cases Used |
Cases used for each table have no missing values in any independent variable, and not all dependent variables have missing values. |
|---|
| Syntax |
SUMMARIZE
/TABLES=LnRH BY ZONESTATUS
/FORMAT=NOLIST TOTAL
/TITLE='Alle observationer'
/MISSING=VARIABLE
/CELLS=COUNT MEAN MEDIAN MIN MAX STDDEV KURT SKEW .
|
|---|
| Resources |
Elapsed Time |
0:00:15,77 |
|---|
Case Processing Summary
|
Cases |
|---|
| Included |
Excluded |
Total |
|---|
| N |
Percent |
N |
Percent |
N |
Percent |
|---|
| ln (relativ handelspris) * Zonestatus |
544375 |
100,0% |
0 |
,0% |
544375 |
100,0% |
|---|
Alle observationer
ln (relativ handelspris)
| Zonestatus |
N |
Mean |
Median |
Minimum |
Maximum |
Std. Deviation |
Kurtosis |
Skewness |
|---|
| Byzone |
448908 |
,1499 |
,1492 |
-15,98 |
5,98 |
,30496 |
149,958 |
-4,527 |
|---|
| Landzone |
95467 |
,0836 |
,1294 |
-13,76 |
4,89 |
,48081 |
84,365 |
-5,089 |
|---|
| Total |
544375 |
,1383 |
,1469 |
-15,98 |
5,98 |
,34332 |
135,723 |
-5,167 |
|---|
SUMMARIZE
  /TABLES=LnRH  BY DEPOTSTATUS BY ZONESTATUS
  /FORMAT=NOLIST TOTAL
  /TITLE='Alle observationer'
  /MISSING=VARIABLE
  /CELLS=COUNT MEAN MEDIAN MIN MAX STDDEV KURT SKEW .
Summarize
Notes
| Output Created |
23-AUG-2005 13:17:25 |
|---|
| Comments |
|
|---|
| Input |
Data |
W:\sag\1243\Data\Databearbejdning\SPSS\Dataset\Hyp2.sav |
|---|
| Filter |
ZONESTATUS>0 (FILTER) |
|---|
| Weight |
<none> |
|---|
| Split File |
<none> |
|---|
| N of Rows in Working Data File |
544375 |
|---|
| Missing Value Handling |
Definition of Missing |
For each dependent variable in a table, user-defined missing values for the dependent and all grouping variables are treated as missing. |
|---|
| Cases Used |
Cases used for each table have no missing values in any independent variable, and not all dependent variables have missing values. |
|---|
| Syntax |
SUMMARIZE
/TABLES=LnRH BY DEPOTSTATUS BY ZONESTATUS
/FORMAT=NOLIST TOTAL
/TITLE='Alle observationer'
/MISSING=VARIABLE
/CELLS=COUNT MEAN MEDIAN MIN MAX STDDEV KURT SKEW .
|
|---|
| Resources |
Elapsed Time |
0:00:31,09 |
|---|
Case Processing Summary
|
Cases |
|---|
| Included |
Excluded |
Total |
|---|
| N |
Percent |
N |
Percent |
N |
Percent |
|---|
| ln (relativ handelspris) * Depotstatus * Zonestatus |
544375 |
100,0% |
0 |
,0% |
544375 |
100,0% |
|---|
Alle observationer
ln (relativ handelspris)
| Depotstatus |
Zonestatus |
N |
Mean |
Median |
Minimum |
Maximum |
Std. Deviation |
Kurtosis |
Skewness |
|---|
| Mistanke |
Byzone |
1460 |
,1505 |
,1459 |
-11,51 |
1,82 |
,47589 |
252,274 |
-10,802 |
|---|
| Landzone |
582 |
-,0493 |
,0132 |
-3,61 |
1,58 |
,49296 |
14,969 |
-2,831 |
|---|
| Total |
2042 |
,0936 |
,1145 |
-11,51 |
1,82 |
,48909 |
163,470 |
-7,956 |
|---|
| Forurenet |
Byzone |
1872 |
,1667 |
,1465 |
-3,33 |
3,12 |
,37487 |
16,302 |
-,441 |
|---|
| Landzone |
159 |
-,0072 |
,0834 |
-4,28 |
1,24 |
,61700 |
15,994 |
-3,040 |
|---|
| Total |
2031 |
,1531 |
,1437 |
-4,28 |
3,12 |
,40166 |
19,959 |
-1,321 |
|---|
| Oprenset |
Byzone |
534 |
,1713 |
,1749 |
-5,14 |
2,82 |
,48531 |
41,525 |
-3,864 |
|---|
| Landzone |
112 |
,0337 |
,0428 |
-3,04 |
2,43 |
,55413 |
10,766 |
-,889 |
|---|
| Total |
646 |
,1475 |
,1617 |
-5,14 |
2,82 |
,50018 |
32,681 |
-3,155 |
|---|
| Restforurening |
Byzone |
457 |
,1119 |
,0991 |
-6,49 |
3,09 |
,53274 |
62,445 |
-5,200 |
|---|
| Landzone |
17 |
-,3086 |
,0000 |
-3,34 |
,46 |
,91495 |
7,587 |
-2,550 |
|---|
| Total |
474 |
,0968 |
,0953 |
-6,49 |
3,09 |
,55503 |
53,312 |
-4,918 |
|---|
| Undersřgt uden fund |
Byzone |
163 |
,1097 |
,0987 |
-2,77 |
,88 |
,30852 |
46,871 |
-4,779 |
|---|
| Landzone |
64 |
,0881 |
,0847 |
-2,77 |
2,05 |
,55310 |
13,107 |
-1,698 |
|---|
| Total |
227 |
,1036 |
,0953 |
-2,77 |
2,05 |
,39192 |
27,450 |
-3,012 |
|---|
| Ikke forurenet |
Byzone |
444422 |
,1499 |
,1492 |
-15,98 |
5,98 |
,30330 |
148,653 |
-4,458 |
|---|
| Landzone |
94533 |
,0847 |
,1304 |
-13,76 |
4,89 |
,48008 |
85,506 |
-5,126 |
|---|
| Total |
538955 |
,1385 |
,1470 |
-15,98 |
5,98 |
,34190 |
136,065 |
-5,154 |
|---|
| Total |
Byzone |
448908 |
,1499 |
,1492 |
-15,98 |
5,98 |
,30496 |
149,958 |
-4,527 |
|---|
| Landzone |
95467 |
,0836 |
,1294 |
-13,76 |
4,89 |
,48081 |
84,365 |
-5,089 |
|---|
| Total |
544375 |
,1383 |
,1469 |
-15,98 |
5,98 |
,34332 |
135,723 |
-5,167 |
|---|
EXAMINE
  VARIABLES=LnRH BY DEPOTSTATUS
  /PLOT BOXPLOT STEMLEAF
  /COMPARE GROUP
  /PERCENTILES(5,10,25,50,75,90,95) HAVERAGE
  /STATISTICS DESCRIPTIVES
  /CINTERVAL 95
  /MISSING LISTWISE
  /NOTOTAL.
Explore
Notes
| Output Created |
23-AUG-2005 13:17:57 |
|---|
| Comments |
|
|---|
| Input |
Data |
W:\sag\1243\Data\Databearbejdning\SPSS\Dataset\Hyp2.sav |
|---|
| Filter |
ZONESTATUS>0 (FILTER) |
|---|
| Weight |
<none> |
|---|
| Split File |
<none> |
|---|
| N of Rows in Working Data File |
544375 |
|---|
| Missing Value Handling |
Definition of Missing |
User-defined missing values for dependent variables are treated as missing. |
|---|
| Cases Used |
Statistics are based on cases with no missing values for any dependent variable or factor used. |
|---|
| Syntax |
EXAMINE
VARIABLES=LnRH BY DEPOTSTATUS
/PLOT BOXPLOT STEMLEAF
/COMPARE GROUP
/PERCENTILES(5,10,25,50,75,90,95) HAVERAGE
/STATISTICS DESCRIPTIVES
/CINTERVAL 95
/MISSING LISTWISE
/NOTOTAL.
|
|---|
| Resources |
Elapsed Time |
0:01:27,25 |
|---|
Depotstatus
ln (relativ handelspris)
Stem-and-Leaf Plots
ln (relativ handelspris) Stem-and-Leaf Plot for
DEPOTSTATUS= Mistanke

 Frequency    Stem &  Leaf

   101,00 Extremes    (=<-,52)
    12,00       -4 .  567&
    23,00       -4 .  02344&
    11,00       -3 .  7&
    21,00       -3 .  0123&
    40,00       -2 .  5567889
    39,00       -2 .  01122344
    42,00       -1 .  56677889
    79,00       -1 .  000111122233344
   113,00       -0 .  55556666677777788888999
   121,00       -0 .  000011111222233333444444
   191,00        0 .  00000000000001111111122222333333444444
   168,00        0 .  5555555556666666777778888888999999
   189,00        1 .  0000000001111111222222333333334444444
   147,00        1 .  55555666666777778888889999999
   164,00        2 .  000000001111112222223333333344444
   126,00        2 .  5555555566677777788889999
   103,00        3 .  00000111112223334444
    71,00        3 .  55566667788999
    46,00        4 .  00112334
    47,00        4 .  56678899
    33,00        5 .  012234
    19,00        5 .  5689
    23,00        6 .  012344
    12,00        6 .  689&
    15,00        7 .  34&
    86,00 Extremes    (>=,75)

 Stem width:       ,10
 Each leaf:       5 case(s)


 & denotes fractional leaves.
ln (relativ handelspris) Stem-and-Leaf Plot for
DEPOTSTATUS= Forurenet

 Frequency    Stem &  Leaf

    92,00 Extremes    (=<-,45)
    12,00       -4 .  013&
     7,00       -3 .  5&
    19,00       -3 .  0134&
    13,00       -2 .  567&
    27,00       -2 .  012334
    35,00       -1 .  5566899&
    54,00       -1 .  00112223344
    89,00       -0 .  55555566677778899
   130,00       -0 .  00001111122222223333344444
   191,00        0 .  000000000011111111222222333333334444444
   186,00        0 .  5555555666666666777777788888899999999
   188,00        1 .  0000001111111122222223333333444444444
   212,00        1 .  555555555666666666777777777788888888999999
   147,00        2 .  00000001111122222233333344444
   120,00        2 .  555556666666777778889999
    84,00        3 .  000111122223333444
    67,00        3 .  55667778888999
    60,00        4 .  00112223344
    46,00        4 .  556777899
    36,00        5 .  0112234
    35,00        5 .  5567789
    34,00        6 .  01234
    27,00        6 .  567899
    23,00        7 .  02344&
    97,00 Extremes    (>=,75)

 Stem width:       ,10
 Each leaf:       5 case(s)


 & denotes fractional leaves.
ln (relativ handelspris) Stem-and-Leaf Plot for
DEPOTSTATUS= Oprenset

 Frequency    Stem &  Leaf

    40,00 Extremes    (=<-,40)
     9,00       -3 .  01&
    15,00       -2 .  234&
    27,00       -1 .  034569&
    33,00       -0 .  1223568&
   122,00        0 .  00001112223344444556777888999
   127,00        1 .  0001122233344455556666777888999
   108,00        2 .  001112234445556666677888899
    64,00        3 .  001123445667899
    30,00        4 .  0123468&
    20,00        5 .  019&&
    12,00        6 .  29&
     2,00        7 .  &
    37,00 Extremes    (>=,73)

 Stem width:       ,10
 Each leaf:       4 case(s)


 & denotes fractional leaves.
ln (relativ handelspris) Stem-and-Leaf Plot for
DEPOTSTATUS= Restforurening

 Frequency    Stem &  Leaf

    12,00 Extremes    (=<-,48)
     1,00       -4 .  &
     6,00       -3 .  5&
     8,00       -2 .  8&&
    33,00       -1 .  00013345799&
    77,00       -0 .  0011222223334444555667789
   104,00        0 .  00000011122233345555566666677788999
    81,00        1 .  00001112233344445566678999
    67,00        2 .  0011222233344566678899
    28,00        3 .  0112345789&
    15,00        4 .  1358&&
     9,00        5 .  02&&
     4,00        6 .  02
    29,00 Extremes    (>=,63)

 Stem width:       ,10
 Each leaf:       3 case(s)


 & denotes fractional leaves.
ln (relativ handelspris) Stem-and-Leaf Plot for
DEPOTSTATUS= Undersřgt uden fund
Frequency Stem & Leaf
8,00 Extremes (=<-,35)
4,00 -2 . 7789
4,00 -2 . 3344
5,00 -1 . 55699
5,00 -1 . 22444
8,00 -0 . 55688889
19,00 -0 . 0001112222222333344
33,00 0 . 000000000111111112222233333444444
32,00 0 . 55555566667777777888888889999999
25,00 1 . 0000011122222334444444444
24,00 1 . 555555566667777888888999
12,00 2 . 001112233444
7,00 2 . 5556788
12,00 3 . 001122334444
4,00 3 . 6789
2,00 4 . 24
4,00 4 . 6788
3,00 5 . 012
16,00 Extremes (>=,58)
Stem width: ,10
Each leaf: 1 case(s)
ln (relativ handelspris) Stem-and-Leaf Plot for
DEPOTSTATUS= Ikke forurenet

 Frequency    Stem &  Leaf

 19842,00 Extremes    (=<-,35)
   277,00       -3 .  &
  3566,00       -3 .  0123&
  4611,00       -2 .  56789
  6349,00       -2 .  01234
  9644,00       -1 .  55667889
 13680,00       -1 .  00011223344
 20066,00       -0 .  5555666777888999
 29262,00       -0 .  0000111112222233334444
 52445,00        0 .  000000000001111111222222223333333344444444
 54880,00        0 .  5555555566666666677777777888888888999999999
 58487,00        1 .  0000000001111111112222222223333333333444444444
 57075,00        1 .  555555555666666666777777777888888888999999999
 50262,00        2 .  000000001111111122222222333333334444444
 40406,00        2 .  55555556666666777777888888999999
 31861,00        3 .  0000001111122222333334444
 23138,00        3 .  555566667777888999
 16804,00        4 .  0001112223344
 11926,00        4 .  5566778899
  8276,00        5 .  01234
  5898,00        5 .  56789
  4216,00        6 .  01234
   538,00        6 .  &
 15446,00 Extremes    (>=,66)

 Stem width:       ,10
 Each leaf:    1272 case(s)


 & denotes fractional leaves.
USE ALL.
COMPUTE filter_$=((ZONESTATUS>0) AND ((LnRH>=-0.52 and LnRH<=0.75 and DEPOTSTATU
S=1) or
(LnRH>=-0.45 and LnRH<=0.75 and DEPOTSTATUS=2) or
(LnRH>=-0.40 and LnRH<=0.73 and DEPOTSTATUS=3) or
(LnRH>=-0.48 and LnRH<=0.63 and DEPOTSTATUS=4) or
(LnRH>=-0.35 and LnRH<=0.58 and DEPOTSTATUS=5) or
(LnRH>=-0.35 and LnRH<=0.66 and DEPOTSTATUS=6))).
VARIABLE LABEL filter_$ '(LnRH>=-0.47 and LnRH<=0.74 and DEPOTSTATUS=1) or'+
'(LnRH>=-0.41 and LnRH<=0.75 and DEPOTSTATUS=2) or'+
'(LnRH>=-0.40 and LnRH... (FILTER)'.
VALUE LABELS filter_$ 0 'Not Selected' 1 'Selected'.
FORMAT filter_$ (f1.0).
FILTER BY filter_$.
EXECUTE .
SUMMARIZE
/TABLES=LnRH BY DEPOTSTATUS
/FORMAT=NOLIST TOTAL
/TITLE='Afskĺret med depotstatusvis stem-leaf-plot'
/MISSING=VARIABLE
/CELLS=COUNT MEAN MEDIAN MIN MAX STDDEV KURT SKEW .
Summarize
Notes
| Output Created |
23-AUG-2005 13:23:33 |
|---|
| Comments |
|
|---|
| Input |
Data |
W:\sag\1243\Data\Databearbejdning\SPSS\Dataset\Hyp2.sav |
|---|
| Filter |
(LnRH>=-0.47 and LnRH<=0.74 and DEPOTSTATUS=1) or(LnRH>=-0.41 and LnRH<=0.75 and DEPOTSTATUS=2) or(LnRH>=-0.40 and LnRH... (FILTER) |
|---|
| Weight |
<none> |
|---|
| Split File |
<none> |
|---|
| N of Rows in Working Data File |
508470 |
|---|
| Missing Value Handling |
Definition of Missing |
For each dependent variable in a table, user-defined missing values for the dependent and all grouping variables are treated as missing. |
|---|
| Cases Used |
Cases used for each table have no missing values in any independent variable, and not all dependent variables have missing values. |
|---|
| Syntax |
SUMMARIZE
/TABLES=LnRH BY DEPOTSTATUS
/FORMAT=NOLIST TOTAL
/TITLE='Afskĺret med depotstatusvis stem-leaf-plot'
/MISSING=VARIABLE
/CELLS=COUNT MEAN MEDIAN MIN MAX STDDEV KURT SKEW .
|
|---|
| Resources |
Elapsed Time |
0:00:12,83 |
|---|
Case Processing Summary
|
Cases |
|---|
| Included |
Excluded |
Total |
|---|
| N |
Percent |
N |
Percent |
N |
Percent |
|---|
| ln (relativ handelspris) * Depotstatus |
508470 |
100,0% |
0 |
,0% |
508470 |
100,0% |
|---|
Afskĺret med depotstatusvis stem-leaf-plot
ln (relativ handelspris)
| Depotstatus |
N |
Mean |
Median |
Minimum |
Maximum |
Std. Deviation |
Kurtosis |
Skewness |
|---|
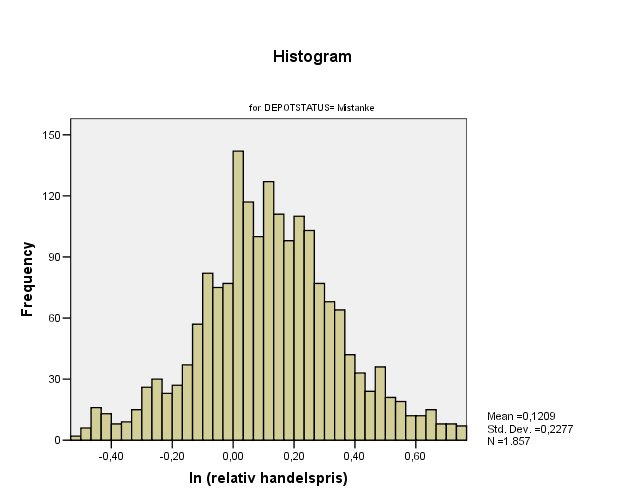
| Mistanke |
1857 |
,1209 |
,1165 |
-,52 |
,74 |
,22770 |
,204 |
,034 |
|---|
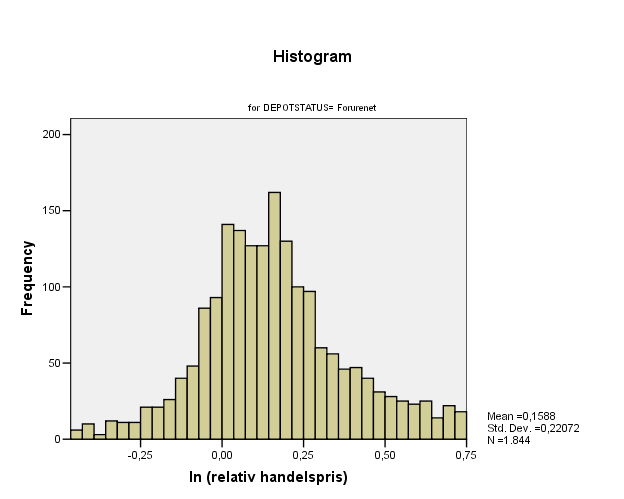
| Forurenet |
1844 |
,1588 |
,1431 |
-,45 |
,75 |
,22072 |
,274 |
,309 |
|---|
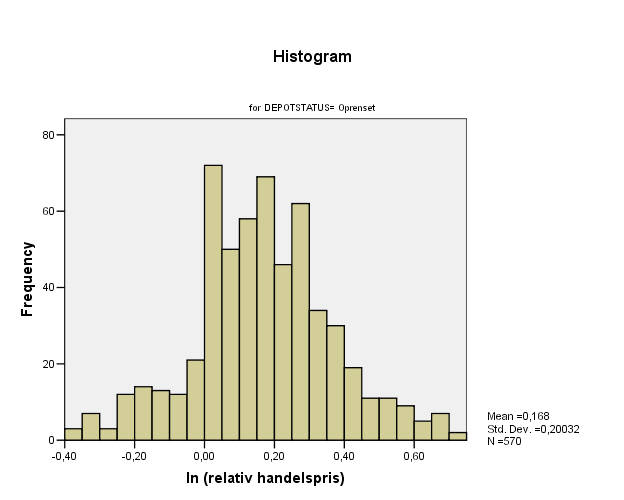
| Oprenset |
570 |
,1680 |
,1624 |
-,40 |
,72 |
,20032 |
,291 |
,052 |
|---|
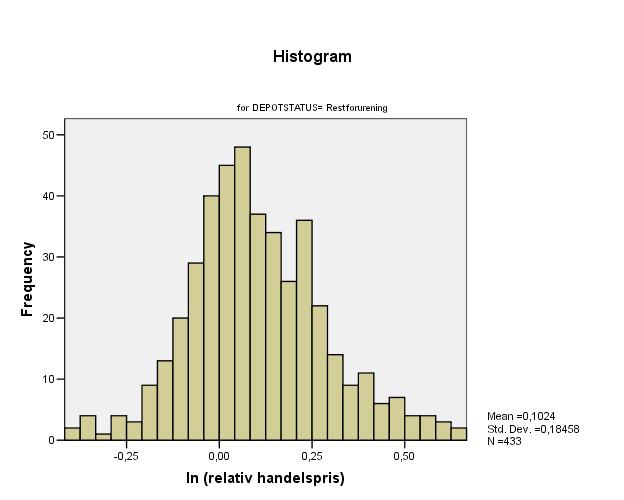
| Restforurening |
433 |
,1024 |
,0800 |
-,40 |
,63 |
,18458 |
,357 |
,293 |
|---|
| Undersřgt uden fund |
203 |
,0995 |
,0871 |
-,29 |
,53 |
,16196 |
,399 |
,183 |
|---|
| Ikke forurenet |
503563 |
,1552 |
,1490 |
-,35 |
,66 |
,18155 |
,049 |
,087 |
|---|
| Total |
508470 |
,1551 |
,1488 |
-,52 |
,75 |
,18194 |
,059 |
,087 |
|---|
SUMMARIZE
/TABLES=LnRH BY ZONESTATUS
/FORMAT=NOLIST TOTAL
/TITLE='Afskĺret med depotstatusvis stem-leaf-plot'
/MISSING=VARIABLE
/CELLS=COUNT MEAN MEDIAN MIN MAX STDDEV KURT SKEW .
Summarize
Notes
| Output Created |
23-AUG-2005 13:23:45 |
|---|
| Comments |
|
|---|
| Input |
Data |
W:\sag\1243\Data\Databearbejdning\SPSS\Dataset\Hyp2.sav |
|---|
| Filter |
(LnRH>=-0.47 and LnRH<=0.74 and DEPOTSTATUS=1) or(LnRH>=-0.41 and LnRH<=0.75 and DEPOTSTATUS=2) or(LnRH>=-0.40 and LnRH... (FILTER) |
|---|
| Weight |
<none> |
|---|
| Split File |
<none> |
|---|
| N of Rows in Working Data File |
508470 |
|---|
| Missing Value Handling |
Definition of Missing |
For each dependent variable in a table, user-defined missing values for the dependent and all grouping variables are treated as missing. |
|---|
| Cases Used |
Cases used for each table have no missing values in any independent variable, and not all dependent variables have missing values. |
|---|
| Syntax |
SUMMARIZE
/TABLES=LnRH BY ZONESTATUS
/FORMAT=NOLIST TOTAL
/TITLE='Afskĺret med depotstatusvis stem-leaf-plot'
/MISSING=VARIABLE
/CELLS=COUNT MEAN MEDIAN MIN MAX STDDEV KURT SKEW .
|
|---|
| Resources |
Elapsed Time |
0:00:13,22 |
|---|
Case Processing Summary
|
Cases |
|---|
| Included |
Excluded |
Total |
|---|
| N |
Percent |
N |
Percent |
N |
Percent |
|---|
| ln (relativ handelspris) * Zonestatus |
508470 |
100,0% |
0 |
,0% |
508470 |
100,0% |
|---|
Afskĺret med depotstatusvis stem-leaf-plot
ln (relativ handelspris)
| Zonestatus |
N |
Mean |
Median |
Minimum |
Maximum |
Std. Deviation |
Kurtosis |
Skewness |
|---|
| Byzone |
425255 |
,1557 |
,1492 |
-,52 |
,75 |
,17412 |
,161 |
,105 |
|---|
| Landzone |
83215 |
,1520 |
,1455 |
-,52 |
,75 |
,21753 |
-,484 |
,052 |
|---|
| Total |
508470 |
,1551 |
,1488 |
-,52 |
,75 |
,18194 |
,059 |
,087 |
|---|
SUMMARIZE
/TABLES=LnRH BY DEPOTSTATUS BY ZONESTATUS
/FORMAT=NOLIST TOTAL
/TITLE='Afskĺret med depotstatusvis stem-leaf-plot'
/MISSING=VARIABLE
/CELLS=COUNT MEAN MEDIAN MIN MAX STDDEV KURT SKEW .
Summarize
Notes
| Output Created |
23-AUG-2005 13:23:59 |
|---|
| Comments |
|
|---|
| Input |
Data |
W:\sag\1243\Data\Databearbejdning\SPSS\Dataset\Hyp2.sav |
|---|
| Filter |
(LnRH>=-0.47 and LnRH<=0.74 and DEPOTSTATUS=1) or(LnRH>=-0.41 and LnRH<=0.75 and DEPOTSTATUS=2) or(LnRH>=-0.40 and LnRH... (FILTER) |
|---|
| Weight |
<none> |
|---|
| Split File |
<none> |
|---|
| N of Rows in Working Data File |
508470 |
|---|
| Missing Value Handling |
Definition of Missing |
For each dependent variable in a table, user-defined missing values for the dependent and all grouping variables are treated as missing. |
|---|
| Cases Used |
Cases used for each table have no missing values in any independent variable, and not all dependent variables have missing values. |
|---|
| Syntax |
SUMMARIZE
/TABLES=LnRH BY DEPOTSTATUS BY ZONESTATUS
/FORMAT=NOLIST TOTAL
/TITLE='Afskĺret med depotstatusvis stem-leaf-plot'
/MISSING=VARIABLE
/CELLS=COUNT MEAN MEDIAN MIN MAX STDDEV KURT SKEW .
|
|---|
| Resources |
Elapsed Time |
0:00:25,33 |
|---|
Case Processing Summary
|
Cases |
|---|
| Included |
Excluded |
Total |
|---|
| N |
Percent |
N |
Percent |
N |
Percent |
|---|
| ln (relativ handelspris) * Depotstatus * Zonestatus |
508470 |
100,0% |
0 |
,0% |
508470 |
100,0% |
|---|
Afskĺret med depotstatusvis stem-leaf-plot
ln (relativ handelspris)
| Depotstatus |
Zonestatus |
N |
Mean |
Median |
Minimum |
Maximum |
Std. Deviation |
Kurtosis |
Skewness |
|---|
| Mistanke |
Byzone |
1339 |
,1458 |
,1364 |
-,52 |
,74 |
,21551 |
,357 |
,134 |
|---|
| Landzone |
518 |
,0564 |
,0496 |
-,52 |
,73 |
,24525 |
-,203 |
,055 |
|---|
| Total |
1857 |
,1209 |
,1165 |
-,52 |
,74 |
,22770 |
,204 |
,034 |
|---|
| Forurenet |
Byzone |
1707 |
,1594 |
,1431 |
-,45 |
,75 |
,21570 |
,388 |
,326 |
|---|
| Landzone |
137 |
,1514 |
,1403 |
-,44 |
,75 |
,27653 |
-,691 |
,227 |
|---|
| Total |
1844 |
,1588 |
,1431 |
-,45 |
,75 |
,22072 |
,274 |
,309 |
|---|
| Oprenset |
Byzone |
480 |
,1766 |
,1699 |
-,35 |
,72 |
,18706 |
,494 |
-,004 |
|---|
| Landzone |
90 |
,1218 |
,0789 |
-,40 |
,69 |
,25626 |
-,321 |
,432 |
|---|
| Total |
570 |
,1680 |
,1624 |
-,40 |
,72 |
,20032 |
,291 |
,052 |
|---|
| Restforurening |
Byzone |
420 |
,1032 |
,0803 |
-,40 |
,63 |
,18237 |
,336 |
,361 |
|---|
| Landzone |
13 |
,0759 |
,0710 |
-,40 |
,46 |
,25403 |
,068 |
-,560 |
|---|
| Total |
433 |
,1024 |
,0800 |
-,40 |
,63 |
,18458 |
,357 |
,293 |
|---|
| Undersřgt uden fund |
Byzone |
151 |
,1070 |
,0958 |
-,29 |
,53 |
,15336 |
,635 |
,126 |
|---|
| Landzone |
52 |
,0777 |
,0654 |
-,25 |
,51 |
,18459 |
,094 |
,399 |
|---|
| Total |
203 |
,0995 |
,0871 |
-,29 |
,53 |
,16196 |
,399 |
,183 |
|---|
| Ikke forurenet |
Byzone |
421158 |
,1557 |
,1493 |
-,35 |
,66 |
,17376 |
,150 |
,103 |
|---|
| Landzone |
82405 |
,1527 |
,1463 |
-,35 |
,66 |
,21706 |
-,492 |
,054 |
|---|
| Total |
503563 |
,1552 |
,1490 |
-,35 |
,66 |
,18155 |
,049 |
,087 |
|---|
| Total |
Byzone |
425255 |
,1557 |
,1492 |
-,52 |
,75 |
,17412 |
,161 |
,105 |
|---|
| Landzone |
83215 |
,1520 |
,1455 |
-,52 |
,75 |
,21753 |
-,484 |
,052 |
|---|
| Total |
508470 |
,1551 |
,1488 |
-,52 |
,75 |
,18194 |
,059 |
,087 |
|---|
EXAMINE
  VARIABLES=LnRH BY DEPOTSTATUS
  /PLOT BOXPLOT HISTOGRAM
  /COMPARE GROUP
  /PERCENTILES(5,10,25,50,75,90,95) HAVERAGE
  /STATISTICS DESCRIPTIVES
  /CINTERVAL 95
  /MISSING LISTWISE
  /NOTOTAL.
Explore
Notes
| Output Created |
23-AUG-2005 13:24:24 |
|---|
| Comments |
|
|---|
| Input |
Data |
W:\sag\1243\Data\Databearbejdning\SPSS\Dataset\Hyp2.sav |
|---|
| Filter |
(LnRH>=-0.47 and LnRH<=0.74 and DEPOTSTATUS=1) or(LnRH>=-0.41 and LnRH<=0.75 and DEPOTSTATUS=2) or(LnRH>=-0.40 and LnRH... (FILTER) |
|---|
| Weight |
<none> |
|---|
| Split File |
<none> |
|---|
| N of Rows in Working Data File |
508470 |
|---|
| Missing Value Handling |
Definition of Missing |
User-defined missing values for dependent variables are treated as missing. |
|---|
| Cases Used |
Statistics are based on cases with no missing values for any dependent variable or factor used. |
|---|
| Syntax |
EXAMINE
VARIABLES=LnRH BY DEPOTSTATUS
/PLOT BOXPLOT HISTOGRAM
/COMPARE GROUP
/PERCENTILES(5,10,25,50,75,90,95) HAVERAGE
/STATISTICS DESCRIPTIVES
/CINTERVAL 95
/MISSING LISTWISE
/NOTOTAL.
|
|---|
| Resources |
Elapsed Time |
0:01:04,72 |
|---|
Depotstatus
ln (relativ handelspris)
Histograms
UNIANOVA
  LnRH  BY DEPOTSTATUS ZONESTATUS
  /METHOD = SSTYPE(3)
  /INTERCEPT = EXCLUDE
  /PLOT = PROFILE( DEPOTSTATUS*ZONESTATUS )
  /EMMEANS = TABLES(DEPOTSTATUS*ZONESTATUS)
  /PRINT = DESCRIPTIVE HOMOGENEITY
  /PLOT = SPREADLEVEL
  /CRITERIA = ALPHA(.10)
  /DESIGN = DEPOTSTATUS ZONESTATUS DEPOTSTATUS*ZONESTATUS .
Univariate Analysis of Variance
Notes
| Output Created |
23-AUG-2005 13:25:29 |
|---|
| Comments |
|
|---|
| Input |
Data |
W:\sag\1243\Data\Databearbejdning\SPSS\Dataset\Hyp2.sav |
|---|
| Filter |
(LnRH>=-0.47 and LnRH<=0.74 and DEPOTSTATUS=1) or(LnRH>=-0.41 and LnRH<=0.75 and DEPOTSTATUS=2) or(LnRH>=-0.40 and LnRH... (FILTER) |
|---|
| Weight |
<none> |
|---|
| Split File |
<none> |
|---|
| N of Rows in Working Data File |
508470 |
|---|
| Missing Value Handling |
Definition of Missing |
User-defined missing values are treated as missing. |
|---|
| Cases Used |
Statistics are based on all cases with valid data for all variables in the model. |
|---|
| Syntax |
UNIANOVA
LnRH BY DEPOTSTATUS ZONESTATUS
/METHOD = SSTYPE(3)
/INTERCEPT = EXCLUDE
/PLOT = PROFILE( DEPOTSTATUS*ZONESTATUS )
/EMMEANS = TABLES(DEPOTSTATUS*ZONESTATUS)
/PRINT = DESCRIPTIVE HOMOGENEITY
/PLOT = SPREADLEVEL
/CRITERIA = ALPHA(.10)
/DESIGN = DEPOTSTATUS ZONESTATUS DEPOTSTATUS*ZONESTATUS .
|
|---|
| Resources |
Elapsed Time |
0:00:16,37 |
|---|
Between-Subjects Factors
|
|
Value Label |
N |
|---|
| Depotstatus |
1 |
Mistanke |
1857 |
|---|
| 2 |
Forurenet |
1844 |
|---|
| 3 |
Oprenset |
570 |
|---|
| 4 |
Restforurening |
433 |
|---|
| 5 |
Undersřgt uden fund |
203 |
|---|
| 6 |
Ikke forurenet |
503563 |
|---|
| Zonestatus |
1 |
Byzone |
425255 |
|---|
| 2 |
Landzone |
83215 |
|---|
Descriptive Statistics
Dependent Variable: ln (relativ handelspris)
| Depotstatus |
Zonestatus |
Mean |
Std. Deviation |
N |
|---|
| Mistanke |
Byzone |
,1458 |
,21551 |
1339 |
|---|
| Landzone |
,0564 |
,24525 |
518 |
|---|
| Total |
,1209 |
,22770 |
1857 |
|---|
| Forurenet |
Byzone |
,1594 |
,21570 |
1707 |
|---|
| Landzone |
,1514 |
,27653 |
137 |
|---|
| Total |
,1588 |
,22072 |
1844 |
|---|
| Oprenset |
Byzone |
,1766 |
,18706 |
480 |
|---|
| Landzone |
,1218 |
,25626 |
90 |
|---|
| Total |
,1680 |
,20032 |
570 |
|---|
| Restforurening |
Byzone |
,1032 |
,18237 |
420 |
|---|
| Landzone |
,0759 |
,25403 |
13 |
|---|
| Total |
,1024 |
,18458 |
433 |
|---|
| Undersřgt uden fund |
Byzone |
,1070 |
,15336 |
151 |
|---|
| Landzone |
,0777 |
,18459 |
52 |
|---|
| Total |
,0995 |
,16196 |
203 |
|---|
| Ikke forurenet |
Byzone |
,1557 |
,17376 |
421158 |
|---|
| Landzone |
,1527 |
,21706 |
82405 |
|---|
| Total |
,1552 |
,18155 |
503563 |
|---|
| Total |
Byzone |
,1557 |
,17412 |
425255 |
|---|
| Landzone |
,1520 |
,21753 |
83215 |
|---|
| Total |
,1551 |
,18194 |
508470 |
|---|
Levene's Test of Equality of Error Variances(a)
Dependent Variable: ln (relativ handelspris)
| F |
df1 |
df2 |
Sig. |
|---|
| 839,907 |
11 |
508458 |
,000 |
| Tests the null hypothesis that the error variance of the dependent variable is equal across groups. | | a Design: DEPOTSTATUS+ZONESTATUS+DEPOTSTATUS * ZONESTATUS |
Tests of Between-Subjects Effects
Dependent Variable: ln (relativ handelspris)
| Source |
Type III Sum of Squares |
df |
Mean Square |
F |
Sig. |
|---|
| Model |
12235,485(a) |
12 |
1019,624 |
30816,267 |
,000 |
|---|
| DEPOTSTATUS |
4,992 |
5 |
,998 |
30,177 |
,000 |
|---|
| ZONESTATUS |
,348 |
1 |
,348 |
10,520 |
,001 |
|---|
| DEPOTSTATUS * ZONESTATUS |
3,010 |
5 |
,602 |
18,193 |
,000 |
|---|
| Error |
16823,447 |
508458 |
,033 |
|
|
|---|
| Total |
29058,931 |
508470 |
|
|
|
|---|
| a R Squared = ,421 (Adjusted R Squared = ,421) |
Estimated Marginal Means
Depotstatus * Zonestatus
Dependent Variable: ln (relativ handelspris)
| Depotstatus |
Zonestatus |
Mean |
Std. Error |
90% Confidence Interval |
|---|
| Lower Bound |
Upper Bound |
|---|
| Mistanke |
Byzone |
,146 |
,005 |
,138 |
,154 |
|---|
| Landzone |
,056 |
,008 |
,043 |
,070 |
|---|
| Forurenet |
Byzone |
,159 |
,004 |
,152 |
,167 |
|---|
| Landzone |
,151 |
,016 |
,126 |
,177 |
|---|
| Oprenset |
Byzone |
,177 |
,008 |
,163 |
,190 |
|---|
| Landzone |
,122 |
,019 |
,090 |
,153 |
|---|
| Restforurening |
Byzone |
,103 |
,009 |
,089 |
,118 |
|---|
| Landzone |
,076 |
,050 |
-,007 |
,159 |
|---|
| Undersřgt uden fund |
Byzone |
,107 |
,015 |
,083 |
,131 |
|---|
| Landzone |
,078 |
,025 |
,036 |
,119 |
|---|
| Ikke forurenet |
Byzone |
,156 |
,000 |
,155 |
,156 |
|---|
| Landzone |
,153 |
,001 |
,152 |
,154 |
|---|
Spread-versus-Level Plots
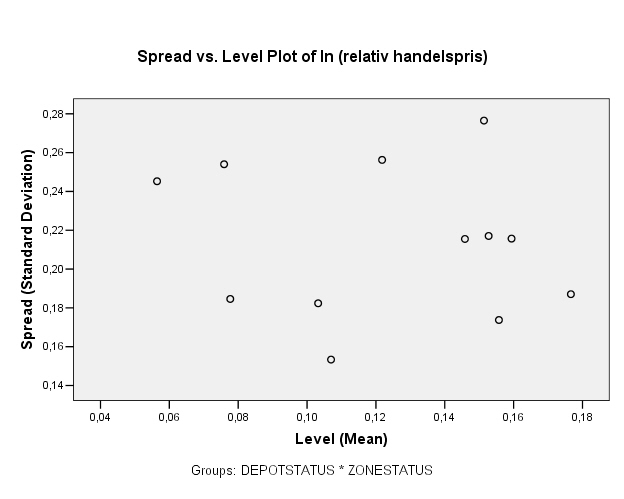
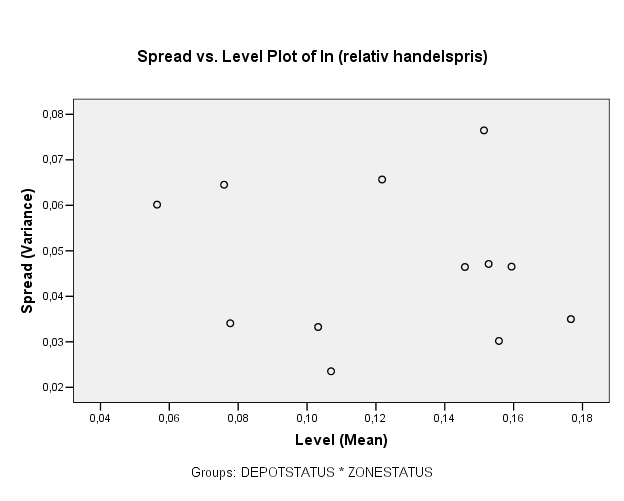
Profile Plots
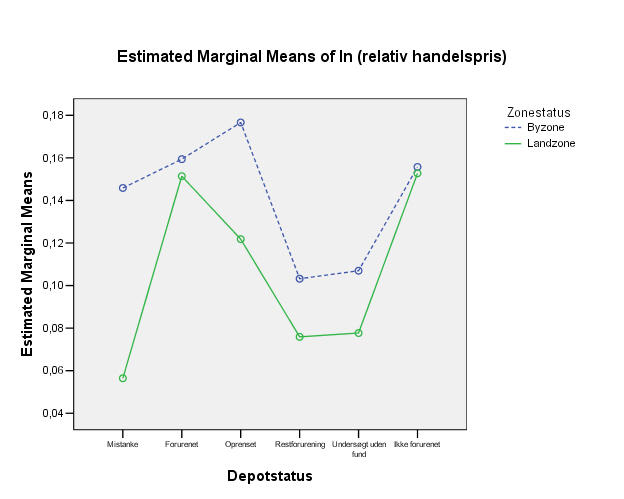
GET
FILE='W:\sag\1243\Data\Databearbejdning\SPSS\Dataset\Hyp3.sav'.
*Define Variable Properties.
*DEPOTSTATUS.
VARIABLE LABELS DEPOTSTATUS 'Depotstatus'.
VALUE LABELS DEPOTSTATUS
1 'Mistanke'
2 'Forurenet'
3 'Oprenset'
4 'Restforurening'
5 'Undersřgt uden fund'
6 'Ikke forurenet' .
*BENYTTELSE.
VARIABLE LABELS BENYTTELSE 'Boligbenyttelse'.
VALUE LABELS BENYTTELSE
0 'Ukendt'
1 'Hus'
2 'Etagelejlighed' .
*lnRH.
VARIABLE LABELS lnRH 'ln (relativ handelspris)'.
FORMATS lnRH (F8.2).
EXECUTE.
SAVE OUTFILE='W:\sag\1243\Data\Databearbejdning\SPSS\Dataset\hyp3.sav'
/COMPRESSED.
GET
FILE='W:\sag\1243\Data\Databearbejdning\SPSS\Dataset\Hyp3.sav'.
USE ALL.
COMPUTE filter_$=(BENYTTELSE>0).
VARIABLE LABEL filter_$ 'BENYTTELSE>0 (FILTER)'.
VALUE LABELS filter_$ 0 'Not Selected' 1 'Selected'.
FORMAT filter_$ (f1.0).
FILTER BY filter_$.
EXECUTE .
SUMMARIZE
/TABLES=LnRH BY DEPOTSTATUS
/FORMAT=NOLIST TOTAL
/TITLE='Alle observationer'
/MISSING=VARIABLE
/CELLS=COUNT MEAN MEDIAN MIN MAX STDDEV KURT SKEW .
Summarize
Notes
| Output Created |
23-AUG-2005 13:54:42 |
|---|
| Comments |
|
|---|
| Input |
Data |
W:\sag\1243\Data\Databearbejdning\SPSS\Dataset\Hyp3.sav |
|---|
| Filter |
BENYTTELSE>0 (FILTER) |
|---|
| Weight |
<none> |
|---|
| Split File |
<none> |
|---|
| N of Rows in Working Data File |
593820 |
|---|
| Missing Value Handling |
Definition of Missing |
For each dependent variable in a table, user-defined missing values for the dependent and all grouping variables are treated as missing. |
|---|
| Cases Used |
Cases used for each table have no missing values in any independent variable, and not all dependent variables have missing values. |
|---|
| Syntax |
SUMMARIZE
/TABLES=LnRH BY DEPOTSTATUS
/FORMAT=NOLIST TOTAL
/TITLE='Alle observationer'
/MISSING=VARIABLE
/CELLS=COUNT MEAN MEDIAN MIN MAX STDDEV KURT SKEW .
|
|---|
| Resources |
Elapsed Time |
0:00:13,25 |
|---|
Case Processing Summary
|
Cases |
|---|
| Included |
Excluded |
Total |
|---|
| N |
Percent |
N |
Percent |
N |
Percent |
|---|
| ln (relativ handelspris) * Depotstatus |
593820 |
100,0% |
0 |
,0% |
593820 |
100,0% |
|---|
Alle observationer
ln (relativ handelspris)
| Depotstatus |
N |
Mean |
Median |
Minimum |
Maximum |
Std. Deviation |
Kurtosis |
Skewness |
|---|
| Mistanke |
2522 |
,1188 |
,1260 |
-11,51 |
3,50 |
,47086 |
157,753 |
-6,939 |
|---|
| Forurenet |
2684 |
,1934 |
,1657 |
-4,28 |
3,86 |
,41815 |
18,367 |
,218 |
|---|
| Oprenset |
714 |
,1564 |
,1569 |
-5,14 |
2,82 |
,49292 |
32,045 |
-2,858 |
|---|
| Restforurening |
590 |
,1179 |
,0993 |
-6,49 |
3,62 |
,51881 |
59,156 |
-4,138 |
|---|
| Undersřgt uden fund |
261 |
,0973 |
,0861 |
-2,77 |
2,05 |
,37229 |
29,311 |
-2,960 |
|---|
| Ikke forurenet |
587049 |
,1405 |
,1471 |
-15,98 |
5,98 |
,34455 |
128,509 |
-4,885 |
|---|
| Total |
593820 |
,1406 |
,1470 |
-15,98 |
5,98 |
,34601 |
127,887 |
-4,866 |
|---|
SUMMARIZE
  /TABLES=LnRH  BY BENYTTELSE
  /FORMAT=NOLIST TOTAL
  /TITLE='Alle observationer'
  /MISSING=VARIABLE
  /CELLS=COUNT MEAN MEDIAN MIN MAX STDDEV KURT SKEW .
Summarize
Notes
| Output Created |
23-AUG-2005 13:54:56 |
|---|
| Comments |
|
|---|
| Input |
Data |
W:\sag\1243\Data\Databearbejdning\SPSS\Dataset\Hyp3.sav |
|---|
| Filter |
BENYTTELSE>0 (FILTER) |
|---|
| Weight |
<none> |
|---|
| Split File |
<none> |
|---|
| N of Rows in Working Data File |
593820 |
|---|
| Missing Value Handling |
Definition of Missing |
For each dependent variable in a table, user-defined missing values for the dependent and all grouping variables are treated as missing. |
|---|
| Cases Used |
Cases used for each table have no missing values in any independent variable, and not all dependent variables have missing values. |
|---|
| Syntax |
SUMMARIZE
/TABLES=LnRH BY BENYTTELSE
/FORMAT=NOLIST TOTAL
/TITLE='Alle observationer'
/MISSING=VARIABLE
/CELLS=COUNT MEAN MEDIAN MIN MAX STDDEV KURT SKEW .
|
|---|
| Resources |
Elapsed Time |
0:00:13,17 |
|---|
Case Processing Summary
|
Cases |
|---|
| Included |
Excluded |
Total |
|---|
| N |
Percent |
N |
Percent |
N |
Percent |
|---|
| ln (relativ handelspris) * Boligbenyttelse |
593820 |
100,0% |
0 |
,0% |
593820 |
100,0% |
|---|
Alle observationer
ln (relativ handelspris)
| Boligbenyttelse |
N |
Mean |
Median |
Minimum |
Maximum |
Std. Deviation |
Kurtosis |
Skewness |
|---|
| Hus |
453970 |
,1106 |
,1320 |
-15,98 |
5,47 |
,34736 |
132,430 |
-5,891 |
|---|
| Etagelejlighed |
139850 |
,2382 |
,1985 |
-13,71 |
5,98 |
,32287 |
133,342 |
-1,500 |
|---|
| Total |
593820 |
,1406 |
,1470 |
-15,98 |
5,98 |
,34601 |
127,887 |
-4,866 |
|---|
SUMMARIZE
  /TABLES=LnRH  BY DEPOTSTATUS BY BENYTTELSE
  /FORMAT=NOLIST TOTAL
  /TITLE='Alle observationer'
  /MISSING=VARIABLE
  /CELLS=COUNT MEAN MEDIAN MIN MAX STDDEV KURT SKEW .
Summarize
Notes
| Output Created |
23-AUG-2005 13:55:09 |
|---|
| Comments |
|
|---|
| Input |
Data |
W:\sag\1243\Data\Databearbejdning\SPSS\Dataset\Hyp3.sav |
|---|
| Filter |
BENYTTELSE>0 (FILTER) |
|---|
| Weight |
<none> |
|---|
| Split File |
<none> |
|---|
| N of Rows in Working Data File |
593820 |
|---|
| Missing Value Handling |
Definition of Missing |
For each dependent variable in a table, user-defined missing values for the dependent and all grouping variables are treated as missing. |
|---|
| Cases Used |
Cases used for each table have no missing values in any independent variable, and not all dependent variables have missing values. |
|---|
| Syntax |
SUMMARIZE
/TABLES=LnRH BY DEPOTSTATUS BY BENYTTELSE
/FORMAT=NOLIST TOTAL
/TITLE='Alle observationer'
/MISSING=VARIABLE
/CELLS=COUNT MEAN MEDIAN MIN MAX STDDEV KURT SKEW .
|
|---|
| Resources |
Elapsed Time |
0:00:30,75 |
|---|
Case Processing Summary
|
Cases |
|---|
| Included |
Excluded |
Total |
|---|
| N |
Percent |
N |
Percent |
N |
Percent |
|---|
| ln (relativ handelspris) * Depotstatus * Boligbenyttelse |
593820 |
100,0% |
0 |
,0% |
593820 |
100,0% |
|---|
Alle observationer
ln (relativ handelspris)
| Depotstatus |
Boligbenyttelse |
N |
Mean |
Median |
Minimum |
Maximum |
Std. Deviation |
Kurtosis |
Skewness |
|---|
| Mistanke |
Hus |
1023 |
-,0141 |
,0391 |
-3,69 |
1,77 |
,44466 |
15,178 |
-2,652 |
|---|
| Etagelejlighed |
1499 |
,2095 |
,1658 |
-11,51 |
3,50 |
,46681 |
273,130 |
-10,473 |
|---|
| Total |
2522 |
,1188 |
,1260 |
-11,51 |
3,50 |
,47086 |
157,753 |
-6,939 |
|---|
| Forurenet |
Hus |
614 |
,0364 |
,0658 |
-4,28 |
2,93 |
,50051 |
19,196 |
-2,103 |
|---|
| Etagelejlighed |
2070 |
,2399 |
,1843 |
-2,10 |
3,86 |
,37820 |
14,309 |
2,118 |
|---|
| Total |
2684 |
,1934 |
,1657 |
-4,28 |
3,86 |
,41815 |
18,367 |
,218 |
|---|
| Oprenset |
Hus |
328 |
,0170 |
,0747 |
-5,14 |
2,43 |
,60066 |
25,992 |
-3,506 |
|---|
| Etagelejlighed |
386 |
,2749 |
,2027 |
-,68 |
2,82 |
,33597 |
12,941 |
2,602 |
|---|
| Total |
714 |
,1564 |
,1569 |
-5,14 |
2,82 |
,49292 |
32,045 |
-2,858 |
|---|
| Restforurening |
Hus |
137 |
-,0354 |
,0800 |
-6,49 |
3,09 |
,88143 |
24,982 |
-3,904 |
|---|
| Etagelejlighed |
453 |
,1642 |
,1022 |
-,69 |
3,62 |
,32819 |
31,058 |
3,858 |
|---|
| Total |
590 |
,1179 |
,0993 |
-6,49 |
3,62 |
,51881 |
59,156 |
-4,138 |
|---|
| Undersřgt uden fund |
Hus |
147 |
,0574 |
,0834 |
-2,77 |
2,05 |
,45158 |
22,551 |
-2,930 |
|---|
| Etagelejlighed |
114 |
,1487 |
,0915 |
-,20 |
,95 |
,22514 |
2,766 |
1,676 |
|---|
| Total |
261 |
,0973 |
,0861 |
-2,77 |
2,05 |
,37229 |
29,311 |
-2,960 |
|---|
| Ikke forurenet |
Hus |
451721 |
,1111 |
,1323 |
-15,98 |
5,47 |
,34620 |
134,101 |
-5,919 |
|---|
| Etagelejlighed |
135328 |
,2387 |
,1995 |
-13,71 |
5,98 |
,31995 |
128,506 |
-1,306 |
|---|
| Total |
587049 |
,1405 |
,1471 |
-15,98 |
5,98 |
,34455 |
128,509 |
-4,885 |
|---|
| Total |
Hus |
453970 |
,1106 |
,1320 |
-15,98 |
5,47 |
,34736 |
132,430 |
-5,891 |
|---|
| Etagelejlighed |
139850 |
,2382 |
,1985 |
-13,71 |
5,98 |
,32287 |
133,342 |
-1,500 |
|---|
| Total |
593820 |
,1406 |
,1470 |
-15,98 |
5,98 |
,34601 |
127,887 |
-4,866 |
|---|
EXAMINE
  VARIABLES=LnRH BY DEPOTSTATUS
  /PLOT BOXPLOT STEMLEAF
  /COMPARE GROUP
  /PERCENTILES(5,10,25,50,75,90,95) HAVERAGE
  /STATISTICS DESCRIPTIVES
  /CINTERVAL 95
  /MISSING LISTWISE
  /NOTOTAL.
Explore
Notes
| Output Created |
23-AUG-2005 13:55:40 |
|---|
| Comments |
|
|---|
| Input |
Data |
W:\sag\1243\Data\Databearbejdning\SPSS\Dataset\Hyp3.sav |
|---|
| Filter |
BENYTTELSE>0 (FILTER) |
|---|
| Weight |
<none> |
|---|
| Split File |
<none> |
|---|
| N of Rows in Working Data File |
593820 |
|---|
| Missing Value Handling |
Definition of Missing |
User-defined missing values for dependent variables are treated as missing. |
|---|
| Cases Used |
Statistics are based on cases with no missing values for any dependent variable or factor used. |
|---|
| Syntax |
EXAMINE
VARIABLES=LnRH BY DEPOTSTATUS
/PLOT BOXPLOT STEMLEAF
/COMPARE GROUP
/PERCENTILES(5,10,25,50,75,90,95) HAVERAGE
/STATISTICS DESCRIPTIVES
/CINTERVAL 95
/MISSING LISTWISE
/NOTOTAL.
|
|---|
| Resources |
Elapsed Time |
0:01:25,61 |
|---|
Depotstatus
ln (relativ handelspris)
Stem-and-Leaf Plots
ln (relativ handelspris) Stem-and-Leaf Plot for
DEPOTSTATUS= Mistanke

 Frequency    Stem &  Leaf

   107,00 Extremes    (=<-,47)
     7,00       -4 .  5&
    22,00       -4 .  024&
    13,00       -3 .  7&
    26,00       -3 .  0123&
    45,00       -2 .  55667889
    47,00       -2 .  0112344
    46,00       -1 .  56677889
    93,00       -1 .  000111122233344
   128,00       -0 .  555566667777778888899
   150,00       -0 .  0000111111222233333444444
   242,00        0 .  0000000000000011111111222223333334444444
   215,00        0 .  555555556666666677777788888888999999
   242,00        1 .  0000000001111111222222333333333444444444
   184,00        1 .  5555566666667777778888889999999
   213,00        2 .  000000001111112222222333333333444444
   155,00        2 .  5555555566677777788889999
   131,00        3 .  000001111112223334444
    95,00        3 .  555666667788999
    64,00        4 .  0011122334
    57,00        4 .  5566678899
    35,00        5 .  01234
    24,00        5 .  569&
    27,00        6 .  01234
    19,00        6 .  689&
     9,00        7 .  &
   126,00 Extremes    (>=,74)

 Stem width:       ,10
 Each leaf:       6 case(s)


 & denotes fractional leaves.
ln (relativ handelspris) Stem-and-Leaf Plot for
DEPOTSTATUS= Forurenet

 Frequency    Stem &  Leaf

   110,00 Extremes    (=<-,41)
     4,00       -4 .  0
     8,00       -3 .  5&
    21,00       -3 .  0134&
    14,00       -2 .  67&
    32,00       -2 .  01234
    42,00       -1 .  56689&
    62,00       -1 .  001122344
   103,00       -0 .  555556667778899
   148,00       -0 .  000011112222233334444
   236,00        0 .  0000000001111112222233333334444444
   218,00        0 .  5555556666666777777888888999999
   255,00        1 .  0000000111111112222222333333344444444
   287,00        1 .  55555556666666667777777777888888889999999
   227,00        2 .  00000001111112222222333333344444
   187,00        2 .  555556666667777777888899999
   143,00        3 .  000011111222223333444
    89,00        3 .  5556677788899
    82,00        4 .  00111223344
    53,00        4 .  5567789
    42,00        5 .  011234
    41,00        5 .  5567789
    37,00        6 .  01234
    37,00        6 .  56789
    33,00        7 .  012344
     5,00        7 .  5
   168,00 Extremes    (>=,76)

 Stem width:       ,10
 Each leaf:       7 case(s)


 & denotes fractional leaves.
ln (relativ handelspris) Stem-and-Leaf Plot for
DEPOTSTATUS= Oprenset

 Frequency    Stem &  Leaf

    40,00 Extremes    (=<-,40)
     9,00       -3 .  01&
    16,00       -2 .  234&&
    29,00       -1 .  034569&
    44,00       -0 .  012234568&
   136,00        0 .  00000111222333444445567778889999
   146,00        1 .  000001122223334444555566666777888999
   111,00        2 .  001112234445556666677888899
    69,00        3 .  0011234445667899
    35,00        4 .  0123468&
    19,00        5 .  019&&
    12,00        6 .  29&
     2,00        7 .  &
    46,00 Extremes    (>=,73)

 Stem width:       ,10
 Each leaf:       4 case(s)


 & denotes fractional leaves.
ln (relativ handelspris) Stem-and-Leaf Plot for
DEPOTSTATUS= Restforurening

 Frequency    Stem &  Leaf

    13,00 Extremes    (=<-,48)
     1,00       -4 .  &
     6,00       -3 .  5&
     8,00       -2 .  8&
    42,00       -1 .  000133479&
    95,00       -0 .  0011222223334445567789
   131,00        0 .  000001112223334555566667778899
   111,00        1 .  00001111222333444556677899
    73,00        2 .  0012223344566789
    32,00        3 .  124789&&
    19,00        4 .  1358&
    16,00        5 .  246&&
     4,00        6 .  &
    39,00 Extremes    (>=,63)

 Stem width:       ,10
 Each leaf:       4 case(s)


 & denotes fractional leaves.
ln (relativ handelspris) Stem-and-Leaf Plot for
DEPOTSTATUS= Undersřgt uden fund
Frequency Stem & Leaf
9,00 Extremes (=<-,29)
3,00 -2 . 778
5,00 -2 . 03344
5,00 -1 . 55699
9,00 -1 . 012244444
11,00 -0 . 55557788889
24,00 -0 . 000011112222222233333344
39,00 0 . 000000000001111111122222333333344444444
39,00 0 . 555555556666677777778888888889999999999
28,00 1 . 0000001112222223334444444444
27,00 1 . 555555566666777778888888999
11,00 2 . 00111223444
8,00 2 . 55556788
13,00 3 . 0012233344444
4,00 3 . 6789
2,00 4 . 24
2,00 4 . 67
22,00 Extremes (>=,48)
Stem width: ,10
Each leaf: 1 case(s)
ln (relativ handelspris) Stem-and-Leaf Plot for
DEPOTSTATUS= Ikke forurenet

 Frequency    Stem &  Leaf

 21310,00 Extremes    (=<-,36)
   356,00       -3 .  &
  3848,00       -3 .  013&
  4976,00       -2 .  56789
  6894,00       -2 .  01234
 10428,00       -1 .  5566789
 14988,00       -1 .  00011223344
 21973,00       -0 .  5555666777888999
 32032,00       -0 .  0000111112222233334444
 57360,00        0 .  000000000001111111222222223333333344444444
 59649,00        0 .  5555555566666666677777777888888888999999999
 63514,00        1 .  0000000001111111112222222223333333333444444444
 61932,00        1 .  555555555666666666777777777888888888999999999
 54363,00        2 .  00000000111111112222222233333334444444
 43798,00        2 .  55555556666666777777888888999999
 34450,00        3 .  0000001111122222333334444
 25145,00        3 .  555566667777888999
 18153,00        4 .  0001112223344
 12848,00        4 .  5566778899
  8992,00        5 .  01234
  6403,00        5 .  56789
  4662,00        6 .  01234
   823,00        6 .  5&
 18152,00 Extremes    (>=,66)

 Stem width:       ,10
 Each leaf:    1381 case(s)


 & denotes fractional leaves.
USE ALL.
COMPUTE filter_$=((BENYTTELSE>0) AND ((LnRH>=-0.47 and LnRH<=0.74 and DEPOTSTATU
S=1) or
(LnRH>=-0.41 and LnRH<=0.76 and DEPOTSTATUS=2) or
(LnRH>=-0.40 and LnRH<=0.73 and DEPOTSTATUS=3) or
(LnRH>=-0.48 and LnRH<=0.63 and DEPOTSTATUS=4) or
(LnRH>=-0.29 and LnRH<=0.48 and DEPOTSTATUS=5) or
(LnRH>=-0.36 and LnRH<=0.66 and DEPOTSTATUS=6))).
VARIABLE LABEL filter_$ '(LnRH>=-0.47 and LnRH<=0.74 and DEPOTSTATUS=1) or'+
'(LnRH>=-0.41 and LnRH<=0.75 and DEPOTSTATUS=2) or'+
'(LnRH>=-0.40 and LnRH... (FILTER)'.
VALUE LABELS filter_$ 0 'Not Selected' 1 'Selected'.
FORMAT filter_$ (f1.0).
FILTER BY filter_$.
EXECUTE .
SUMMARIZE
/TABLES=LnRH BY DEPOTSTATUS
/FORMAT=NOLIST TOTAL
/TITLE='Afskĺret med depotstatusvis stem-leaf-plot'
/MISSING=VARIABLE
/CELLS=COUNT MEAN MEDIAN MIN MAX STDDEV KURT SKEW .
Summarize
Notes
| Output Created |
23-AUG-2005 13:59:41 |
|---|
| Comments |
|
|---|
| Input |
Data |
W:\sag\1243\Data\Databearbejdning\SPSS\Dataset\Hyp3.sav |
|---|
| Filter |
(LnRH>=-0.47 and LnRH<=0.74 and DEPOTSTATUS=1) or(LnRH>=-0.41 and LnRH<=0.75 and DEPOTSTATUS=2) or(LnRH>=-0.40 and LnRH... (FILTER) |
|---|
| Weight |
<none> |
|---|
| Split File |
<none> |
|---|
| N of Rows in Working Data File |
553970 |
|---|
| Missing Value Handling |
Definition of Missing |
For each dependent variable in a table, user-defined missing values for the dependent and all grouping variables are treated as missing. |
|---|
| Cases Used |
Cases used for each table have no missing values in any independent variable, and not all dependent variables have missing values. |
|---|
| Syntax |
SUMMARIZE
/TABLES=LnRH BY DEPOTSTATUS
/FORMAT=NOLIST TOTAL
/TITLE='Afskĺret med depotstatusvis stem-leaf-plot'
/MISSING=VARIABLE
/CELLS=COUNT MEAN MEDIAN MIN MAX STDDEV KURT SKEW .
|
|---|
| Resources |
Elapsed Time |
0:00:13,48 |
|---|
Case Processing Summary
|
Cases |
|---|
| Included |
Excluded |
Total |
|---|
| N |
Percent |
N |
Percent |
N |
Percent |
|---|
| ln (relativ handelspris) * Depotstatus |
553970 |
100,0% |
0 |
,0% |
553970 |
100,0% |
|---|
Afskĺret med depotstatusvis stem-leaf-plot
ln (relativ handelspris)
| Depotstatus |
N |
Mean |
Median |
Minimum |
Maximum |
Std. Deviation |
Kurtosis |
Skewness |
|---|
| Mistanke |
2292 |
,1286 |
,1237 |
-,46 |
,74 |
,21855 |
,190 |
,058 |
|---|
| Forurenet |
2411 |
,1752 |
,1622 |
-,41 |
,76 |
,21279 |
,358 |
,376 |
|---|
| Oprenset |
629 |
,1621 |
,1560 |
-,40 |
,72 |
,19689 |
,306 |
,089 |
|---|
| Restforurening |
538 |
,1045 |
,0840 |
-,40 |
,63 |
,18352 |
,428 |
,421 |
|---|
| Undersřgt uden fund |
230 |
,0822 |
,0790 |
-,29 |
,47 |
,14559 |
,257 |
,082 |
|---|
| Ikke forurenet |
547870 |
,1543 |
,1482 |
-,36 |
,66 |
,18236 |
,070 |
,077 |
|---|
| Total |
553970 |
,1542 |
,1481 |
-,46 |
,76 |
,18270 |
,079 |
,079 |
|---|
SUMMARIZE
/TABLES=LnRH BY BENYTTELSE
/FORMAT=NOLIST TOTAL
/TITLE='Afskĺret med depotstatusvis stem-leaf-plot'
/MISSING=VARIABLE
/CELLS=COUNT MEAN MEDIAN MIN MAX STDDEV KURT SKEW .
Summarize
Notes
| Output Created |
23-AUG-2005 13:59:54 |
|---|
| Comments |
|
|---|
| Input |
Data |
W:\sag\1243\Data\Databearbejdning\SPSS\Dataset\Hyp3.sav |
|---|
| Filter |
(LnRH>=-0.47 and LnRH<=0.74 and DEPOTSTATUS=1) or(LnRH>=-0.41 and LnRH<=0.75 and DEPOTSTATUS=2) or(LnRH>=-0.40 and LnRH... (FILTER) |
|---|
| Weight |
<none> |
|---|
| Split File |
<none> |
|---|
| N of Rows in Working Data File |
553970 |
|---|
| Missing Value Handling |
Definition of Missing |
For each dependent variable in a table, user-defined missing values for the dependent and all grouping variables are treated as missing. |
|---|
| Cases Used |
Cases used for each table have no missing values in any independent variable, and not all dependent variables have missing values. |
|---|
| Syntax |
SUMMARIZE
/TABLES=LnRH BY BENYTTELSE
/FORMAT=NOLIST TOTAL
/TITLE='Afskĺret med depotstatusvis stem-leaf-plot'
/MISSING=VARIABLE
/CELLS=COUNT MEAN MEDIAN MIN MAX STDDEV KURT SKEW .
|
|---|
| Resources |
Elapsed Time |
0:00:13,51 |
|---|
Case Processing Summary
|
Cases |
|---|
| Included |
Excluded |
Total |
|---|
| N |
Percent |
N |
Percent |
N |
Percent |
|---|
| ln (relativ handelspris) * Boligbenyttelse |
553970 |
100,0% |
0 |
,0% |
553970 |
100,0% |
|---|
Afskĺret med depotstatusvis stem-leaf-plot
ln (relativ handelspris)
| Boligbenyttelse |
N |
Mean |
Median |
Minimum |
Maximum |
Std. Deviation |
Kurtosis |
Skewness |
|---|
| Hus |
426179 |
,1431 |
,1379 |
-,46 |
,76 |
,18095 |
,117 |
,065 |
|---|
| Etagelejlighed |
127791 |
,1913 |
,1823 |
-,46 |
,76 |
,18362 |
-,072 |
,105 |
|---|
| Total |
553970 |
,1542 |
,1481 |
-,46 |
,76 |
,18270 |
,079 |
,079 |
|---|
SUMMARIZE
/TABLES=LnRH BY DEPOTSTATUS BY BENYTTELSE
/FORMAT=NOLIST TOTAL
/TITLE='Afskĺret med depotstatusvis stem-leaf-plot'
/MISSING=VARIABLE
/CELLS=COUNT MEAN MEDIAN MIN MAX STDDEV KURT SKEW .
Summarize
Notes
| Output Created |
23-AUG-2005 14:00:08 |
|---|
| Comments |
|
|---|
| Input |
Data |
W:\sag\1243\Data\Databearbejdning\SPSS\Dataset\Hyp3.sav |
|---|
| Filter |
(LnRH>=-0.47 and LnRH<=0.74 and DEPOTSTATUS=1) or(LnRH>=-0.41 and LnRH<=0.75 and DEPOTSTATUS=2) or(LnRH>=-0.40 and LnRH... (FILTER) |
|---|
| Weight |
<none> |
|---|
| Split File |
<none> |
|---|
| N of Rows in Working Data File |
553970 |
|---|
| Missing Value Handling |
Definition of Missing |
For each dependent variable in a table, user-defined missing values for the dependent and all grouping variables are treated as missing. |
|---|
| Cases Used |
Cases used for each table have no missing values in any independent variable, and not all dependent variables have missing values. |
|---|
| Syntax |
SUMMARIZE
/TABLES=LnRH BY DEPOTSTATUS BY BENYTTELSE
/FORMAT=NOLIST TOTAL
/TITLE='Afskĺret med depotstatusvis stem-leaf-plot'
/MISSING=VARIABLE
/CELLS=COUNT MEAN MEDIAN MIN MAX STDDEV KURT SKEW .
|
|---|
| Resources |
Elapsed Time |
0:00:27,70 |
|---|
Case Processing Summary
|
Cases |
|---|
| Included |
Excluded |
Total |
|---|
| N |
Percent |
N |
Percent |
N |
Percent |
|---|
| ln (relativ handelspris) * Depotstatus * Boligbenyttelse |
553970 |
100,0% |
0 |
,0% |
553970 |
100,0% |
|---|
Afskĺret med depotstatusvis stem-leaf-plot
ln (relativ handelspris)
| Depotstatus |
Boligbenyttelse |
N |
Mean |
Median |
Minimum |
Maximum |
Std. Deviation |
Kurtosis |
Skewness |
|---|
| Mistanke |
Hus |
922 |
,0743 |
,0654 |
-,46 |
,73 |
,23833 |
-,261 |
,070 |
|---|
| Etagelejlighed |
1370 |
,1652 |
,1484 |
-,46 |
,74 |
,19593 |
,417 |
,325 |
|---|
| Total |
2292 |
,1286 |
,1237 |
-,46 |
,74 |
,21855 |
,190 |
,058 |
|---|
| Forurenet |
Hus |
544 |
,1170 |
,0900 |
-,41 |
,76 |
,24234 |
-,169 |
,357 |
|---|
| Etagelejlighed |
1867 |
,1922 |
,1754 |
-,36 |
,76 |
,20028 |
,542 |
,524 |
|---|
| Total |
2411 |
,1752 |
,1622 |
-,41 |
,76 |
,21279 |
,358 |
,376 |
|---|
| Oprenset |
Hus |
277 |
,1153 |
,0885 |
-,40 |
,71 |
,20965 |
,390 |
,378 |
|---|
| Etagelejlighed |
352 |
,1989 |
,1825 |
-,35 |
,72 |
,17808 |
,581 |
-,024 |
|---|
| Total |
629 |
,1621 |
,1560 |
-,40 |
,72 |
,19689 |
,306 |
,089 |
|---|
| Restforurening |
Hus |
121 |
,1122 |
,0918 |
-,40 |
,61 |
,19384 |
,594 |
-,009 |
|---|
| Etagelejlighed |
417 |
,1023 |
,0806 |
-,40 |
,63 |
,18060 |
,404 |
,568 |
|---|
| Total |
538 |
,1045 |
,0840 |
-,40 |
,63 |
,18352 |
,428 |
,421 |
|---|
| Undersřgt uden fund |
Hus |
127 |
,0783 |
,0786 |
-,29 |
,47 |
,16261 |
,081 |
,036 |
|---|
| Etagelejlighed |
103 |
,0870 |
,0793 |
-,20 |
,39 |
,12199 |
-,072 |
,303 |
|---|
| Total |
230 |
,0822 |
,0790 |
-,29 |
,47 |
,14559 |
,257 |
,082 |
|---|
| Ikke forurenet |
Hus |
424188 |
,1433 |
,1381 |
-,36 |
,66 |
,18066 |
,114 |
,066 |
|---|
| Etagelejlighed |
123682 |
,1919 |
,1834 |
-,36 |
,66 |
,18317 |
-,093 |
,093 |
|---|
| Total |
547870 |
,1543 |
,1482 |
-,36 |
,66 |
,18236 |
,070 |
,077 |
|---|
| Total |
Hus |
426179 |
,1431 |
,1379 |
-,46 |
,76 |
,18095 |
,117 |
,065 |
|---|
| Etagelejlighed |
127791 |
,1913 |
,1823 |
-,46 |
,76 |
,18362 |
-,072 |
,105 |
|---|
| Total |
553970 |
,1542 |
,1481 |
-,46 |
,76 |
,18270 |
,079 |
,079 |
|---|
EXAMINE
  VARIABLES=LnRH BY DEPOTSTATUS
  /PLOT BOXPLOT HISTOGRAM
  /COMPARE GROUP
  /PERCENTILES(5,10,25,50,75,90,95) HAVERAGE
  /STATISTICS DESCRIPTIVES
  /CINTERVAL 95
  /MISSING LISTWISE
  /NOTOTAL.
Explore
Notes
| Output Created |
23-AUG-2005 14:00:36 |
|---|
| Comments |
|
|---|
| Input |
Data |
W:\sag\1243\Data\Databearbejdning\SPSS\Dataset\Hyp3.sav |
|---|
| Filter |
(LnRH>=-0.47 and LnRH<=0.74 and DEPOTSTATUS=1) or(LnRH>=-0.41 and LnRH<=0.75 and DEPOTSTATUS=2) or(LnRH>=-0.40 and LnRH... (FILTER) |
|---|
| Weight |
<none> |
|---|
| Split File |
<none> |
|---|
| N of Rows in Working Data File |
553970 |
|---|
| Missing Value Handling |
Definition of Missing |
User-defined missing values for dependent variables are treated as missing. |
|---|
| Cases Used |
Statistics are based on cases with no missing values for any dependent variable or factor used. |
|---|
| Syntax |
EXAMINE
VARIABLES=LnRH BY DEPOTSTATUS
/PLOT BOXPLOT HISTOGRAM
/COMPARE GROUP
/PERCENTILES(5,10,25,50,75,90,95) HAVERAGE
/STATISTICS DESCRIPTIVES
/CINTERVAL 95
/MISSING LISTWISE
/NOTOTAL.
|
|---|
| Resources |
Elapsed Time |
0:01:09,95 |
|---|
Depotstatus
ln (relativ handelspris)
Histograms
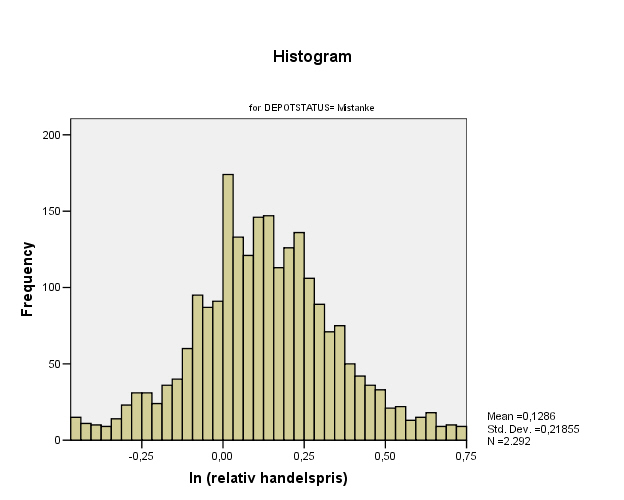
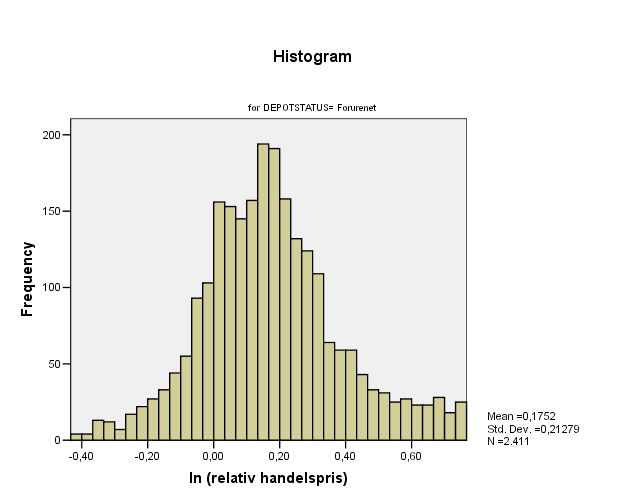
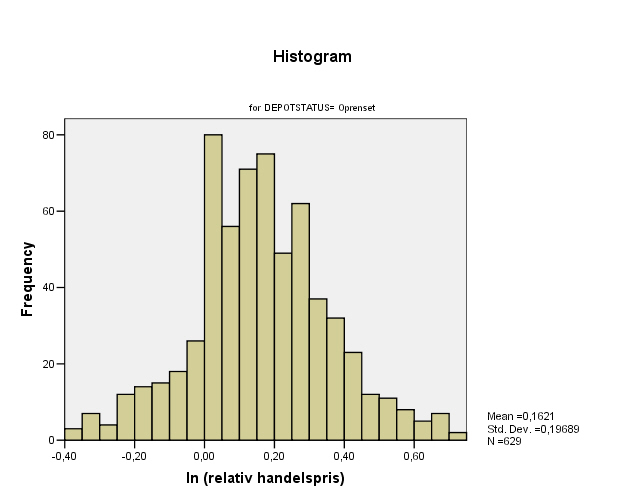
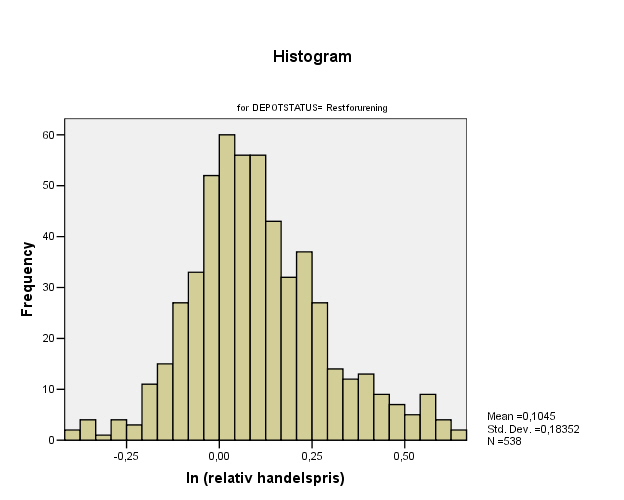
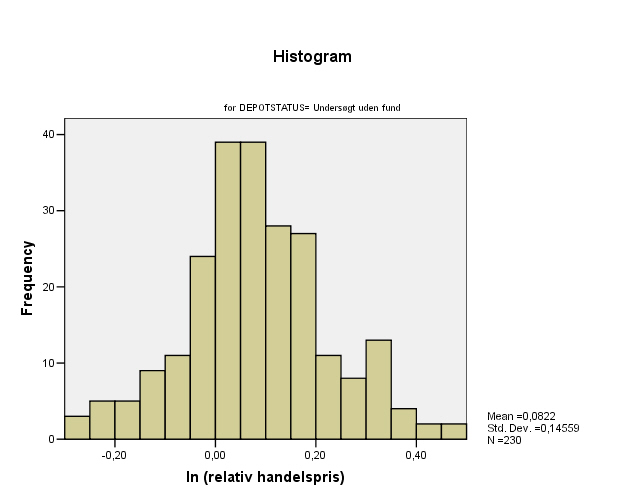
UNIANOVA
  LnRH  BY DEPOTSTATUS BENYTTELSE
  /METHOD = SSTYPE(3)
  /INTERCEPT = EXCLUDE
  /PLOT = PROFILE( DEPOTSTATUS*BENYTTELSE )
  /EMMEANS = TABLES(DEPOTSTATUS*BENYTTELSE)
  /PRINT = DESCRIPTIVE HOMOGENEITY
  /PLOT = SPREADLEVEL
  /CRITERIA = ALPHA(.10)
  /DESIGN = DEPOTSTATUS BENYTTELSE DEPOTSTATUS*BENYTTELSE .
Univariate Analysis of Variance
Notes
| Output Created |
23-AUG-2005 14:01:46 |
|---|
| Comments |
|
|---|
| Input |
Data |
W:\sag\1243\Data\Databearbejdning\SPSS\Dataset\Hyp3.sav |
|---|
| Filter |
(LnRH>=-0.47 and LnRH<=0.74 and DEPOTSTATUS=1) or(LnRH>=-0.41 and LnRH<=0.75 and DEPOTSTATUS=2) or(LnRH>=-0.40 and LnRH... (FILTER) |
|---|
| Weight |
<none> |
|---|
| Split File |
<none> |
|---|
| N of Rows in Working Data File |
553970 |
|---|
| Missing Value Handling |
Definition of Missing |
User-defined missing values are treated as missing. |
|---|
| Cases Used |
Statistics are based on all cases with valid data for all variables in the model. |
|---|
| Syntax |
UNIANOVA
LnRH BY DEPOTSTATUS BENYTTELSE
/METHOD = SSTYPE(3)
/INTERCEPT = EXCLUDE
/PLOT = PROFILE( DEPOTSTATUS*BENYTTELSE )
/EMMEANS = TABLES(DEPOTSTATUS*BENYTTELSE)
/PRINT = DESCRIPTIVE HOMOGENEITY
/PLOT = SPREADLEVEL
/CRITERIA = ALPHA(.10)
/DESIGN = DEPOTSTATUS BENYTTELSE DEPOTSTATUS*BENYTTELSE .
|
|---|
| Resources |
Elapsed Time |
0:00:16,84 |
|---|
Between-Subjects Factors
|
|
Value Label |
N |
|---|
| Depotstatus |
1 |
Mistanke |
2292 |
|---|
| 2 |
Forurenet |
2411 |
|---|
| 3 |
Oprenset |
629 |
|---|
| 4 |
Restforurening |
538 |
|---|
| 5 |
Undersřgt uden fund |
230 |
|---|
| 6 |
Ikke forurenet |
547870 |
|---|
| Boligbenyttelse |
1 |
Hus |
426179 |
|---|
| 2 |
Etagelejlighed |
127791 |
|---|
Descriptive Statistics
Dependent Variable: ln (relativ handelspris)
| Depotstatus |
Boligbenyttelse |
Mean |
Std. Deviation |
N |
|---|
| Mistanke |
Hus |
,0743 |
,23833 |
922 |
|---|
| Etagelejlighed |
,1652 |
,19593 |
1370 |
|---|
| Total |
,1286 |
,21855 |
2292 |
|---|
| Forurenet |
Hus |
,1170 |
,24234 |
544 |
|---|
| Etagelejlighed |
,1922 |
,20028 |
1867 |
|---|
| Total |
,1752 |
,21279 |
2411 |
|---|
| Oprenset |
Hus |
,1153 |
,20965 |
277 |
|---|
| Etagelejlighed |
,1989 |
,17808 |
352 |
|---|
| Total |
,1621 |
,19689 |
629 |
|---|
| Restforurening |
Hus |
,1122 |
,19384 |
121 |
|---|
| Etagelejlighed |
,1023 |
,18060 |
417 |
|---|
| Total |
,1045 |
,18352 |
538 |
|---|
| Undersřgt uden fund |
Hus |
,0783 |
,16261 |
127 |
|---|
| Etagelejlighed |
,0870 |
,12199 |
103 |
|---|
| Total |
,0822 |
,14559 |
230 |
|---|
| Ikke forurenet |
Hus |
,1433 |
,18066 |
424188 |
|---|
| Etagelejlighed |
,1919 |
,18317 |
123682 |
|---|
| Total |
,1543 |
,18236 |
547870 |
|---|
| Total |
Hus |
,1431 |
,18095 |
426179 |
|---|
| Etagelejlighed |
,1913 |
,18362 |
127791 |
|---|
| Total |
,1542 |
,18270 |
553970 |
|---|
Levene's Test of Equality of Error Variances(a)
Dependent Variable: ln (relativ handelspris)
| F |
df1 |
df2 |
Sig. |
|---|
| 41,316 |
11 |
553958 |
,000 |
| Tests the null hypothesis that the error variance of the dependent variable is equal across groups. | | a Design: DEPOTSTATUS+BENYTTELSE+DEPOTSTATUS * BENYTTELSE |
Tests of Between-Subjects Effects
Dependent Variable: ln (relativ handelspris)
| Source |
Type III Sum of Squares |
df |
Mean Square |
F |
Sig. |
|---|
| Model |
13407,616(a) |
12 |
1117,301 |
33911,232 |
,000 |
|---|
| DEPOTSTATUS |
8,329 |
5 |
1,666 |
50,559 |
,000 |
|---|
| BENYTTELSE |
2,270 |
1 |
2,270 |
68,890 |
,000 |
|---|
| DEPOTSTATUS * BENYTTELSE |
1,873 |
5 |
,375 |
11,371 |
,000 |
|---|
| Error |
18251,712 |
553958 |
,033 |
|
|
|---|
| Total |
31659,328 |
553970 |
|
|
|
|---|
| a R Squared = ,423 (Adjusted R Squared = ,423) |
Estimated Marginal Means
Depotstatus * Boligbenyttelse
Dependent Variable: ln (relativ handelspris)
| Depotstatus |
Boligbenyttelse |
Mean |
Std. Error |
90% Confidence Interval |
|---|
| Lower Bound |
Upper Bound |
|---|
| Mistanke |
Hus |
,074 |
,006 |
,064 |
,084 |
|---|
| Etagelejlighed |
,165 |
,005 |
,157 |
,173 |
|---|
| Forurenet |
Hus |
,117 |
,008 |
,104 |
,130 |
|---|
| Etagelejlighed |
,192 |
,004 |
,185 |
,199 |
|---|
| Oprenset |
Hus |
,115 |
,011 |
,097 |
,133 |
|---|
| Etagelejlighed |
,199 |
,010 |
,183 |
,215 |
|---|
| Restforurening |
Hus |
,112 |
,017 |
,085 |
,139 |
|---|
| Etagelejlighed |
,102 |
,009 |
,088 |
,117 |
|---|
| Undersřgt uden fund |
Hus |
,078 |
,016 |
,052 |
,105 |
|---|
| Etagelejlighed |
,087 |
,018 |
,058 |
,116 |
|---|
| Ikke forurenet |
Hus |
,143 |
,000 |
,143 |
,144 |
|---|
| Etagelejlighed |
,192 |
,001 |
,191 |
,193 |
|---|
Spread-versus-Level Plots
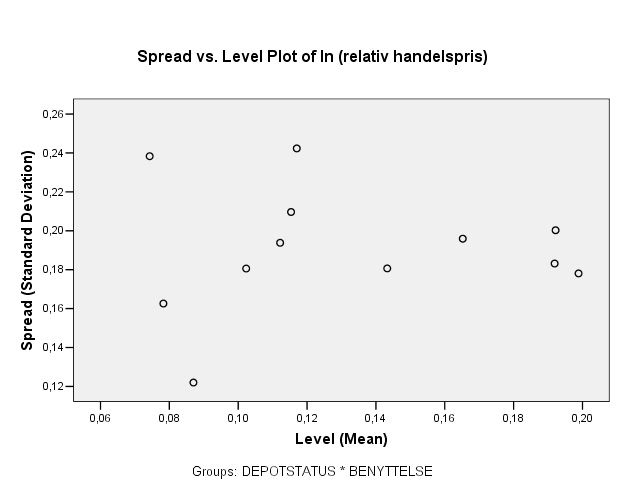
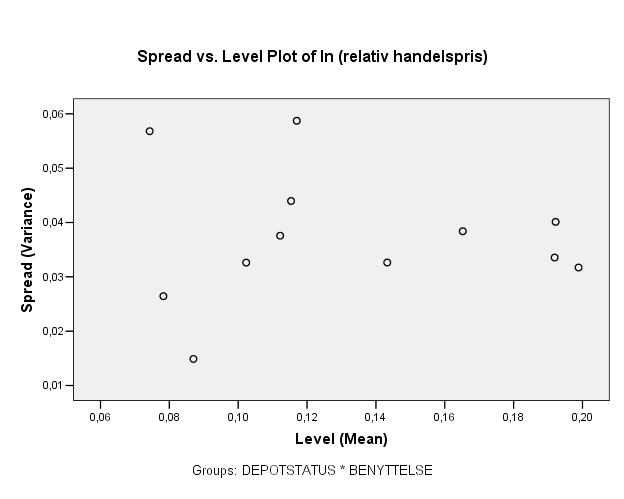
Profile Plots
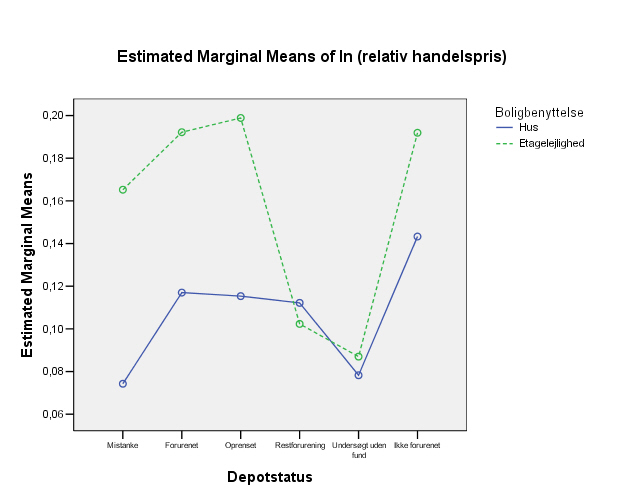
GET
FILE='W:\sag\1243\Data\Databearbejdning\SPSS\Dataset\Hyp4.sav'.
*Define Variable Properties.
*DEPOTSTATUS.
VARIABLE LABELS DEPOTSTATUS 'Depotstatus'.
VALUE LABELS DEPOTSTATUS
1 'Mistanke'
2 'Forurenet'
3 'Oprenset'
4 'Restfourening'
5 'Undersřgt uden fund'
6 'Ikke forurenet' .
*DATABASE.
VARIABLE LABELS DATABASE 'Ordning (database)'.
VALUE LABELS DATABASE
'IF' 'Ikke forurenet'
'OM' 'OM'
'ROKA' 'ROKA'
'VT' 'VTO' .
*lnRH.
VARIABLE LABELS lnRH 'ln (relativ handelspris)'.
FORMATS lnRH (F8.2).
EXECUTE.
SAVE OUTFILE='W:\sag\1243\Data\Databearbejdning\SPSS\Dataset\hyp4.sav'
/COMPRESSED.
GET
FILE='W:\sag\1243\Data\Databearbejdning\SPSS\Dataset\Hyp4.sav'.
SUMMARIZE
/TABLES=LnRH BY DEPOTSTATUS
/FORMAT=NOLIST TOTAL
/TITLE='Alle observationer'
/MISSING=VARIABLE
/CELLS=COUNT MEAN MEDIAN MIN MAX STDDEV KURT SKEW .
Summarize
Notes
| Output Created |
23-AUG-2005 14:29:17 |
|---|
| Comments |
|
|---|
| Input |
Data |
W:\sag\1243\Data\Databearbejdning\SPSS\Dataset\Hyp4.sav |
|---|
| Filter |
<none> |
|---|
| Weight |
<none> |
|---|
| Split File |
<none> |
|---|
| N of Rows in Working Data File |
605407 |
|---|
| Missing Value Handling |
Definition of Missing |
For each dependent variable in a table, user-defined missing values for the dependent and all grouping variables are treated as missing. |
|---|
| Cases Used |
Cases used for each table have no missing values in any independent variable, and not all dependent variables have missing values. |
|---|
| Syntax |
SUMMARIZE
/TABLES=LnRH BY DEPOTSTATUS
/FORMAT=NOLIST TOTAL
/TITLE='Alle observationer'
/MISSING=VARIABLE
/CELLS=COUNT MEAN MEDIAN MIN MAX STDDEV KURT SKEW .
|
|---|
| Resources |
Elapsed Time |
0:00:13,70 |
|---|
Case Processing Summary
|
Cases |
|---|
| Included |
Excluded |
Total |
|---|
| N |
Percent |
N |
Percent |
N |
Percent |
|---|
| ln (relativ handelspris) * Depotstatus |
605407 |
100,0% |
0 |
,0% |
605407 |
100,0% |
|---|
Alle observationer
ln (relativ handelspris)
| Depotstatus |
N |
Mean |
Median |
Minimum |
Maximum |
Std. Deviation |
Kurtosis |
Skewness |
|---|
| Mistanke |
2600 |
,1191 |
,1276 |
-11,51 |
3,50 |
,46618 |
159,302 |
-6,941 |
|---|
| Forurenet |
2727 |
,1916 |
,1647 |
-4,28 |
3,86 |
,42012 |
18,490 |
,104 |
|---|
| Oprenset |
730 |
,1589 |
,1596 |
-5,14 |
2,82 |
,48870 |
32,532 |
-2,878 |
|---|
| Restfourening |
601 |
,1138 |
,1001 |
-6,49 |
3,62 |
,52662 |
55,603 |
-4,101 |
|---|
| Undersřgt uden fund |
267 |
,0985 |
,0861 |
-2,77 |
2,05 |
,36894 |
29,770 |
-2,981 |
|---|
| Ikke forurenet |
598482 |
,1410 |
,1476 |
-15,98 |
5,98 |
,34408 |
131,593 |
-4,955 |
|---|
| Total |
605407 |
,1411 |
,1475 |
-15,98 |
5,98 |
,34554 |
130,851 |
-4,934 |
|---|
SUMMARIZE
  /TABLES=LnRH  BY DATABASE
  /FORMAT=NOLIST TOTAL
  /TITLE='Alle observationer'
  /MISSING=VARIABLE
  /CELLS=COUNT MEAN MEDIAN MIN MAX STDDEV KURT SKEW .
Summarize
Notes
| Output Created |
23-AUG-2005 14:29:31 |
|---|
| Comments |
|
|---|
| Input |
Data |
W:\sag\1243\Data\Databearbejdning\SPSS\Dataset\Hyp4.sav |
|---|
| Filter |
<none> |
|---|
| Weight |
<none> |
|---|
| Split File |
<none> |
|---|
| N of Rows in Working Data File |
605407 |
|---|
| Missing Value Handling |
Definition of Missing |
For each dependent variable in a table, user-defined missing values for the dependent and all grouping variables are treated as missing. |
|---|
| Cases Used |
Cases used for each table have no missing values in any independent variable, and not all dependent variables have missing values. |
|---|
| Syntax |
SUMMARIZE
/TABLES=LnRH BY DATABASE
/FORMAT=NOLIST TOTAL
/TITLE='Alle observationer'
/MISSING=VARIABLE
/CELLS=COUNT MEAN MEDIAN MIN MAX STDDEV KURT SKEW .
|
|---|
| Resources |
Elapsed Time |
0:00:12,28 |
|---|
Case Processing Summary
|
Cases |
|---|
| Included |
Excluded |
Total |
|---|
| N |
Percent |
N |
Percent |
N |
Percent |
|---|
| ln (relativ handelspris) * Ordning (database) |
605407 |
100,0% |
0 |
,0% |
605407 |
100,0% |
|---|
Alle observationer
ln (relativ handelspris)
| Ordning (database) |
N |
Mean |
Median |
Minimum |
Maximum |
Std. Deviation |
Kurtosis |
Skewness |
|---|
| Ikke forurenet |
598482 |
,1410 |
,1476 |
-15,98 |
5,98 |
,34408 |
131,593 |
-4,955 |
|---|
| OM |
2732 |
,1311 |
,1286 |
-3,69 |
3,50 |
,39219 |
18,113 |
-1,079 |
|---|
| ROKA |
3851 |
,1650 |
,1506 |
-11,51 |
3,86 |
,49952 |
101,439 |
-4,775 |
|---|
| VTO |
342 |
,1446 |
,1226 |
-1,61 |
1,78 |
,37849 |
4,941 |
-,479 |
|---|
| Total |
605407 |
,1411 |
,1475 |
-15,98 |
5,98 |
,34554 |
130,851 |
-4,934 |
|---|
SUMMARIZE
  /TABLES=LnRH  BY DEPOTSTATUS BY DATABASE
  /FORMAT=NOLIST TOTAL
  /TITLE='Alle observationer'
  /MISSING=VARIABLE
  /CELLS=COUNT MEAN MEDIAN MIN MAX STDDEV KURT SKEW .
Summarize
Notes
| Output Created |
23-AUG-2005 14:29:43 |
|---|
| Comments |
|
|---|
| Input |
Data |
W:\sag\1243\Data\Databearbejdning\SPSS\Dataset\Hyp4.sav |
|---|
| Filter |
<none> |
|---|
| Weight |
<none> |
|---|
| Split File |
<none> |
|---|
| N of Rows in Working Data File |
605407 |
|---|
| Missing Value Handling |
Definition of Missing |
For each dependent variable in a table, user-defined missing values for the dependent and all grouping variables are treated as missing. |
|---|
| Cases Used |
Cases used for each table have no missing values in any independent variable, and not all dependent variables have missing values. |
|---|
| Syntax |
SUMMARIZE
/TABLES=LnRH BY DEPOTSTATUS BY DATABASE
/FORMAT=NOLIST TOTAL
/TITLE='Alle observationer'
/MISSING=VARIABLE
/CELLS=COUNT MEAN MEDIAN MIN MAX STDDEV KURT SKEW .
|
|---|
| Resources |
Elapsed Time |
0:00:28,59 |
|---|
Case Processing Summary
|
Cases |
|---|
| Included |
Excluded |
Total |
|---|
| N |
Percent |
N |
Percent |
N |
Percent |
|---|
| ln (relativ handelspris) * Depotstatus * Ordning (database) |
605407 |
100,0% |
0 |
,0% |
605407 |
100,0% |
|---|
Alle observationer
ln (relativ handelspris)
| Depotstatus |
Ordning (database) |
N |
Mean |
Median |
Minimum |
Maximum |
Std. Deviation |
Kurtosis |
Skewness |
|---|
| Mistanke |
OM |
2345 |
,1300 |
,1328 |
-3,69 |
3,50 |
,40210 |
18,706 |
-1,185 |
|---|
| ROKA |
255 |
,0191 |
,0896 |
-11,51 |
1,77 |
,84881 |
136,012 |
-10,401 |
|---|
| Total |
2600 |
,1191 |
,1276 |
-11,51 |
3,50 |
,46618 |
159,302 |
-6,941 |
|---|
| Forurenet |
OM |
232 |
,1513 |
,1314 |
-1,60 |
1,74 |
,36032 |
3,941 |
,353 |
|---|
| ROKA |
2250 |
,2037 |
,1756 |
-4,28 |
3,86 |
,42709 |
20,354 |
,134 |
|---|
| VTO |
245 |
,1193 |
,1014 |
-1,61 |
1,78 |
,39943 |
4,641 |
-,574 |
|---|
| Total |
2727 |
,1916 |
,1647 |
-4,28 |
3,86 |
,42012 |
18,490 |
,104 |
|---|
| Oprenset |
ROKA |
675 |
,1472 |
,1507 |
-5,14 |
2,82 |
,49875 |
32,062 |
-2,912 |
|---|
| VTO |
55 |
,3024 |
,2671 |
-,19 |
1,39 |
,31103 |
2,642 |
1,341 |
|---|
| Total |
730 |
,1589 |
,1596 |
-5,14 |
2,82 |
,48870 |
32,532 |
-2,878 |
|---|
| Restfourening |
ROKA |
559 |
,1160 |
,1011 |
-6,49 |
3,62 |
,54104 |
53,620 |
-4,062 |
|---|
| VTO |
42 |
,0853 |
,0640 |
-1,08 |
,70 |
,27156 |
7,570 |
-1,605 |
|---|
| Total |
601 |
,1138 |
,1001 |
-6,49 |
3,62 |
,52662 |
55,603 |
-4,101 |
|---|
| Undersřgt uden fund |
OM |
155 |
,1172 |
,0834 |
-1,28 |
,95 |
,26675 |
5,933 |
-,339 |
|---|
| ROKA |
112 |
,0726 |
,0887 |
-2,77 |
2,05 |
,47571 |
24,290 |
-3,170 |
|---|
| Total |
267 |
,0985 |
,0861 |
-2,77 |
2,05 |
,36894 |
29,770 |
-2,981 |
|---|
| Ikke forurenet |
Ikke forurenet |
598482 |
,1410 |
,1476 |
-15,98 |
5,98 |
,34408 |
131,593 |
-4,955 |
|---|
| Total |
598482 |
,1410 |
,1476 |
-15,98 |
5,98 |
,34408 |
131,593 |
-4,955 |
|---|
| Total |
Ikke forurenet |
598482 |
,1410 |
,1476 |
-15,98 |
5,98 |
,34408 |
131,593 |
-4,955 |
|---|
| OM |
2732 |
,1311 |
,1286 |
-3,69 |
3,50 |
,39219 |
18,113 |
-1,079 |
|---|
| ROKA |
3851 |
,1650 |
,1506 |
-11,51 |
3,86 |
,49952 |
101,439 |
-4,775 |
|---|
| VTO |
342 |
,1446 |
,1226 |
-1,61 |
1,78 |
,37849 |
4,941 |
-,479 |
|---|
| Total |
605407 |
,1411 |
,1475 |
-15,98 |
5,98 |
,34554 |
130,851 |
-4,934 |
|---|
EXAMINE
  VARIABLES=LnRH BY DEPOTSTATUS
  /PLOT BOXPLOT STEMLEAF
  /COMPARE GROUP
  /PERCENTILES(5,10,25,50,75,90,95) HAVERAGE
  /STATISTICS DESCRIPTIVES
  /CINTERVAL 95
  /MISSING LISTWISE
  /NOTOTAL.
Explore
Notes
| Output Created |
23-AUG-2005 14:30:12 |
|---|
| Comments |
|
|---|
| Input |
Data |
W:\sag\1243\Data\Databearbejdning\SPSS\Dataset\Hyp4.sav |
|---|
| Filter |
<none> |
|---|
| Weight |
<none> |
|---|
| Split File |
<none> |
|---|
| N of Rows in Working Data File |
605407 |
|---|
| Missing Value Handling |
Definition of Missing |
User-defined missing values for dependent variables are treated as missing. |
|---|
| Cases Used |
Statistics are based on cases with no missing values for any dependent variable or factor used. |
|---|
| Syntax |
EXAMINE
VARIABLES=LnRH BY DEPOTSTATUS
/PLOT BOXPLOT STEMLEAF
/COMPARE GROUP
/PERCENTILES(5,10,25,50,75,90,95) HAVERAGE
/STATISTICS DESCRIPTIVES
/CINTERVAL 95
/MISSING LISTWISE
/NOTOTAL.
|
|---|
| Resources |
Elapsed Time |
0:01:25,85 |
|---|
Depotstatus
ln (relativ handelspris)
Stem-and-Leaf Plots
ln (relativ handelspris) Stem-and-Leaf Plot for
DEPOTSTATUS= Mistanke

 Frequency    Stem &  Leaf

   110,00 Extremes    (=<-,47)
     7,00       -4 .  5&
    23,00       -4 .  024&
    13,00       -3 .  7&
    26,00       -3 .  0123&
    46,00       -2 .  55667889
    49,00       -2 .  0112344
    48,00       -1 .  56677889
    99,00       -1 .  000111122233344
   133,00       -0 .  555566667777778888899
   150,00       -0 .  0000111111222233333444444
   247,00        0 .  00000000000000111111111222223333334444444
   223,00        0 .  555555556666666677777788888888999999
   246,00        1 .  0000000001111111222222333333333444444444
   192,00        1 .  55555666666677777778888889999999
   221,00        2 .  0000000001111112222222333333333444444
   160,00        2 .  555555556666777777888899999
   137,00        3 .  00000011111122233334444
    98,00        3 .  555666667788999
    66,00        4 .  00111223334
    58,00        4 .  5566678899
    38,00        5 .  012234
    27,00        5 .  55689&
    29,00        6 .  012344
    19,00        6 .  689&
     9,00        7 .  &
   126,00 Extremes    (>=,74)

 Stem width:       ,10
 Each leaf:       6 case(s)


 & denotes fractional leaves.
ln (relativ handelspris) Stem-and-Leaf Plot for
DEPOTSTATUS= Forurenet

 Frequency    Stem &  Leaf

   113,00 Extremes    (=<-,41)
     4,00       -4 .  0
     8,00       -3 .  5&
    21,00       -3 .  0134&
    14,00       -2 .  67&
    32,00       -2 .  01234
    42,00       -1 .  56689&
    62,00       -1 .  001122344
   103,00       -0 .  555556667778899
   150,00       -0 .  000011112222233334444
   246,00        0 .  00000000011111112222233333334444444
   224,00        0 .  5555556666666777777888888999999
   259,00        1 .  00000001111111122222223333333444444444
   293,00        1 .  5555555566666666677777777778888888889999999
   229,00        2 .  00000001111112222222333333344444
   190,00        2 .  5555566666667777777888899999
   145,00        3 .  000011111222223333444
    90,00        3 .  5556677788899
    83,00        4 .  00111223344
    53,00        4 .  5567789
    42,00        5 .  011234
    41,00        5 .  5567789
    37,00        6 .  01234
    37,00        6 .  56789
    34,00        7 .  012344
     2,00        7 .  &
   173,00 Extremes    (>=,75)

 Stem width:       ,10
 Each leaf:       7 case(s)


 & denotes fractional leaves.
ln (relativ handelspris) Stem-and-Leaf Plot for
DEPOTSTATUS= Oprenset

 Frequency    Stem &  Leaf

    40,00 Extremes    (=<-,40)
     9,00       -3 .  01&
    16,00       -2 .  234&&
    29,00       -1 .  034569&
    44,00       -0 .  012234568&
   139,00        0 .  000001112223334444455667778889999
   148,00        1 .  000001122223334444555566666777888999
   119,00        2 .  0001112234445556666677888899
    69,00        3 .  0011234445667899
    35,00        4 .  0123468&
    21,00        5 .  019&&
    12,00        6 .  29&
     1,00        7 .  &
    48,00 Extremes    (>=,72)

 Stem width:       ,10
 Each leaf:       4 case(s)


 & denotes fractional leaves.
ln (relativ handelspris) Stem-and-Leaf Plot for
DEPOTSTATUS= Restfourening

 Frequency    Stem &  Leaf

    14,00 Extremes    (=<-,48)
     1,00       -4 .  &
     6,00       -3 .  5&
     9,00       -2 .  8&
    42,00       -1 .  000133479&
    95,00       -0 .  0011222223334445567789
   132,00        0 .  0000011122233345555666667778899
   113,00        1 .  00001111222333444556677899
    78,00        2 .  00112223344566789
    33,00        3 .  0124789&
    19,00        4 .  1358&
    16,00        5 .  246&&
     4,00        6 .  &
    39,00 Extremes    (>=,63)

 Stem width:       ,10
 Each leaf:       4 case(s)


 & denotes fractional leaves.
ln (relativ handelspris) Stem-and-Leaf Plot for
DEPOTSTATUS= Undersřgt uden fund
Frequency Stem & Leaf
8,00 Extremes (=<-,35)
4,00 -2 . 7789
5,00 -2 . 03344
5,00 -1 . 55699
9,00 -1 . 012244444
12,00 -0 . 555567788889
25,00 -0 . 0000111122222222233333344
39,00 0 . 000000000001111111122222333333344444444
40,00 0 . 5555555566666777777788888888889999999999
28,00 1 . 0000001112222223334444444444
27,00 1 . 555555566666777778888888999
12,00 2 . 001112233444
8,00 2 . 55556788
15,00 3 . 001122333444444
4,00 3 . 6789
2,00 4 . 24
4,00 4 . 6788
20,00 Extremes (>=,51)
Stem width: ,10
Each leaf: 1 case(s)
ln (relativ handelspris) Stem-and-Leaf Plot for
DEPOTSTATUS= Ikke forurenet

 Frequency    Stem &  Leaf

 21546,00 Extremes    (=<-,36)
   355,00       -3 .  &
  3892,00       -3 .  013&
  5039,00       -2 .  56789
  6993,00       -2 .  01234
 10586,00       -1 .  5566789
 15227,00       -1 .  00011223344
 22323,00       -0 .  5555666777888999
 32591,00       -0 .  0000111112222233334444
 58388,00        0 .  000000000001111111222222223333333344444444
 60794,00        0 .  5555555566666666677777777888888888999999999
 64817,00        1 .  0000000001111111112222222223333333333444444444
 63235,00        1 .  555555555666666666777777777888888888999999999
 55538,00        2 .  00000000111111112222222233333334444444
 44804,00        2 .  55555556666666777777888888999999
 35260,00        3 .  0000001111122222333334444
 25735,00        3 .  555566667777888999
 18585,00        4 .  0001112223344
 13076,00        4 .  5566778899
  9180,00        5 .  01234
  6518,00        5 .  56789
  4740,00        6 .  01234
   824,00        6 .  5&
 18436,00 Extremes    (>=,66)

 Stem width:       ,10
 Each leaf:    1410 case(s)


 & denotes fractional leaves.
USE ALL.
COMPUTE filter_$=((LnRH>=-0.47 and LnRH<=0.74 and DEPOTSTATUS=1) or
(LnRH>=-0.41 and LnRH<=0.75 and DEPOTSTATUS=2) or
(LnRH>=-0.40 and LnRH<=0.72 and DEPOTSTATUS=3) or
(LnRH>=-0.48 and LnRH<=0.63 and DEPOTSTATUS=4) or
(LnRH>=-0.35 and LnRH<=0.51 and DEPOTSTATUS=5) or
(LnRH>=-0.36 and LnRH<=0.66 and DEPOTSTATUS=6)).
VARIABLE LABEL filter_$ '(LnRH>=-0.47 and LnRH<=0.74 and DEPOTSTATUS=1) or'+
'(LnRH>=-0.41 and LnRH<=0.75 and DEPOTSTATUS=2) or'+
'(LnRH>=-0.40 and LnRH... (FILTER)'.
VALUE LABELS filter_$ 0 'Not Selected' 1 'Selected'.
FORMAT filter_$ (f1.0).
FILTER BY filter_$.
EXECUTE .
SUMMARIZE
/TABLES=LnRH BY DEPOTSTATUS
/FORMAT=NOLIST TOTAL
/TITLE='Afskĺret med depotstatusvis stem-leaf-plot'
/MISSING=VARIABLE
/CELLS=COUNT MEAN MEDIAN MIN MAX STDDEV KURT SKEW .
Summarize
Notes
| Output Created |
23-AUG-2005 14:36:56 |
|---|
| Comments |
|
|---|
| Input |
Data |
W:\sag\1243\Data\Databearbejdning\SPSS\Dataset\Hyp4.sav |
|---|
| Filter |
(LnRH>=-0.47 and LnRH<=0.74 and DEPOTSTATUS=1) or(LnRH>=-0.41 and LnRH<=0.75 and DEPOTSTATUS=2) or(LnRH>=-0.40 and LnRH... (FILTER) |
|---|
| Weight |
<none> |
|---|
| Split File |
<none> |
|---|
| N of Rows in Working Data File |
565043 |
|---|
| Missing Value Handling |
Definition of Missing |
For each dependent variable in a table, user-defined missing values for the dependent and all grouping variables are treated as missing. |
|---|
| Cases Used |
Cases used for each table have no missing values in any independent variable, and not all dependent variables have missing values. |
|---|
| Syntax |
SUMMARIZE
/TABLES=LnRH BY DEPOTSTATUS
/FORMAT=NOLIST TOTAL
/TITLE='Afskĺret med depotstatusvis stem-leaf-plot'
/MISSING=VARIABLE
/CELLS=COUNT MEAN MEDIAN MIN MAX STDDEV KURT SKEW .
|
|---|
| Resources |
Elapsed Time |
0:00:12,64 |
|---|
Case Processing Summary
|
Cases |
|---|
| Included |
Excluded |
Total |
|---|
| N |
Percent |
N |
Percent |
N |
Percent |
|---|
| ln (relativ handelspris) * Depotstatus |
565043 |
100,0% |
0 |
,0% |
565043 |
100,0% |
|---|
Afskĺret med depotstatusvis stem-leaf-plot
ln (relativ handelspris)
| Depotstatus |
N |
Mean |
Median |
Minimum |
Maximum |
Std. Deviation |
Kurtosis |
Skewness |
|---|
| Mistanke |
2367 |
,1296 |
,1257 |
-,46 |
,74 |
,21896 |
,166 |
,057 |
|---|
| Forurenet |
2439 |
,1724 |
,1607 |
-,41 |
,75 |
,20915 |
,356 |
,352 |
|---|
| Oprenset |
643 |
,1628 |
,1563 |
-,40 |
,71 |
,19507 |
,294 |
,063 |
|---|
| Restfourening |
548 |
,1054 |
,0881 |
-,40 |
,63 |
,18324 |
,421 |
,389 |
|---|
| Undersřgt uden fund |
240 |
,0874 |
,0806 |
-,29 |
,51 |
,15409 |
,312 |
,175 |
|---|
| Ikke forurenet |
558806 |
,1546 |
,1485 |
-,36 |
,66 |
,18220 |
,071 |
,075 |
|---|
| Total |
565043 |
,1545 |
,1484 |
-,46 |
,75 |
,18252 |
,079 |
,077 |
|---|
SUMMARIZE
/TABLES=LnRH BY DATABASE
/FORMAT=NOLIST TOTAL
/TITLE='Afskĺret med depotstatusvis stem-leaf-plot'
/MISSING=VARIABLE
/CELLS=COUNT MEAN MEDIAN MIN MAX STDDEV KURT SKEW .
Summarize
Notes
| Output Created |
23-AUG-2005 14:37:09 |
|---|
| Comments |
|
|---|
| Input |
Data |
W:\sag\1243\Data\Databearbejdning\SPSS\Dataset\Hyp4.sav |
|---|
| Filter |
(LnRH>=-0.47 and LnRH<=0.74 and DEPOTSTATUS=1) or(LnRH>=-0.41 and LnRH<=0.75 and DEPOTSTATUS=2) or(LnRH>=-0.40 and LnRH... (FILTER) |
|---|
| Weight |
<none> |
|---|
| Split File |
<none> |
|---|
| N of Rows in Working Data File |
565043 |
|---|
| Missing Value Handling |
Definition of Missing |
For each dependent variable in a table, user-defined missing values for the dependent and all grouping variables are treated as missing. |
|---|
| Cases Used |
Cases used for each table have no missing values in any independent variable, and not all dependent variables have missing values. |
|---|
| Syntax |
SUMMARIZE
/TABLES=LnRH BY DATABASE
/FORMAT=NOLIST TOTAL
/TITLE='Afskĺret med depotstatusvis stem-leaf-plot'
/MISSING=VARIABLE
/CELLS=COUNT MEAN MEDIAN MIN MAX STDDEV KURT SKEW .
|
|---|
| Resources |
Elapsed Time |
0:00:12,55 |
|---|
Case Processing Summary
|
Cases |
|---|
| Included |
Excluded |
Total |
|---|
| N |
Percent |
N |
Percent |
N |
Percent |
|---|
| ln (relativ handelspris) * Ordning (database) |
565043 |
100,0% |
0 |
,0% |
565043 |
100,0% |
|---|
Afskĺret med depotstatusvis stem-leaf-plot
ln (relativ handelspris)
| Ordning (database) |
N |
Mean |
Median |
Minimum |
Maximum |
Std. Deviation |
Kurtosis |
Skewness |
|---|
| Ikke forurenet |
558806 |
,1546 |
,1485 |
-,36 |
,66 |
,18220 |
,071 |
,075 |
|---|
| OM |
2464 |
,1276 |
,1244 |
-,46 |
,74 |
,21492 |
,260 |
,064 |
|---|
| ROKA |
3463 |
,1583 |
,1452 |
-,43 |
,75 |
,20288 |
,399 |
,337 |
|---|
| VTO |
310 |
,1558 |
,1233 |
-,40 |
,75 |
,22133 |
-,156 |
,337 |
|---|
| Total |
565043 |
,1545 |
,1484 |
-,46 |
,75 |
,18252 |
,079 |
,077 |
|---|
SUMMARIZE
/TABLES=LnRH BY DEPOTSTATUS BY DATABASE
/FORMAT=NOLIST TOTAL
/TITLE='Afskĺret med depotstatusvis stem-leaf-plot'
/MISSING=VARIABLE
/CELLS=COUNT MEAN MEDIAN MIN MAX STDDEV KURT SKEW .
Summarize
Notes
| Output Created |
23-AUG-2005 14:37:21 |
|---|
| Comments |
|
|---|
| Input |
Data |
W:\sag\1243\Data\Databearbejdning\SPSS\Dataset\Hyp4.sav |
|---|
| Filter |
(LnRH>=-0.47 and LnRH<=0.74 and DEPOTSTATUS=1) or(LnRH>=-0.41 and LnRH<=0.75 and DEPOTSTATUS=2) or(LnRH>=-0.40 and LnRH... (FILTER) |
|---|
| Weight |
<none> |
|---|
| Split File |
<none> |
|---|
| N of Rows in Working Data File |
565043 |
|---|
| Missing Value Handling |
Definition of Missing |
For each dependent variable in a table, user-defined missing values for the dependent and all grouping variables are treated as missing. |
|---|
| Cases Used |
Cases used for each table have no missing values in any independent variable, and not all dependent variables have missing values. |
|---|
| Syntax |
SUMMARIZE
/TABLES=LnRH BY DEPOTSTATUS BY DATABASE
/FORMAT=NOLIST TOTAL
/TITLE='Afskĺret med depotstatusvis stem-leaf-plot'
/MISSING=VARIABLE
/CELLS=COUNT MEAN MEDIAN MIN MAX STDDEV KURT SKEW .
|
|---|
| Resources |
Elapsed Time |
0:00:27,92 |
|---|
Case Processing Summary
|
Cases |
|---|
| Included |
Excluded |
Total |
|---|
| N |
Percent |
N |
Percent |
N |
Percent |
|---|
| ln (relativ handelspris) * Depotstatus * Ordning (database) |
565043 |
100,0% |
0 |
,0% |
565043 |
100,0% |
|---|
Afskĺret med depotstatusvis stem-leaf-plot
ln (relativ handelspris)
| Depotstatus |
Ordning (database) |
N |
Mean |
Median |
Minimum |
Maximum |
Std. Deviation |
Kurtosis |
Skewness |
|---|
| Mistanke |
OM |
2126 |
,1323 |
,1308 |
-,46 |
,74 |
,22009 |
,156 |
,027 |
|---|
| ROKA |
241 |
,1061 |
,0953 |
-,43 |
,69 |
,20771 |
,415 |
,327 |
|---|
| Total |
2367 |
,1296 |
,1257 |
-,46 |
,74 |
,21896 |
,166 |
,057 |
|---|
| Forurenet |
OM |
199 |
,1080 |
,1178 |
-,36 |
,74 |
,19255 |
1,173 |
,213 |
|---|
| ROKA |
2020 |
,1812 |
,1698 |
-,41 |
,75 |
,20721 |
,364 |
,356 |
|---|
| VTO |
220 |
,1498 |
,1108 |
-,40 |
,75 |
,22937 |
-,142 |
,428 |
|---|
| Total |
2439 |
,1724 |
,1607 |
-,41 |
,75 |
,20915 |
,356 |
,352 |
|---|
| Oprenset |
ROKA |
593 |
,1574 |
,1503 |
-,40 |
,71 |
,19396 |
,351 |
,070 |
|---|
| VTO |
50 |
,2274 |
,2436 |
-,19 |
,66 |
,19857 |
,004 |
-,073 |
|---|
| Total |
643 |
,1628 |
,1563 |
-,40 |
,71 |
,19507 |
,294 |
,063 |
|---|
| Restfourening |
ROKA |
508 |
,1059 |
,0911 |
-,40 |
,63 |
,18351 |
,464 |
,409 |
|---|
| VTO |
40 |
,0990 |
,0640 |
-,35 |
,53 |
,18187 |
-,086 |
,122 |
|---|
| Total |
548 |
,1054 |
,0881 |
-,40 |
,63 |
,18324 |
,421 |
,389 |
|---|
| Undersřgt uden fund |
OM |
139 |
,0831 |
,0715 |
-,29 |
,47 |
,14977 |
,514 |
,105 |
|---|
| ROKA |
101 |
,0934 |
,0863 |
-,29 |
,51 |
,16041 |
,113 |
,242 |
|---|
| Total |
240 |
,0874 |
,0806 |
-,29 |
,51 |
,15409 |
,312 |
,175 |
|---|
| Ikke forurenet |
Ikke forurenet |
558806 |
,1546 |
,1485 |
-,36 |
,66 |
,18220 |
,071 |
,075 |
|---|
| Total |
558806 |
,1546 |
,1485 |
-,36 |
,66 |
,18220 |
,071 |
,075 |
|---|
| Total |
Ikke forurenet |
558806 |
,1546 |
,1485 |
-,36 |
,66 |
,18220 |
,071 |
,075 |
|---|
| OM |
2464 |
,1276 |
,1244 |
-,46 |
,74 |
,21492 |
,260 |
,064 |
|---|
| ROKA |
3463 |
,1583 |
,1452 |
-,43 |
,75 |
,20288 |
,399 |
,337 |
|---|
| VTO |
310 |
,1558 |
,1233 |
-,40 |
,75 |
,22133 |
-,156 |
,337 |
|---|
| Total |
565043 |
,1545 |
,1484 |
-,46 |
,75 |
,18252 |
,079 |
,077 |
|---|
EXAMINE
  VARIABLES=LnRH BY DEPOTSTATUS
  /PLOT BOXPLOT HISTOGRAM
  /COMPARE GROUP
  /PERCENTILES(5,10,25,50,75,90,95) HAVERAGE
  /STATISTICS DESCRIPTIVES
  /CINTERVAL 95
  /MISSING LISTWISE
  /NOTOTAL.
Explore
Notes
| Output Created |
23-AUG-2005 14:37:49 |
|---|
| Comments |
|
|---|
| Input |
Data |
W:\sag\1243\Data\Databearbejdning\SPSS\Dataset\Hyp4.sav |
|---|
| Filter |
(LnRH>=-0.47 and LnRH<=0.74 and DEPOTSTATUS=1) or(LnRH>=-0.41 and LnRH<=0.75 and DEPOTSTATUS=2) or(LnRH>=-0.40 and LnRH... (FILTER) |
|---|
| Weight |
<none> |
|---|
| Split File |
<none> |
|---|
| N of Rows in Working Data File |
565043 |
|---|
| Missing Value Handling |
Definition of Missing |
User-defined missing values for dependent variables are treated as missing. |
|---|
| Cases Used |
Statistics are based on cases with no missing values for any dependent variable or factor used. |
|---|
| Syntax |
EXAMINE
VARIABLES=LnRH BY DEPOTSTATUS
/PLOT BOXPLOT HISTOGRAM
/COMPARE GROUP
/PERCENTILES(5,10,25,50,75,90,95) HAVERAGE
/STATISTICS DESCRIPTIVES
/CINTERVAL 95
/MISSING LISTWISE
/NOTOTAL.
|
|---|
| Resources |
Elapsed Time |
0:01:09,56 |
|---|
Depotstatus
ln (relativ handelspris)
Histograms

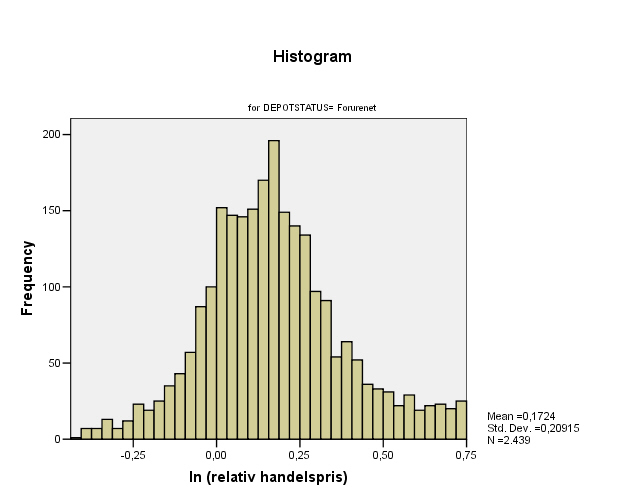

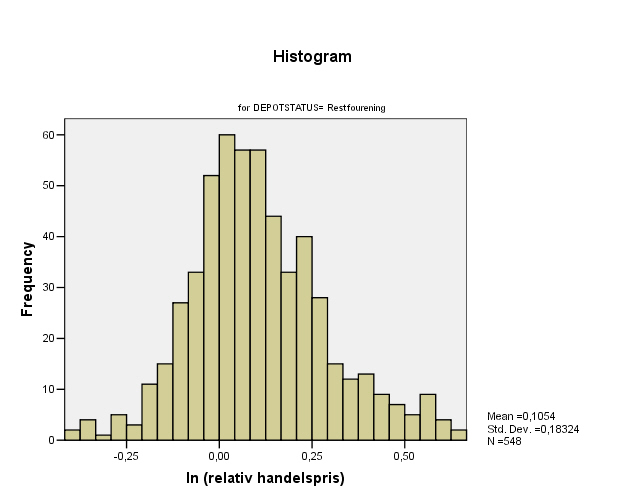
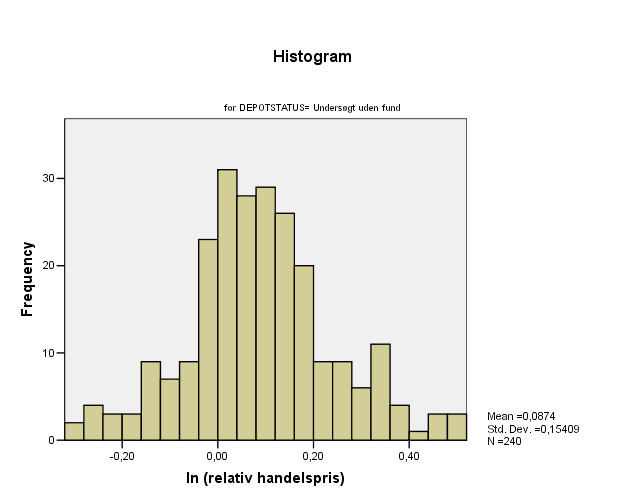
UNIANOVA
  LnRH  BY DEPOTSTATUS DATABASE
  /METHOD = SSTYPE(3)
  /INTERCEPT = EXCLUDE
  /PLOT = PROFILE( DEPOTSTATUS*DATABASE )
  /EMMEANS = TABLES(DEPOTSTATUS*DATABASE)
  /PRINT = DESCRIPTIVE HOMOGENEITY
  /PLOT = SPREADLEVEL
  /CRITERIA = ALPHA(.10)
  /DESIGN = DEPOTSTATUS DATABASE DEPOTSTATUS*DATABASE .
Univariate Analysis of Variance
Notes
| Output Created |
23-AUG-2005 14:38:59 |
|---|
| Comments |
|
|---|
| Input |
Data |
W:\sag\1243\Data\Databearbejdning\SPSS\Dataset\Hyp4.sav |
|---|
| Filter |
(LnRH>=-0.47 and LnRH<=0.74 and DEPOTSTATUS=1) or(LnRH>=-0.41 and LnRH<=0.75 and DEPOTSTATUS=2) or(LnRH>=-0.40 and LnRH... (FILTER) |
|---|
| Weight |
<none> |
|---|
| Split File |
<none> |
|---|
| N of Rows in Working Data File |
565043 |
|---|
| Missing Value Handling |
Definition of Missing |
User-defined missing values are treated as missing. |
|---|
| Cases Used |
Statistics are based on all cases with valid data for all variables in the model. |
|---|
| Syntax |
UNIANOVA
LnRH BY DEPOTSTATUS DATABASE
/METHOD = SSTYPE(3)
/INTERCEPT = EXCLUDE
/PLOT = PROFILE( DEPOTSTATUS*DATABASE )
/EMMEANS = TABLES(DEPOTSTATUS*DATABASE)
/PRINT = DESCRIPTIVE HOMOGENEITY
/PLOT = SPREADLEVEL
/CRITERIA = ALPHA(.10)
/DESIGN = DEPOTSTATUS DATABASE DEPOTSTATUS*DATABASE .
|
|---|
| Resources |
Elapsed Time |
0:00:16,50 |
|---|
Between-Subjects Factors
|
|
Value Label |
N |
|---|
| Depotstatus |
1 |
Mistanke |
2367 |
|---|
| 2 |
Forurenet |
2439 |
|---|
| 3 |
Oprenset |
643 |
|---|
| 4 |
Restfourening |
548 |
|---|
| 5 |
Undersřgt uden fund |
240 |
|---|
| 6 |
Ikke forurenet |
558806 |
|---|
| Ordning (database) |
IF |
Ikke forurenet |
558806 |
|---|
| OM |
OM |
2464 |
|---|
| ROKA |
ROKA |
3463 |
|---|
| VT |
VTO |
310 |
|---|
Descriptive Statistics
Dependent Variable: ln (relativ handelspris)
| Depotstatus |
Ordning (database) |
Mean |
Std. Deviation |
N |
|---|
| Mistanke |
OM |
,1323 |
,22009 |
2126 |
|---|
| ROKA |
,1061 |
,20771 |
241 |
|---|
| Total |
,1296 |
,21896 |
2367 |
|---|
| Forurenet |
OM |
,1080 |
,19255 |
199 |
|---|
| ROKA |
,1812 |
,20721 |
2020 |
|---|
| VTO |
,1498 |
,22937 |
220 |
|---|
| Total |
,1724 |
,20915 |
2439 |
|---|
| Oprenset |
ROKA |
,1574 |
,19396 |
593 |
|---|
| VTO |
,2274 |
,19857 |
50 |
|---|
| Total |
,1628 |
,19507 |
643 |
|---|
| Restfourening |
ROKA |
,1059 |
,18351 |
508 |
|---|
| VTO |
,0990 |
,18187 |
40 |
|---|
| Total |
,1054 |
,18324 |
548 |
|---|
| Undersřgt uden fund |
OM |
,0831 |
,14977 |
139 |
|---|
| ROKA |
,0934 |
,16041 |
101 |
|---|
| Total |
,0874 |
,15409 |
240 |
|---|
| Ikke forurenet |
Ikke forurenet |
,1546 |
,18220 |
558806 |
|---|
| Total |
,1546 |
,18220 |
558806 |
|---|
| Total |
Ikke forurenet |
,1546 |
,18220 |
558806 |
|---|
| OM |
,1276 |
,21492 |
2464 |
|---|
| ROKA |
,1583 |
,20288 |
3463 |
|---|
| VTO |
,1558 |
,22133 |
310 |
|---|
| Total |
,1545 |
,18252 |
565043 |
|---|
Levene's Test of Equality of Error Variances(a)
Dependent Variable: ln (relativ handelspris)
| F |
df1 |
df2 |
Sig. |
|---|
| 20,298 |
11 |
565031 |
,000 |
| Tests the null hypothesis that the error variance of the dependent variable is equal across groups. | | a Design: DEPOTSTATUS+DATABASE+DEPOTSTATUS * DATABASE |
Tests of Between-Subjects Effects
Dependent Variable: ln (relativ handelspris)
| Source |
Type III Sum of Squares |
df |
Mean Square |
F |
Sig. |
|---|
| Model |
13498,054(a) |
12 |
1124,838 |
33774,057 |
,000 |
|---|
| DEPOTSTATUS |
1,092 |
4 |
,273 |
8,196 |
,000 |
|---|
| DATABASE |
,165 |
2 |
,082 |
2,476 |
,084 |
|---|
| DEPOTSTATUS * DATABASE |
1,327 |
4 |
,332 |
9,964 |
,000 |
|---|
| Error |
18818,238 |
565031 |
,033 |
|
|
|---|
| Total |
32316,292 |
565043 |
|
|
|
|---|
| a R Squared = ,418 (Adjusted R Squared = ,418) |
Estimated Marginal Means
Depotstatus * Ordning (database)
Dependent Variable: ln (relativ handelspris)
| Depotstatus |
Ordning (database) |
Mean |
Std. Error |
90% Confidence Interval |
|---|
| Lower Bound |
Upper Bound |
|---|
| Mistanke |
Ikke forurenet |
.(a) |
. |
. |
. |
|---|
| OM |
,132 |
,004 |
,126 |
,139 |
|---|
| ROKA |
,106 |
,012 |
,087 |
,125 |
|---|
| VTO |
.(a) |
. |
. |
. |
|---|
| Forurenet |
Ikke forurenet |
.(a) |
. |
. |
. |
|---|
| OM |
,108 |
,013 |
,087 |
,129 |
|---|
| ROKA |
,181 |
,004 |
,175 |
,188 |
|---|
| VTO |
,150 |
,012 |
,130 |
,170 |
|---|
| Oprenset |
Ikke forurenet |
.(a) |
. |
. |
. |
|---|
| OM |
.(a) |
. |
. |
. |
|---|
| ROKA |
,157 |
,007 |
,145 |
,170 |
|---|
| VTO |
,227 |
,026 |
,185 |
,270 |
|---|
| Restfourening |
Ikke forurenet |
.(a) |
. |
. |
. |
|---|
| OM |
.(a) |
. |
. |
. |
|---|
| ROKA |
,106 |
,008 |
,093 |
,119 |
|---|
| VTO |
,099 |
,029 |
,052 |
,146 |
|---|
| Undersřgt uden fund |
Ikke forurenet |
.(a) |
. |
. |
. |
|---|
| OM |
,083 |
,015 |
,058 |
,109 |
|---|
| ROKA |
,093 |
,018 |
,064 |
,123 |
|---|
| VTO |
.(a) |
. |
. |
. |
|---|
| Ikke forurenet |
Ikke forurenet |
,155 |
,000 |
,154 |
,155 |
|---|
| OM |
.(a) |
. |
. |
. |
|---|
| ROKA |
.(a) |
. |
. |
. |
|---|
| VTO |
.(a) |
. |
. |
. |
|---|
| a This level combination of factors is not observed, thus the corresponding population marginal mean is not estimable. |
Spread-versus-Level Plots
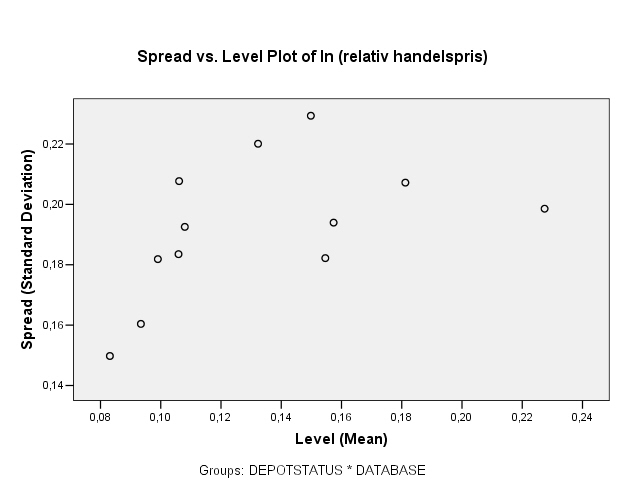
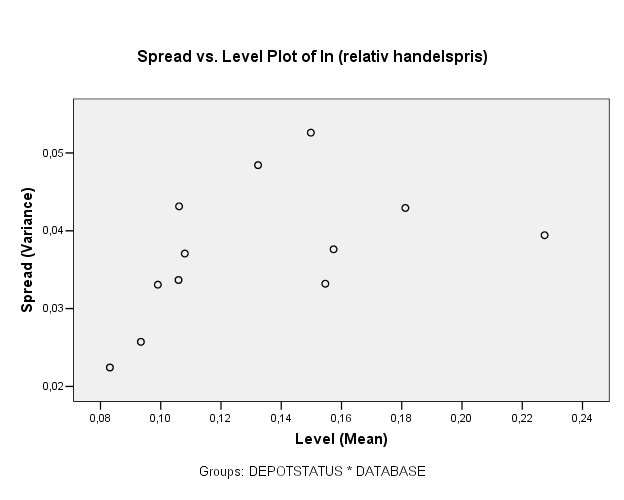
Profile Plots
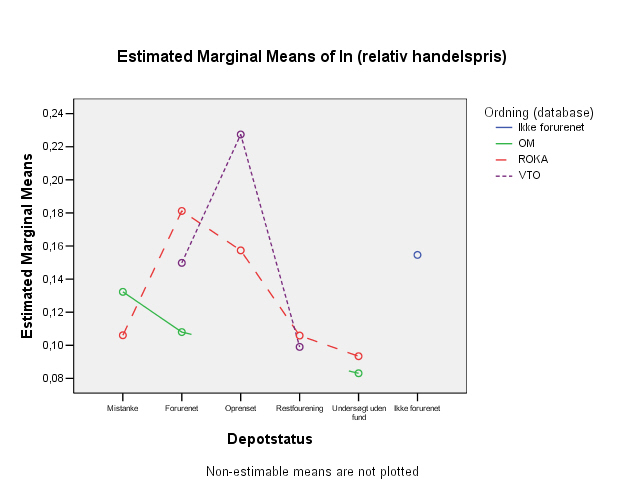
GET
FILE='W:\sag\1243\Data\Databearbejdning\SPSS\Dataset\Hyp5.sav'.
*Define Variable Properties.
*DEPOTSTATUS.
VARIABLE LABELS DEPOTSTATUS 'Depotstatus'.
VALUE LABELS DEPOTSTATUS
1 'Mistanke'
2 'Forurenet'
3 'Oprenset'
4 'Restforurening'
5 'Undersřgt uden fund' .
*lnRH.
VARIABLE LABELS lnRH 'ln (relativ handelspris)'.
*Type.
FORMATS Type (F11.0).
VALUE LABELS Type
12 'Mistanke til forurenet'
13 'Mistanke til oprenset'
15 'Mistanke til undersřgt uden fund'
23 'Forurenet til oprenset'
24 'Forurenet til restforurening'
25 'Forurenet til undersřgt uden fund' .
EXECUTE.
SAVE OUTFILE='W:\sag\1243\Data\Databearbejdning\SPSS\Dataset\hyp5.sav'
/COMPRESSED.
GET
FILE='W:\sag\1243\Data\Databearbejdning\SPSS\Dataset\Hyp5.sav'.
USE ALL.
COMPUTE filter_$=(Type=12).
VARIABLE LABEL filter_$ 'Type=12 (FILTER)'.
VALUE LABELS filter_$ 0 'Not Selected' 1 'Selected'.
FORMAT filter_$ (f1.0).
FILTER BY filter_$.
EXECUTE .
SUMMARIZE
/TABLES=LnRH BY DEPOTSTATUS
/FORMAT=NOLIST TOTAL
/TITLE='Alle observationer'
/MISSING=VARIABLE
/CELLS=COUNT MEAN MEDIAN MIN MAX STDDEV KURT SKEW .
Summarize
Notes
| Output Created |
23-AUG-2005 15:22:50 |
|---|
| Comments |
|
|---|
| Input |
Data |
W:\sag\1243\Data\Databearbejdning\SPSS\Dataset\Hyp5.sav |
|---|
| Filter |
Type=12 (FILTER) |
|---|
| Weight |
<none> |
|---|
| Split File |
<none> |
|---|
| N of Rows in Working Data File |
42 |
|---|
| Missing Value Handling |
Definition of Missing |
For each dependent variable in a table, user-defined missing values for the dependent and all grouping variables are treated as missing. |
|---|
| Cases Used |
Cases used for each table have no missing values in any independent variable, and not all dependent variables have missing values. |
|---|
| Syntax |
SUMMARIZE
/TABLES=LnRH BY DEPOTSTATUS
/FORMAT=NOLIST TOTAL
/TITLE='Alle observationer'
/MISSING=VARIABLE
/CELLS=COUNT MEAN MEDIAN MIN MAX STDDEV KURT SKEW .
|
|---|
| Resources |
Elapsed Time |
0:00:00,02 |
|---|
Case Processing Summary
|
Cases |
|---|
| Included |
Excluded |
Total |
|---|
| N |
Percent |
N |
Percent |
N |
Percent |
|---|
| ln (relativ handelspris) * Depotstatus |
42 |
100,0% |
0 |
,0% |
42 |
100,0% |
|---|
Alle observationer
ln (relativ handelspris)
| Depotstatus |
N |
Mean |
Median |
Minimum |
Maximum |
Std. Deviation |
Kurtosis |
Skewness |
|---|
| Mistanke |
19 |
,1245 |
,1503 |
-,74 |
,64 |
,34619 |
1,195 |
-,924 |
|---|
| Forurenet |
23 |
,2289 |
,1922 |
-,52 |
,87 |
,29758 |
1,092 |
-,186 |
|---|
| Total |
42 |
,1817 |
,1769 |
-,74 |
,87 |
,32078 |
1,224 |
-,629 |
|---|
EXAMINE
  VARIABLES=LnRH BY DEPOTSTATUS
  /PLOT BOXPLOT STEMLEAF
  /COMPARE GROUP
  /PERCENTILES(5,10,25,50,75,90,95) HAVERAGE
  /STATISTICS DESCRIPTIVES
  /CINTERVAL 95
  /MISSING LISTWISE
  /NOTOTAL.
Explore
Notes
| Output Created |
23-AUG-2005 15:22:50 |
|---|
| Comments |
|
|---|
| Input |
Data |
W:\sag\1243\Data\Databearbejdning\SPSS\Dataset\Hyp5.sav |
|---|
| Filter |
Type=12 (FILTER) |
|---|
| Weight |
<none> |
|---|
| Split File |
<none> |
|---|
| N of Rows in Working Data File |
42 |
|---|
| Missing Value Handling |
Definition of Missing |
User-defined missing values for dependent variables are treated as missing. |
|---|
| Cases Used |
Statistics are based on cases with no missing values for any dependent variable or factor used. |
|---|
| Syntax |
EXAMINE
VARIABLES=LnRH BY DEPOTSTATUS
/PLOT BOXPLOT STEMLEAF
/COMPARE GROUP
/PERCENTILES(5,10,25,50,75,90,95) HAVERAGE
/STATISTICS DESCRIPTIVES
/CINTERVAL 95
/MISSING LISTWISE
/NOTOTAL.
|
|---|
| Resources |
Elapsed Time |
0:00:00,27 |
|---|
Depotstatus
Case Processing Summary
|
Depotstatus |
Cases |
|---|
| Valid |
Missing |
Total |
|---|
| N |
Percent |
N |
Percent |
N |
Percent |
|---|
| ln (relativ handelspris) |
Mistanke |
19 |
100,0% |
0 |
,0% |
19 |
100,0% |
|---|
| Forurenet |
23 |
100,0% |
0 |
,0% |
23 |
100,0% |
|---|
Descriptives
|
Depotstatus |
|
|
Statistic |
Std. Error |
|---|
| ln (relativ handelspris) |
Mistanke |
Mean |
,1245 |
,07942 |
|---|
| 95% Confidence Interval for Mean |
Lower Bound |
-,0424 |
|
|---|
| Upper Bound |
,2914 |
|
|---|
| 5% Trimmed Mean |
,1435 |
|
|---|
| Median |
,1503 |
|
|---|
| Variance |
,120 |
|
|---|
| Std. Deviation |
,34619 |
|
|---|
| Minimum |
-,74 |
|
|---|
| Maximum |
,64 |
|
|---|
| Range |
1,38 |
|
|---|
| Interquartile Range |
,39 |
|
|---|
| Skewness |
-,924 |
,524 |
|---|
| Kurtosis |
1,195 |
1,014 |
|---|
| Forurenet |
Mean |
,2289 |
,06205 |
|---|
| 95% Confidence Interval for Mean |
Lower Bound |
,1002 |
|
|---|
| Upper Bound |
,3576 |
|
|---|
| 5% Trimmed Mean |
,2343 |
|
|---|
| Median |
,1922 |
|
|---|
| Variance |
,089 |
|
|---|
| Std. Deviation |
,29758 |
|
|---|
| Minimum |
-,52 |
|
|---|
| Maximum |
,87 |
|
|---|
| Range |
1,39 |
|
|---|
| Interquartile Range |
,24 |
|
|---|
| Skewness |
-,186 |
,481 |
|---|
| Kurtosis |
1,092 |
,935 |
|---|
Percentiles
|
|
Depotstatus |
Percentiles |
|---|
| 5 |
10 |
25 |
50 |
75 |
90 |
95 |
|---|
| Weighted Average(Definition 1) |
ln (relativ handelspris) |
Mistanke |
-,7359 |
-,5306 |
-,0388 |
,1503 |
,3507 |
,5534 |
. |
|---|
| Forurenet |
-,4475 |
-,1399 |
,1512 |
,1922 |
,3909 |
,6048 |
,8156 |
|---|
| Tukey's Hinges |
ln (relativ handelspris) |
Mistanke |
|
|
-,0067 |
,1503 |
,3472 |
|
|
|---|
| Forurenet |
|
|
,1548 |
,1922 |
,3669 |
|
|
|---|
ln (relativ handelspris)
Stem-and-Leaf Plots
ln (relativ handelspris) Stem-and-Leaf Plot for
DEPOTSTATUS= Mistanke

 Frequency    Stem &  Leaf

     1,00 Extremes    (=<-,7)
     1,00       -0 .  5
     3,00       -0 .  001
    11,00        0 .  00011122333
     3,00        0 .  556

 Stem width:      1,00
 Each leaf:       1 case(s)
ln (relativ handelspris) Stem-and-Leaf Plot for
DEPOTSTATUS= Forurenet

 Frequency    Stem &  Leaf

     1,00 Extremes    (=<-,52)
     2,00       -1 .  24
     1,00       -0 .  2
     1,00        0 .  0
     7,00        1 .  5566789
     4,00        2 .  0247
     2,00        3 .  49
      ,00        4 .
     3,00        5 .  779
     1,00        6 .  0
     1,00 Extremes    (>=,87)

 Stem width:       ,10
 Each leaf:       1 case(s)
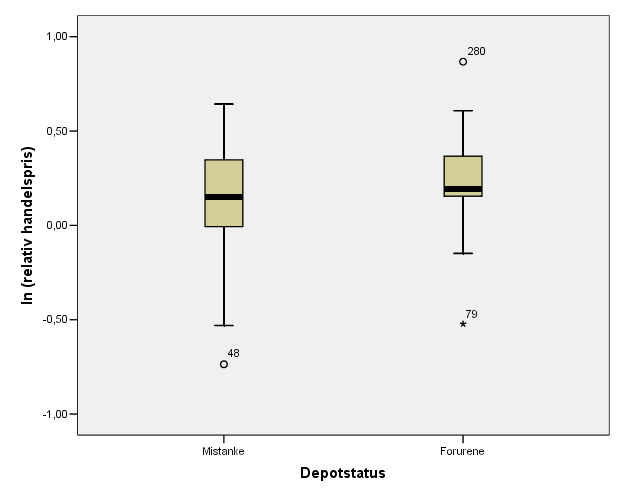
USE ALL.
COMPUTE filter_$=(TYPE=12 and ((LnRH>=-0.7 and LnRH<=10 and DEPOTSTATUS=1) or
(LnRH>=-0.52 and LnRH<=0.87 and DEPOTSTATUS=2))).
VARIABLE LABEL filter_$ '(LnRH>=-0.47 and LnRH<=0.74 and DEPOTSTATUS=1) or'+
'(LnRH>=-0.41 and LnRH<=0.75 and DEPOTSTATUS=2) or'+
'(LnRH>=-0.40 and LnRH... (FILTER)'.
VALUE LABELS filter_$ 0 'Not Selected' 1 'Selected'.
FORMAT filter_$ (f1.0).
FILTER BY filter_$.
EXECUTE .
SUMMARIZE
/TABLES=LnRH BY DEPOTSTATUS
/FORMAT=NOLIST TOTAL
/TITLE='Afskĺret med depotstatusvis stem-leaf-plot'
/MISSING=VARIABLE
/CELLS=COUNT MEAN MEDIAN MIN MAX STDDEV KURT SKEW .
Summarize
Notes
| Output Created |
23-AUG-2005 15:22:50 |
|---|
| Comments |
|
|---|
| Input |
Data |
W:\sag\1243\Data\Databearbejdning\SPSS\Dataset\Hyp5.sav |
|---|
| Filter |
(LnRH>=-0.47 and LnRH<=0.74 and DEPOTSTATUS=1) or(LnRH>=-0.41 and LnRH<=0.75 and DEPOTSTATUS=2) or(LnRH>=-0.40 and LnRH... (FILTER) |
|---|
| Weight |
<none> |
|---|
| Split File |
<none> |
|---|
| N of Rows in Working Data File |
40 |
|---|
| Missing Value Handling |
Definition of Missing |
For each dependent variable in a table, user-defined missing values for the dependent and all grouping variables are treated as missing. |
|---|
| Cases Used |
Cases used for each table have no missing values in any independent variable, and not all dependent variables have missing values. |
|---|
| Syntax |
SUMMARIZE
/TABLES=LnRH BY DEPOTSTATUS
/FORMAT=NOLIST TOTAL
/TITLE='Afskĺret med depotstatusvis stem-leaf-plot'
/MISSING=VARIABLE
/CELLS=COUNT MEAN MEDIAN MIN MAX STDDEV KURT SKEW .
|
|---|
| Resources |
Elapsed Time |
0:00:00,00 |
|---|
Case Processing Summary
|
Cases |
|---|
| Included |
Excluded |
Total |
|---|
| N |
Percent |
N |
Percent |
N |
Percent |
|---|
| ln (relativ handelspris) * Depotstatus |
40 |
100,0% |
0 |
,0% |
40 |
100,0% |
|---|
Afskĺret med depotstatusvis stem-leaf-plot
ln (relativ handelspris)
| Depotstatus |
N |
Mean |
Median |
Minimum |
Maximum |
Std. Deviation |
Kurtosis |
Skewness |
|---|
| Mistanke |
18 |
,1723 |
,1531 |
-,53 |
,64 |
,28449 |
,865 |
-,517 |
|---|
| Forurenet |
22 |
,2630 |
,1974 |
-,15 |
,87 |
,25433 |
,217 |
,591 |
|---|
| Total |
40 |
,2222 |
,1878 |
-,53 |
,87 |
,26870 |
,739 |
-,048 |
|---|
EXAMINE
  VARIABLES=LnRH BY DEPOTSTATUS
  /PLOT BOXPLOT HISTOGRAM
  /COMPARE GROUP
  /PERCENTILES(5,10,25,50,75,90,95) HAVERAGE
  /STATISTICS DESCRIPTIVES
  /CINTERVAL 95
  /MISSING LISTWISE
  /NOTOTAL.
Explore
Notes
| Output Created |
23-AUG-2005 15:22:50 |
|---|
| Comments |
|
|---|
| Input |
Data |
W:\sag\1243\Data\Databearbejdning\SPSS\Dataset\Hyp5.sav |
|---|
| Filter |
(LnRH>=-0.47 and LnRH<=0.74 and DEPOTSTATUS=1) or(LnRH>=-0.41 and LnRH<=0.75 and DEPOTSTATUS=2) or(LnRH>=-0.40 and LnRH... (FILTER) |
|---|
| Weight |
<none> |
|---|
| Split File |
<none> |
|---|
| N of Rows in Working Data File |
40 |
|---|
| Missing Value Handling |
Definition of Missing |
User-defined missing values for dependent variables are treated as missing. |
|---|
| Cases Used |
Statistics are based on cases with no missing values for any dependent variable or factor used. |
|---|
| Syntax |
EXAMINE
VARIABLES=LnRH BY DEPOTSTATUS
/PLOT BOXPLOT HISTOGRAM
/COMPARE GROUP
/PERCENTILES(5,10,25,50,75,90,95) HAVERAGE
/STATISTICS DESCRIPTIVES
/CINTERVAL 95
/MISSING LISTWISE
/NOTOTAL.
|
|---|
| Resources |
Elapsed Time |
0:00:00,78 |
|---|
Depotstatus
Case Processing Summary
|
Depotstatus |
Cases |
|---|
| Valid |
Missing |
Total |
|---|
| N |
Percent |
N |
Percent |
N |
Percent |
|---|
| ln (relativ handelspris) |
Mistanke |
18 |
100,0% |
0 |
,0% |
18 |
100,0% |
|---|
| Forurenet |
22 |
100,0% |
0 |
,0% |
22 |
100,0% |
|---|
Descriptives
|
Depotstatus |
|
|
Statistic |
Std. Error |
|---|
| ln (relativ handelspris) |
Mistanke |
Mean |
,1723 |
,06705 |
|---|
| 95% Confidence Interval for Mean |
Lower Bound |
,0308 |
|
|---|
| Upper Bound |
,3138 |
|
|---|
| 5% Trimmed Mean |
,1852 |
|
|---|
| Median |
,1531 |
|
|---|
| Variance |
,081 |
|
|---|
| Std. Deviation |
,28449 |
|
|---|
| Minimum |
-,53 |
|
|---|
| Maximum |
,64 |
|
|---|
| Range |
1,17 |
|
|---|
| Interquartile Range |
,35 |
|
|---|
| Skewness |
-,517 |
,536 |
|---|
| Kurtosis |
,865 |
1,038 |
|---|
| Forurenet |
Mean |
,2630 |
,05422 |
|---|
| 95% Confidence Interval for Mean |
Lower Bound |
,1503 |
|
|---|
| Upper Bound |
,3758 |
|
|---|
| 5% Trimmed Mean |
,2535 |
|
|---|
| Median |
,1974 |
|
|---|
| Variance |
,065 |
|
|---|
| Std. Deviation |
,25433 |
|
|---|
| Minimum |
-,15 |
|
|---|
| Maximum |
,87 |
|
|---|
| Range |
1,02 |
|
|---|
| Interquartile Range |
,28 |
|
|---|
| Skewness |
,591 |
,491 |
|---|
| Kurtosis |
,217 |
,953 |
|---|
Percentiles
|
|
Depotstatus |
Percentiles |
|---|
| 5 |
10 |
25 |
50 |
75 |
90 |
95 |
|---|
| Weighted Average(Definition 1) |
ln (relativ handelspris) |
Mistanke |
-,5306 |
-,1554 |
,0094 |
,1531 |
,3623 |
,5623 |
. |
|---|
| Forurenet |
-,1453 |
-,0969 |
,1565 |
,1974 |
,4359 |
,6056 |
,8286 |
|---|
| Tukey's Hinges |
ln (relativ handelspris) |
Mistanke |
|
|
,0254 |
,1531 |
,3507 |
|
|
|---|
| Forurenet |
|
|
,1583 |
,1974 |
,3909 |
|
|
|---|
ln (relativ handelspris)
Histograms
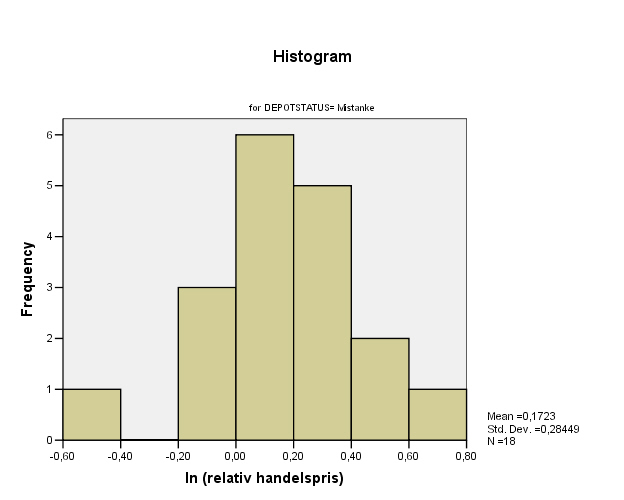
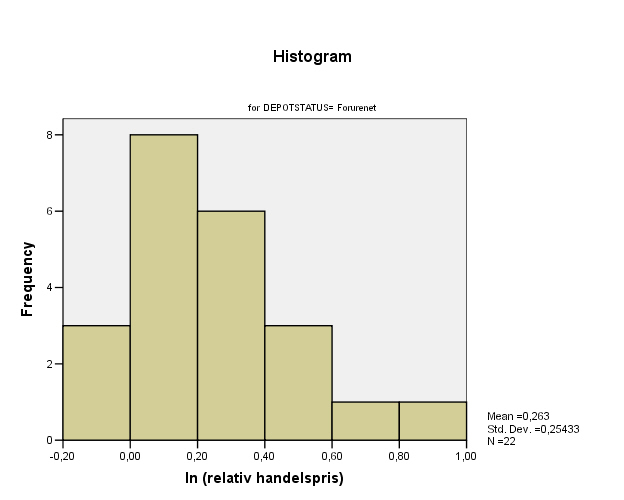
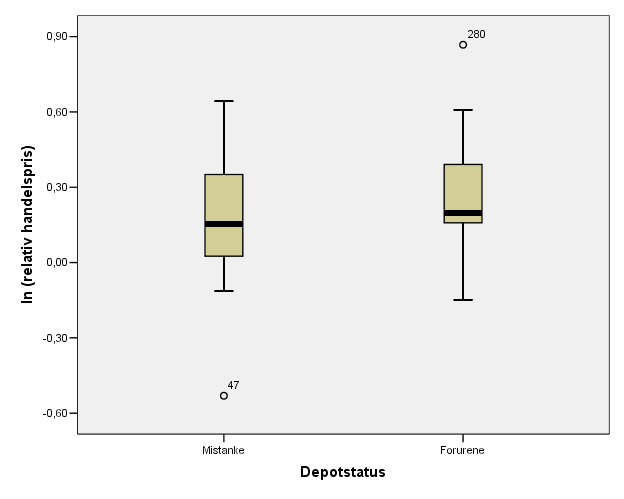
UNIANOVA
  LnRH  BY DEPOTSTATUS
  /METHOD = SSTYPE(3)
  /INTERCEPT = EXCLUDE
  /PLOT = PROFILE( DEPOTSTATUS )
  /EMMEANS = TABLES(DEPOTSTATUS)
  /PRINT = DESCRIPTIVE
  /CRITERIA = ALPHA(.10)
  /DESIGN = DEPOTSTATUS.
Univariate Analysis of Variance
Notes
| Output Created |
23-AUG-2005 15:22:51 |
|---|
| Comments |
|
|---|
| Input |
Data |
W:\sag\1243\Data\Databearbejdning\SPSS\Dataset\Hyp5.sav |
|---|
| Filter |
(LnRH>=-0.47 and LnRH<=0.74 and DEPOTSTATUS=1) or(LnRH>=-0.41 and LnRH<=0.75 and DEPOTSTATUS=2) or(LnRH>=-0.40 and LnRH... (FILTER) |
|---|
| Weight |
<none> |
|---|
| Split File |
<none> |
|---|
| N of Rows in Working Data File |
40 |
|---|
| Missing Value Handling |
Definition of Missing |
User-defined missing values are treated as missing. |
|---|
| Cases Used |
Statistics are based on all cases with valid data for all variables in the model. |
|---|
| Syntax |
UNIANOVA
LnRH BY DEPOTSTATUS
/METHOD = SSTYPE(3)
/INTERCEPT = EXCLUDE
/PLOT = PROFILE( DEPOTSTATUS )
/EMMEANS = TABLES(DEPOTSTATUS)
/PRINT = DESCRIPTIVE
/CRITERIA = ALPHA(.10)
/DESIGN = DEPOTSTATUS.
|
|---|
| Resources |
Elapsed Time |
0:00:00,28 |
|---|
Between-Subjects Factors
|
|
Value Label |
N |
|---|
| Depotstatus |
1 |
Mistanke |
18 |
|---|
| 2 |
Forurenet |
22 |
|---|
Descriptive Statistics
Dependent Variable: ln (relativ handelspris)
| Depotstatus |
Mean |
Std. Deviation |
N |
|---|
| Mistanke |
,1723 |
,28449 |
18 |
|---|
| Forurenet |
,2630 |
,25433 |
22 |
|---|
| Total |
,2222 |
,26870 |
40 |
|---|
Tests of Between-Subjects Effects
Dependent Variable: ln (relativ handelspris)
| Source |
Type III Sum of Squares |
df |
Mean Square |
F |
Sig. |
|---|
| Model |
2,057(a) |
2 |
1,028 |
14,292 |
,000 |
|---|
| DEPOTSTATUS |
2,057 |
2 |
1,028 |
14,292 |
,000 |
|---|
| Error |
2,734 |
38 |
,072 |
|
|
|---|
| Total |
4,791 |
40 |
|
|
|
|---|
| a R Squared = ,429 (Adjusted R Squared = ,399) |
Estimated Marginal Means
Depotstatus
Dependent Variable: ln (relativ handelspris)
| Depotstatus |
Mean |
Std. Error |
90% Confidence Interval |
|---|
| Lower Bound |
Upper Bound |
|---|
| Mistanke |
,172 |
,063 |
,066 |
,279 |
|---|
| Forurenet |
,263 |
,057 |
,167 |
,359 |
|---|
Profile Plots
GET
FILE='W:\sag\1243\Data\Databearbejdning\SPSS\Dataset\Hyp5.sav'.
*Define Variable Properties.
*DEPOTSTATUS.
VARIABLE LABELS DEPOTSTATUS 'Depotstatus'.
VALUE LABELS DEPOTSTATUS
1 'Mistanke'
2 'Forurenet'
3 'Oprenset'
4 'Restforurening'
5 'Undersřgt uden fund' .
*lnRH.
VARIABLE LABELS lnRH 'ln (relativ handelspris)'.
*Type.
FORMATS Type (F11.0).
VALUE LABELS Type
12 'Mistanke til forurenet'
13 'Mistanke til oprenset'
15 'Mistanke til undersřgt uden fund'
23 'Forurenet til oprenset'
24 'Forurenet til restforurening'
25 'Forurenet til undersřgt uden fund' .
EXECUTE.
SAVE OUTFILE='W:\sag\1243\Data\Databearbejdning\SPSS\Dataset\hyp5.sav'
/COMPRESSED.
GET
FILE='W:\sag\1243\Data\Databearbejdning\SPSS\Dataset\Hyp5.sav'.
USE ALL.
COMPUTE filter_$=(Type=15).
VARIABLE LABEL filter_$ 'Type=15 (FILTER)'.
VALUE LABELS filter_$ 0 'Not Selected' 1 'Selected'.
FORMAT filter_$ (f1.0).
FILTER BY filter_$.
EXECUTE .
SUMMARIZE
/TABLES=LnRH BY DEPOTSTATUS
/FORMAT=NOLIST TOTAL
/TITLE='Alle observationer'
/MISSING=VARIABLE
/CELLS=COUNT MEAN MEDIAN MIN MAX STDDEV KURT SKEW .
Summarize
Notes
| Output Created |
23-AUG-2005 15:36:05 |
|---|
| Comments |
|
|---|
| Input |
Data |
W:\sag\1243\Data\Databearbejdning\SPSS\Dataset\Hyp5.sav |
|---|
| Filter |
Type=15 (FILTER) |
|---|
| Weight |
<none> |
|---|
| Split File |
<none> |
|---|
| N of Rows in Working Data File |
59 |
|---|
| Missing Value Handling |
Definition of Missing |
For each dependent variable in a table, user-defined missing values for the dependent and all grouping variables are treated as missing. |
|---|
| Cases Used |
Cases used for each table have no missing values in any independent variable, and not all dependent variables have missing values. |
|---|
| Syntax |
SUMMARIZE
/TABLES=LnRH BY DEPOTSTATUS
/FORMAT=NOLIST TOTAL
/TITLE='Alle observationer'
/MISSING=VARIABLE
/CELLS=COUNT MEAN MEDIAN MIN MAX STDDEV KURT SKEW .
|
|---|
| Resources |
Elapsed Time |
0:00:00,02 |
|---|
Case Processing Summary
|
Cases |
|---|
| Included |
Excluded |
Total |
|---|
| N |
Percent |
N |
Percent |
N |
Percent |
|---|
| ln (relativ handelspris) * Depotstatus |
59 |
100,0% |
0 |
,0% |
59 |
100,0% |
|---|
Alle observationer
ln (relativ handelspris)
| Depotstatus |
N |
Mean |
Median |
Minimum |
Maximum |
Std. Deviation |
Kurtosis |
Skewness |
|---|
| Mistanke |
29 |
,3538 |
,3159 |
-,08 |
1,77 |
,39903 |
4,228 |
1,645 |
|---|
| Undersřgt uden fund |
30 |
,0107 |
,0674 |
-2,77 |
,39 |
,54673 |
25,194 |
-4,820 |
|---|
| Total |
59 |
,1793 |
,1462 |
-2,77 |
1,77 |
,50621 |
21,026 |
-2,839 |
|---|
EXAMINE
  VARIABLES=LnRH BY DEPOTSTATUS
  /PLOT BOXPLOT STEMLEAF
  /COMPARE GROUP
  /PERCENTILES(5,10,25,50,75,90,95) HAVERAGE
  /STATISTICS DESCRIPTIVES
  /CINTERVAL 95
  /MISSING LISTWISE
  /NOTOTAL.
Explore
Notes
| Output Created |
23-AUG-2005 15:36:05 |
|---|
| Comments |
|
|---|
| Input |
Data |
W:\sag\1243\Data\Databearbejdning\SPSS\Dataset\Hyp5.sav |
|---|
| Filter |
Type=15 (FILTER) |
|---|
| Weight |
<none> |
|---|
| Split File |
<none> |
|---|
| N of Rows in Working Data File |
59 |
|---|
| Missing Value Handling |
Definition of Missing |
User-defined missing values for dependent variables are treated as missing. |
|---|
| Cases Used |
Statistics are based on cases with no missing values for any dependent variable or factor used. |
|---|
| Syntax |
EXAMINE
VARIABLES=LnRH BY DEPOTSTATUS
/PLOT BOXPLOT STEMLEAF
/COMPARE GROUP
/PERCENTILES(5,10,25,50,75,90,95) HAVERAGE
/STATISTICS DESCRIPTIVES
/CINTERVAL 95
/MISSING LISTWISE
/NOTOTAL.
|
|---|
| Resources |
Elapsed Time |
0:00:00,25 |
|---|
Depotstatus
Case Processing Summary
|
Depotstatus |
Cases |
|---|
| Valid |
Missing |
Total |
|---|
| N |
Percent |
N |
Percent |
N |
Percent |
|---|
| ln (relativ handelspris) |
Mistanke |
29 |
100,0% |
0 |
,0% |
29 |
100,0% |
|---|
| Undersřgt uden fund |
30 |
100,0% |
0 |
,0% |
30 |
100,0% |
|---|
Descriptives
|
Depotstatus |
|
|
Statistic |
Std. Error |
|---|
| ln (relativ handelspris) |
Mistanke |
Mean |
,3538 |
,07410 |
|---|
| 95% Confidence Interval for Mean |
Lower Bound |
,2020 |
|
|---|
| Upper Bound |
,5055 |
|
|---|
| 5% Trimmed Mean |
,3156 |
|
|---|
| Median |
,3159 |
|
|---|
| Variance |
,159 |
|
|---|
| Std. Deviation |
,39903 |
|
|---|
| Minimum |
-,08 |
|
|---|
| Maximum |
1,77 |
|
|---|
| Range |
1,85 |
|
|---|
| Interquartile Range |
,63 |
|
|---|
| Skewness |
1,645 |
,434 |
|---|
| Kurtosis |
4,228 |
,845 |
|---|
| Undersřgt uden fund |
Mean |
,0107 |
,09982 |
|---|
| 95% Confidence Interval for Mean |
Lower Bound |
-,1935 |
|
|---|
| Upper Bound |
,2148 |
|
|---|
| 5% Trimmed Mean |
,0973 |
|
|---|
| Median |
,0674 |
|
|---|
| Variance |
,299 |
|
|---|
| Std. Deviation |
,54673 |
|
|---|
| Minimum |
-2,77 |
|
|---|
| Maximum |
,39 |
|
|---|
| Range |
3,16 |
|
|---|
| Interquartile Range |
,18 |
|
|---|
| Skewness |
-4,820 |
,427 |
|---|
| Kurtosis |
25,194 |
,833 |
|---|
Percentiles
|
|
Depotstatus |
Percentiles |
|---|
| 5 |
10 |
25 |
50 |
75 |
90 |
95 |
|---|
| Weighted Average(Definition 1) |
ln (relativ handelspris) |
Mistanke |
-,0764 |
-,0426 |
,0157 |
,3159 |
,6433 |
,7824 |
1,2905 |
|---|
| Undersřgt uden fund |
-1,3744 |
-,1202 |
,0138 |
,0674 |
,1919 |
,3605 |
,3842 |
|---|
| Tukey's Hinges |
ln (relativ handelspris) |
Mistanke |
|
|
,0244 |
,3159 |
,6229 |
|
|
|---|
| Undersřgt uden fund |
|
|
,0183 |
,0674 |
,1873 |
|
|
|---|
ln (relativ handelspris)
Stem-and-Leaf Plots
ln (relativ handelspris) Stem-and-Leaf Plot for
DEPOTSTATUS= Mistanke

 Frequency    Stem &  Leaf

     5,00       -0 .  23477
     4,00        0 .  0027
     3,00        1 .  445
     2,00        2 .  25
     6,00        3 .  144569
     1,00        4 .  7
      ,00        5 .
     2,00        6 .  26
     4,00        7 .  4468
     1,00        8 .  1
     1,00 Extremes    (>=1,77)

 Stem width:       ,10
 Each leaf:       1 case(s)
ln (relativ handelspris) Stem-and-Leaf Plot for
DEPOTSTATUS= Undersřgt uden fund
Frequency Stem & Leaf
1,00 Extremes (=<-2,77)
1,00 -2 . 3
1,00 -1 . 2
3,00 -0 . 134
13,00 0 . 0112245567889
4,00 1 . 4558
2,00 2 . 07
5,00 3 . 23679
Stem width: ,10
Each leaf: 1 case(s)
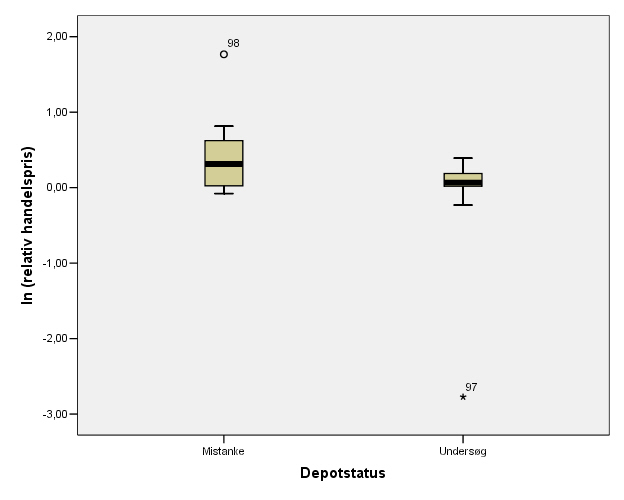
USE ALL.
COMPUTE filter_$=(TYPE=15 and ((LnRH>=-10 and LnRH<=1.77 and DEPOTSTATUS=1) or
(LnRH>=-2.77 and LnRH<=10 and DEPOTSTATUS=5))).
VARIABLE LABEL filter_$ '(LnRH>=-0.47 and LnRH<=0.74 and DEPOTSTATUS=1) or'+
'(LnRH>=-0.41 and LnRH<=0.75 and DEPOTSTATUS=2) or'+
'(LnRH>=-0.40 and LnRH... (FILTER)'.
VALUE LABELS filter_$ 0 'Not Selected' 1 'Selected'.
FORMAT filter_$ (f1.0).
FILTER BY filter_$.
EXECUTE .
SUMMARIZE
/TABLES=LnRH BY DEPOTSTATUS
/FORMAT=NOLIST TOTAL
/TITLE='Afskĺret med depotstatusvis stem-leaf-plot'
/MISSING=VARIABLE
/CELLS=COUNT MEAN MEDIAN MIN MAX STDDEV KURT SKEW .
Summarize
Notes
| Output Created |
23-AUG-2005 15:36:05 |
|---|
| Comments |
|
|---|
| Input |
Data |
W:\sag\1243\Data\Databearbejdning\SPSS\Dataset\Hyp5.sav |
|---|
| Filter |
(LnRH>=-0.47 and LnRH<=0.74 and DEPOTSTATUS=1) or(LnRH>=-0.41 and LnRH<=0.75 and DEPOTSTATUS=2) or(LnRH>=-0.40 and LnRH... (FILTER) |
|---|
| Weight |
<none> |
|---|
| Split File |
<none> |
|---|
| N of Rows in Working Data File |
58 |
|---|
| Missing Value Handling |
Definition of Missing |
For each dependent variable in a table, user-defined missing values for the dependent and all grouping variables are treated as missing. |
|---|
| Cases Used |
Cases used for each table have no missing values in any independent variable, and not all dependent variables have missing values. |
|---|
| Syntax |
SUMMARIZE
/TABLES=LnRH BY DEPOTSTATUS
/FORMAT=NOLIST TOTAL
/TITLE='Afskĺret med depotstatusvis stem-leaf-plot'
/MISSING=VARIABLE
/CELLS=COUNT MEAN MEDIAN MIN MAX STDDEV KURT SKEW .
|
|---|
| Resources |
Elapsed Time |
0:00:00,02 |
|---|
Case Processing Summary
|
Cases |
|---|
| Included |
Excluded |
Total |
|---|
| N |
Percent |
N |
Percent |
N |
Percent |
|---|
| ln (relativ handelspris) * Depotstatus |
58 |
100,0% |
0 |
,0% |
58 |
100,0% |
|---|
Afskĺret med depotstatusvis stem-leaf-plot
ln (relativ handelspris)
| Depotstatus |
N |
Mean |
Median |
Minimum |
Maximum |
Std. Deviation |
Kurtosis |
Skewness |
|---|
| Mistanke |
29 |
,3538 |
,3159 |
-,08 |
1,77 |
,39903 |
4,228 |
1,645 |
|---|
| Undersřgt uden fund |
29 |
,1066 |
,0702 |
-,23 |
,39 |
,15293 |
-,123 |
,265 |
|---|
| Total |
58 |
,2302 |
,1463 |
-,23 |
1,77 |
,32441 |
7,742 |
2,214 |
|---|
EXAMINE
  VARIABLES=LnRH BY DEPOTSTATUS
  /PLOT BOXPLOT HISTOGRAM
  /COMPARE GROUP
  /PERCENTILES(5,10,25,50,75,90,95) HAVERAGE
  /STATISTICS DESCRIPTIVES
  /CINTERVAL 95
  /MISSING LISTWISE
  /NOTOTAL.
Explore
Notes
| Output Created |
23-AUG-2005 15:36:05 |
|---|
| Comments |
|
|---|
| Input |
Data |
W:\sag\1243\Data\Databearbejdning\SPSS\Dataset\Hyp5.sav |
|---|
| Filter |
(LnRH>=-0.47 and LnRH<=0.74 and DEPOTSTATUS=1) or(LnRH>=-0.41 and LnRH<=0.75 and DEPOTSTATUS=2) or(LnRH>=-0.40 and LnRH... (FILTER) |
|---|
| Weight |
<none> |
|---|
| Split File |
<none> |
|---|
| N of Rows in Working Data File |
58 |
|---|
| Missing Value Handling |
Definition of Missing |
User-defined missing values for dependent variables are treated as missing. |
|---|
| Cases Used |
Statistics are based on cases with no missing values for any dependent variable or factor used. |
|---|
| Syntax |
EXAMINE
VARIABLES=LnRH BY DEPOTSTATUS
/PLOT BOXPLOT HISTOGRAM
/COMPARE GROUP
/PERCENTILES(5,10,25,50,75,90,95) HAVERAGE
/STATISTICS DESCRIPTIVES
/CINTERVAL 95
/MISSING LISTWISE
/NOTOTAL.
|
|---|
| Resources |
Elapsed Time |
0:00:00,84 |
|---|
Depotstatus
Case Processing Summary
|
Depotstatus |
Cases |
|---|
| Valid |
Missing |
Total |
|---|
| N |
Percent |
N |
Percent |
N |
Percent |
|---|
| ln (relativ handelspris) |
Mistanke |
29 |
100,0% |
0 |
,0% |
29 |
100,0% |
|---|
| Undersřgt uden fund |
29 |
100,0% |
0 |
,0% |
29 |
100,0% |
|---|
Descriptives
|
Depotstatus |
|
|
Statistic |
Std. Error |
|---|
| ln (relativ handelspris) |
Mistanke |
Mean |
,3538 |
,07410 |
|---|
| 95% Confidence Interval for Mean |
Lower Bound |
,2020 |
|
|---|
| Upper Bound |
,5055 |
|
|---|
| 5% Trimmed Mean |
,3156 |
|
|---|
| Median |
,3159 |
|
|---|
| Variance |
,159 |
|
|---|
| Std. Deviation |
,39903 |
|
|---|
| Minimum |
-,08 |
|
|---|
| Maximum |
1,77 |
|
|---|
| Range |
1,85 |
|
|---|
| Interquartile Range |
,63 |
|
|---|
| Skewness |
1,645 |
,434 |
|---|
| Kurtosis |
4,228 |
,845 |
|---|
| Undersřgt uden fund |
Mean |
,1066 |
,02840 |
|---|
| 95% Confidence Interval for Mean |
Lower Bound |
,0485 |
|
|---|
| Upper Bound |
,1648 |
|
|---|
| 5% Trimmed Mean |
,1080 |
|
|---|
| Median |
,0702 |
|
|---|
| Variance |
,023 |
|
|---|
| Std. Deviation |
,15293 |
|
|---|
| Minimum |
-,23 |
|
|---|
| Maximum |
,39 |
|
|---|
| Range |
,62 |
|
|---|
| Interquartile Range |
,18 |
|
|---|
| Skewness |
,265 |
,434 |
|---|
| Kurtosis |
-,123 |
,845 |
|---|
Percentiles
|
|
Depotstatus |
Percentiles |
|---|
| 5 |
10 |
25 |
50 |
75 |
90 |
95 |
|---|
| Weighted Average(Definition 1) |
ln (relativ handelspris) |
Mistanke |
-,0764 |
-,0426 |
,0157 |
,3159 |
,6433 |
,7824 |
1,2905 |
|---|
| Undersřgt uden fund |
-,1794 |
-,0465 |
,0183 |
,0702 |
,1965 |
,3639 |
,3849 |
|---|
| Tukey's Hinges |
ln (relativ handelspris) |
Mistanke |
|
|
,0244 |
,3159 |
,6229 |
|
|
|---|
| Undersřgt uden fund |
|
|
,0183 |
,0702 |
,1873 |
|
|
|---|
ln (relativ handelspris)
Histograms
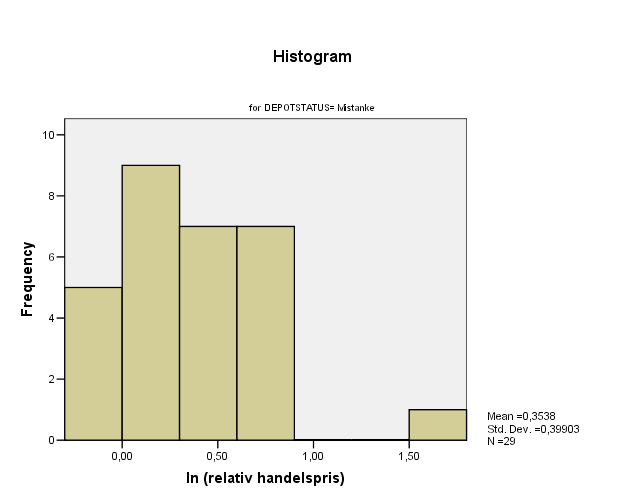
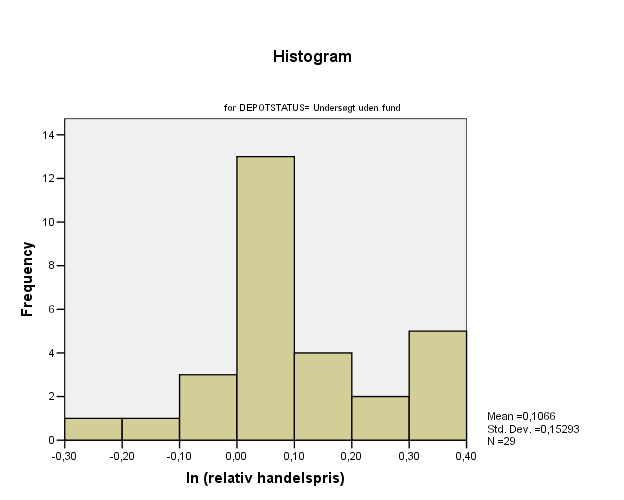
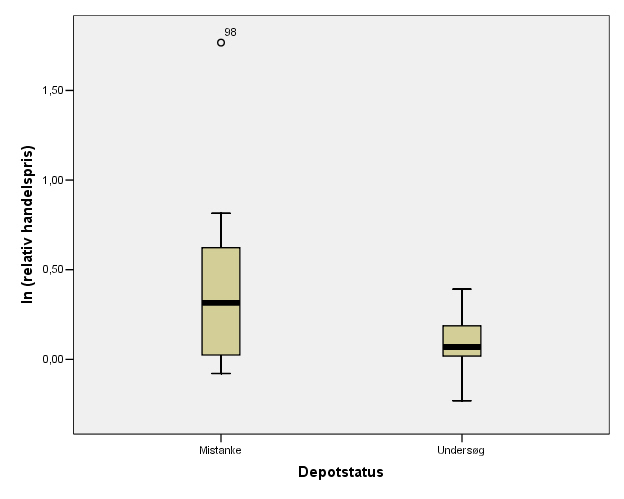
UNIANOVA
  LnRH  BY DEPOTSTATUS
  /METHOD = SSTYPE(3)
  /INTERCEPT = EXCLUDE
  /PLOT = PROFILE( DEPOTSTATUS )
  /EMMEANS = TABLES(DEPOTSTATUS)
  /PRINT = DESCRIPTIVE
  /CRITERIA = ALPHA(.10)
  /DESIGN = DEPOTSTATUS.
Univariate Analysis of Variance
Notes
| Output Created |
23-AUG-2005 15:36:06 |
|---|
| Comments |
|
|---|
| Input |
Data |
W:\sag\1243\Data\Databearbejdning\SPSS\Dataset\Hyp5.sav |
|---|
| Filter |
(LnRH>=-0.47 and LnRH<=0.74 and DEPOTSTATUS=1) or(LnRH>=-0.41 and LnRH<=0.75 and DEPOTSTATUS=2) or(LnRH>=-0.40 and LnRH... (FILTER) |
|---|
| Weight |
<none> |
|---|
| Split File |
<none> |
|---|
| N of Rows in Working Data File |
58 |
|---|
| Missing Value Handling |
Definition of Missing |
User-defined missing values are treated as missing. |
|---|
| Cases Used |
Statistics are based on all cases with valid data for all variables in the model. |
|---|
| Syntax |
UNIANOVA
LnRH BY DEPOTSTATUS
/METHOD = SSTYPE(3)
/INTERCEPT = EXCLUDE
/PLOT = PROFILE( DEPOTSTATUS )
/EMMEANS = TABLES(DEPOTSTATUS)
/PRINT = DESCRIPTIVE
/CRITERIA = ALPHA(.10)
/DESIGN = DEPOTSTATUS.
|
|---|
| Resources |
Elapsed Time |
0:00:00,30 |
|---|
Between-Subjects Factors
|
|
Value Label |
N |
|---|
| Depotstatus |
1 |
Mistanke |
29 |
|---|
| 5 |
Undersřgt uden fund |
29 |
|---|
Descriptive Statistics
Dependent Variable: ln (relativ handelspris)
| Depotstatus |
Mean |
Std. Deviation |
N |
|---|
| Mistanke |
,3538 |
,39903 |
29 |
|---|
| Undersřgt uden fund |
,1066 |
,15293 |
29 |
|---|
| Total |
,2302 |
,32441 |
58 |
|---|
Tests of Between-Subjects Effects
Dependent Variable: ln (relativ handelspris)
| Source |
Type III Sum of Squares |
df |
Mean Square |
F |
Sig. |
|---|
| Model |
3,959(a) |
2 |
1,979 |
21,679 |
,000 |
|---|
| DEPOTSTATUS |
3,959 |
2 |
1,979 |
21,679 |
,000 |
|---|
| Error |
5,113 |
56 |
,091 |
|
|
|---|
| Total |
9,072 |
58 |
|
|
|
|---|
| a R Squared = ,436 (Adjusted R Squared = ,416) |
Estimated Marginal Means
Depotstatus
Dependent Variable: ln (relativ handelspris)
| Depotstatus |
Mean |
Std. Error |
90% Confidence Interval |
|---|
| Lower Bound |
Upper Bound |
|---|
| Mistanke |
,354 |
,056 |
,260 |
,448 |
|---|
| Undersřgt uden fund |
,107 |
,056 |
,013 |
,200 |
|---|
Profile Plots
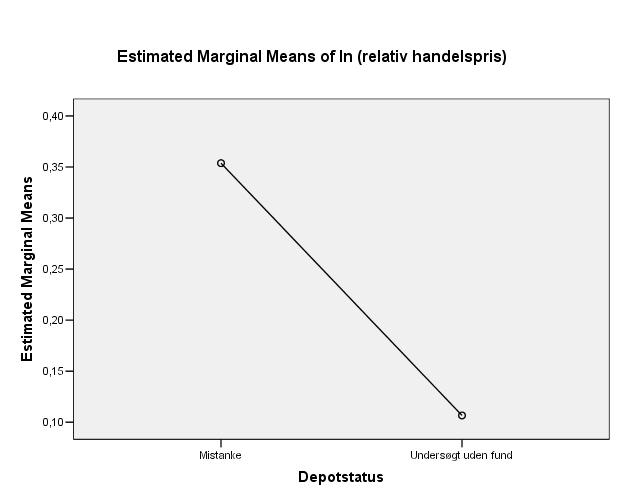
GET
FILE='W:\sag\1243\Data\Databearbejdning\SPSS\Dataset\Hyp5.sav'.
*Define Variable Properties.
*DEPOTSTATUS.
VARIABLE LABELS DEPOTSTATUS 'Depotstatus'.
VALUE LABELS DEPOTSTATUS
1 'Mistanke'
2 'Forurenet'
3 'Oprenset'
4 'Restforurening'
5 'Undersřgt uden fund' .
*lnRH.
VARIABLE LABELS lnRH 'ln (relativ handelspris)'.
*Type.
FORMATS Type (F11.0).
VALUE LABELS Type
12 'Mistanke til forurenet'
13 'Mistanke til oprenset'
15 'Mistanke til undersřgt uden fund'
23 'Forurenet til oprenset'
24 'Forurenet til restforurening'
25 'Forurenet til undersřgt uden fund' .
EXECUTE.
SAVE OUTFILE='W:\sag\1243\Data\Databearbejdning\SPSS\Dataset\hyp5.sav'
/COMPRESSED.
GET
FILE='W:\sag\1243\Data\Databearbejdning\SPSS\Dataset\Hyp5.sav'.
USE ALL.
COMPUTE filter_$=(Type=23).
VARIABLE LABEL filter_$ 'Type=23 (FILTER)'.
VALUE LABELS filter_$ 0 'Not Selected' 1 'Selected'.
FORMAT filter_$ (f1.0).
FILTER BY filter_$.
EXECUTE .
SUMMARIZE
/TABLES=LnRH BY DEPOTSTATUS
/FORMAT=NOLIST TOTAL
/TITLE='Alle observationer'
/MISSING=VARIABLE
/CELLS=COUNT MEAN MEDIAN MIN MAX STDDEV KURT SKEW .
Summarize
Notes
| Output Created |
23-AUG-2005 15:43:25 |
|---|
| Comments |
|
|---|
| Input |
Data |
W:\sag\1243\Data\Databearbejdning\SPSS\Dataset\Hyp5.sav |
|---|
| Filter |
Type=23 (FILTER) |
|---|
| Weight |
<none> |
|---|
| Split File |
<none> |
|---|
| N of Rows in Working Data File |
92 |
|---|
| Missing Value Handling |
Definition of Missing |
For each dependent variable in a table, user-defined missing values for the dependent and all grouping variables are treated as missing. |
|---|
| Cases Used |
Cases used for each table have no missing values in any independent variable, and not all dependent variables have missing values. |
|---|
| Syntax |
SUMMARIZE
/TABLES=LnRH BY DEPOTSTATUS
/FORMAT=NOLIST TOTAL
/TITLE='Alle observationer'
/MISSING=VARIABLE
/CELLS=COUNT MEAN MEDIAN MIN MAX STDDEV KURT SKEW .
|
|---|
| Resources |
Elapsed Time |
0:00:00,02 |
|---|
Case Processing Summary
|
Cases |
|---|
| Included |
Excluded |
Total |
|---|
| N |
Percent |
N |
Percent |
N |
Percent |
|---|
| ln (relativ handelspris) * Depotstatus |
92 |
100,0% |
0 |
,0% |
92 |
100,0% |
|---|
Alle observationer
ln (relativ handelspris)
| Depotstatus |
N |
Mean |
Median |
Minimum |
Maximum |
Std. Deviation |
Kurtosis |
Skewness |
|---|
| Forurenet |
42 |
,2981 |
,3841 |
-1,20 |
1,78 |
,41548 |
6,594 |
-,187 |
|---|
| Oprenset |
50 |
,2280 |
,2248 |
-1,16 |
1,39 |
,34966 |
6,722 |
-,301 |
|---|
| Total |
92 |
,2600 |
,2681 |
-1,20 |
1,78 |
,38059 |
6,350 |
-,182 |
|---|
EXAMINE
  VARIABLES=LnRH BY DEPOTSTATUS
  /PLOT BOXPLOT STEMLEAF
  /COMPARE GROUP
  /PERCENTILES(5,10,25,50,75,90,95) HAVERAGE
  /STATISTICS DESCRIPTIVES
  /CINTERVAL 95
  /MISSING LISTWISE
  /NOTOTAL.
Explore
Notes
| Output Created |
23-AUG-2005 15:43:25 |
|---|
| Comments |
|
|---|
| Input |
Data |
W:\sag\1243\Data\Databearbejdning\SPSS\Dataset\Hyp5.sav |
|---|
| Filter |
Type=23 (FILTER) |
|---|
| Weight |
<none> |
|---|
| Split File |
<none> |
|---|
| N of Rows in Working Data File |
92 |
|---|
| Missing Value Handling |
Definition of Missing |
User-defined missing values for dependent variables are treated as missing. |
|---|
| Cases Used |
Statistics are based on cases with no missing values for any dependent variable or factor used. |
|---|
| Syntax |
EXAMINE
VARIABLES=LnRH BY DEPOTSTATUS
/PLOT BOXPLOT STEMLEAF
/COMPARE GROUP
/PERCENTILES(5,10,25,50,75,90,95) HAVERAGE
/STATISTICS DESCRIPTIVES
/CINTERVAL 95
/MISSING LISTWISE
/NOTOTAL.
|
|---|
| Resources |
Elapsed Time |
0:00:00,28 |
|---|
Depotstatus
Case Processing Summary
|
Depotstatus |
Cases |
|---|
| Valid |
Missing |
Total |
|---|
| N |
Percent |
N |
Percent |
N |
Percent |
|---|
| ln (relativ handelspris) |
Forurenet |
42 |
100,0% |
0 |
,0% |
42 |
100,0% |
|---|
| Oprenset |
50 |
100,0% |
0 |
,0% |
50 |
100,0% |
|---|
Descriptives
|
Depotstatus |
|
|
Statistic |
Std. Error |
|---|
| ln (relativ handelspris) |
Forurenet |
Mean |
,2981 |
,06411 |
|---|
| 95% Confidence Interval for Mean |
Lower Bound |
,1686 |
|
|---|
| Upper Bound |
,4276 |
|
|---|
| 5% Trimmed Mean |
,3044 |
|
|---|
| Median |
,3841 |
|
|---|
| Variance |
,173 |
|
|---|
| Std. Deviation |
,41548 |
|
|---|
| Minimum |
-1,20 |
|
|---|
| Maximum |
1,78 |
|
|---|
| Range |
2,99 |
|
|---|
| Interquartile Range |
,40 |
|
|---|
| Skewness |
-,187 |
,365 |
|---|
| Kurtosis |
6,594 |
,717 |
|---|
| Oprenset |
Mean |
,2280 |
,04945 |
|---|
| 95% Confidence Interval for Mean |
Lower Bound |
,1286 |
|
|---|
| Upper Bound |
,3273 |
|
|---|
| 5% Trimmed Mean |
,2258 |
|
|---|
| Median |
,2248 |
|
|---|
| Variance |
,122 |
|
|---|
| Std. Deviation |
,34966 |
|
|---|
| Minimum |
-1,16 |
|
|---|
| Maximum |
1,39 |
|
|---|
| Range |
2,55 |
|
|---|
| Interquartile Range |
,28 |
|
|---|
| Skewness |
-,301 |
,337 |
|---|
| Kurtosis |
6,722 |
,662 |
|---|
Percentiles
|
|
Depotstatus |
Percentiles |
|---|
| 5 |
10 |
25 |
50 |
75 |
90 |
95 |
|---|
| Weighted Average(Definition 1) |
ln (relativ handelspris) |
Forurenet |
-,3224 |
-,1445 |
,0734 |
,3841 |
,4734 |
,6316 |
,7209 |
|---|
| Oprenset |
-,2702 |
-,0121 |
,1029 |
,2248 |
,3787 |
,5022 |
,9264 |
|---|
| Tukey's Hinges |
ln (relativ handelspris) |
Forurenet |
|
|
,0770 |
,3841 |
,4700 |
|
|
|---|
| Oprenset |
|
|
,1071 |
,2248 |
,3786 |
|
|
|---|
ln (relativ handelspris)
Stem-and-Leaf Plots
ln (relativ handelspris) Stem-and-Leaf Plot for
DEPOTSTATUS= Forurenet

 Frequency    Stem &  Leaf

     1,00 Extremes    (=<-1,20)
     1,00       -3 .  4
     1,00       -2 .  1
     1,00       -1 .  7
     2,00       -0 .  28
     6,00        0 .  125679
     3,00        1 .  224
     1,00        2 .  9
     6,00        3 .  224579
    11,00        4 .  00022336678
     4,00        5 .  0567
     3,00        6 .  134
     1,00        7 .  3
     1,00 Extremes    (>=1,78)

 Stem width:       ,10
 Each leaf:       1 case(s)
ln (relativ handelspris) Stem-and-Leaf Plot for
DEPOTSTATUS= Oprenset

 Frequency    Stem &  Leaf

     2,00 Extremes    (=<-,37)
     2,00       -1 .  48
     1,00       -0 .  1
     7,00        0 .  0111449
    12,00        1 .  001135566689
    10,00        2 .  0446666688
     7,00        3 .  0127789
     4,00        4 .  1788
     2,00        5 .  08
     3,00 Extremes    (>=,81)

 Stem width:       ,10
 Each leaf:       1 case(s)
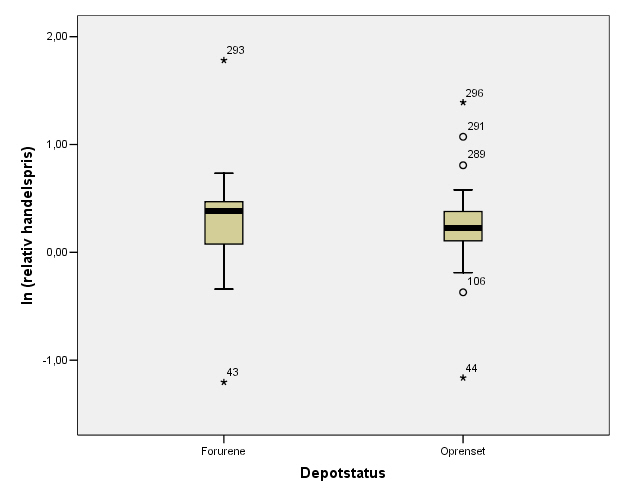
USE ALL.
COMPUTE filter_$=(TYPE=23 and ((LnRH>=-1.2 and LnRH<=1.78 and DEPOTSTATUS=2) or
(LnRH>=-0.37 and LnRH<=0.81 and DEPOTSTATUS=3))).
VARIABLE LABEL filter_$ '(LnRH>=-0.47 and LnRH<=0.74 and DEPOTSTATUS=1) or'+
'(LnRH>=-0.41 and LnRH<=0.75 and DEPOTSTATUS=2) or'+
'(LnRH>=-0.40 and LnRH... (FILTER)'.
VALUE LABELS filter_$ 0 'Not Selected' 1 'Selected'.
FORMAT filter_$ (f1.0).
FILTER BY filter_$.
EXECUTE .
SUMMARIZE
/TABLES=LnRH BY DEPOTSTATUS
/FORMAT=NOLIST TOTAL
/TITLE='Afskĺret med depotstatusvis stem-leaf-plot'
/MISSING=VARIABLE
/CELLS=COUNT MEAN MEDIAN MIN MAX STDDEV KURT SKEW .
Summarize
Notes
| Output Created |
23-AUG-2005 15:43:25 |
|---|
| Comments |
|
|---|
| Input |
Data |
W:\sag\1243\Data\Databearbejdning\SPSS\Dataset\Hyp5.sav |
|---|
| Filter |
(LnRH>=-0.47 and LnRH<=0.74 and DEPOTSTATUS=1) or(LnRH>=-0.41 and LnRH<=0.75 and DEPOTSTATUS=2) or(LnRH>=-0.40 and LnRH... (FILTER) |
|---|
| Weight |
<none> |
|---|
| Split File |
<none> |
|---|
| N of Rows in Working Data File |
86 |
|---|
| Missing Value Handling |
Definition of Missing |
For each dependent variable in a table, user-defined missing values for the dependent and all grouping variables are treated as missing. |
|---|
| Cases Used |
Cases used for each table have no missing values in any independent variable, and not all dependent variables have missing values. |
|---|
| Syntax |
SUMMARIZE
/TABLES=LnRH BY DEPOTSTATUS
/FORMAT=NOLIST TOTAL
/TITLE='Afskĺret med depotstatusvis stem-leaf-plot'
/MISSING=VARIABLE
/CELLS=COUNT MEAN MEDIAN MIN MAX STDDEV KURT SKEW .
|
|---|
| Resources |
Elapsed Time |
0:00:00,02 |
|---|
Case Processing Summary
|
Cases |
|---|
| Included |
Excluded |
Total |
|---|
| N |
Percent |
N |
Percent |
N |
Percent |
|---|
| ln (relativ handelspris) * Depotstatus |
86 |
100,0% |
0 |
,0% |
86 |
100,0% |
|---|
Afskĺret med depotstatusvis stem-leaf-plot
ln (relativ handelspris)
| Depotstatus |
N |
Mean |
Median |
Minimum |
Maximum |
Std. Deviation |
Kurtosis |
Skewness |
|---|
| Forurenet |
40 |
,2986 |
,3841 |
-,34 |
,73 |
,25927 |
-,321 |
-,619 |
|---|
| Oprenset |
46 |
,2276 |
,2248 |
-,19 |
,81 |
,19051 |
,962 |
,438 |
|---|
| Total |
86 |
,2606 |
,2681 |
-,34 |
,81 |
,22655 |
-,167 |
-,137 |
|---|
EXAMINE
  VARIABLES=LnRH BY DEPOTSTATUS
  /PLOT BOXPLOT HISTOGRAM
  /COMPARE GROUP
  /PERCENTILES(5,10,25,50,75,90,95) HAVERAGE
  /STATISTICS DESCRIPTIVES
  /CINTERVAL 95
  /MISSING LISTWISE
  /NOTOTAL.
Explore
Notes
| Output Created |
23-AUG-2005 15:43:25 |
|---|
| Comments |
|
|---|
| Input |
Data |
W:\sag\1243\Data\Databearbejdning\SPSS\Dataset\Hyp5.sav |
|---|
| Filter |
(LnRH>=-0.47 and LnRH<=0.74 and DEPOTSTATUS=1) or(LnRH>=-0.41 and LnRH<=0.75 and DEPOTSTATUS=2) or(LnRH>=-0.40 and LnRH... (FILTER) |
|---|
| Weight |
<none> |
|---|
| Split File |
<none> |
|---|
| N of Rows in Working Data File |
86 |
|---|
| Missing Value Handling |
Definition of Missing |
User-defined missing values for dependent variables are treated as missing. |
|---|
| Cases Used |
Statistics are based on cases with no missing values for any dependent variable or factor used. |
|---|
| Syntax |
EXAMINE
VARIABLES=LnRH BY DEPOTSTATUS
/PLOT BOXPLOT HISTOGRAM
/COMPARE GROUP
/PERCENTILES(5,10,25,50,75,90,95) HAVERAGE
/STATISTICS DESCRIPTIVES
/CINTERVAL 95
/MISSING LISTWISE
/NOTOTAL.
|
|---|
| Resources |
Elapsed Time |
0:00:00,80 |
|---|
Depotstatus
Case Processing Summary
|
Depotstatus |
Cases |
|---|
| Valid |
Missing |
Total |
|---|
| N |
Percent |
N |
Percent |
N |
Percent |
|---|
| ln (relativ handelspris) |
Forurenet |
40 |
100,0% |
0 |
,0% |
40 |
100,0% |
|---|
| Oprenset |
46 |
100,0% |
0 |
,0% |
46 |
100,0% |
|---|
Descriptives
|
Depotstatus |
|
|
Statistic |
Std. Error |
|---|
| ln (relativ handelspris) |
Forurenet |
Mean |
,2986 |
,04099 |
|---|
| 95% Confidence Interval for Mean |
Lower Bound |
,2157 |
|
|---|
| Upper Bound |
,3815 |
|
|---|
| 5% Trimmed Mean |
,3089 |
|
|---|
| Median |
,3841 |
|
|---|
| Variance |
,067 |
|
|---|
| Std. Deviation |
,25927 |
|
|---|
| Minimum |
-,34 |
|
|---|
| Maximum |
,73 |
|
|---|
| Range |
1,07 |
|
|---|
| Interquartile Range |
,39 |
|
|---|
| Skewness |
-,619 |
,374 |
|---|
| Kurtosis |
-,321 |
,733 |
|---|
| Oprenset |
Mean |
,2276 |
,02809 |
|---|
| 95% Confidence Interval for Mean |
Lower Bound |
,1710 |
|
|---|
| Upper Bound |
,2842 |
|
|---|
| 5% Trimmed Mean |
,2240 |
|
|---|
| Median |
,2248 |
|
|---|
| Variance |
,036 |
|
|---|
| Std. Deviation |
,19051 |
|
|---|
| Minimum |
-,19 |
|
|---|
| Maximum |
,81 |
|
|---|
| Range |
1,00 |
|
|---|
| Interquartile Range |
,23 |
|
|---|
| Skewness |
,438 |
,350 |
|---|
| Kurtosis |
,962 |
,688 |
|---|
Percentiles
|
|
Depotstatus |
Percentiles |
|---|
| 5 |
10 |
25 |
50 |
75 |
90 |
95 |
|---|
| Weighted Average(Definition 1) |
ln (relativ handelspris) |
Forurenet |
-,2154 |
-,0779 |
,0808 |
,3841 |
,4686 |
,6126 |
,6489 |
|---|
| Oprenset |
-,1019 |
,0073 |
,1081 |
,2248 |
,3388 |
,4858 |
,5533 |
|---|
| Tukey's Hinges |
ln (relativ handelspris) |
Forurenet |
|
|
,0847 |
,3841 |
,4673 |
|
|
|---|
| Oprenset |
|
|
,1084 |
,2248 |
,3256 |
|
|
|---|
ln (relativ handelspris)
Histograms
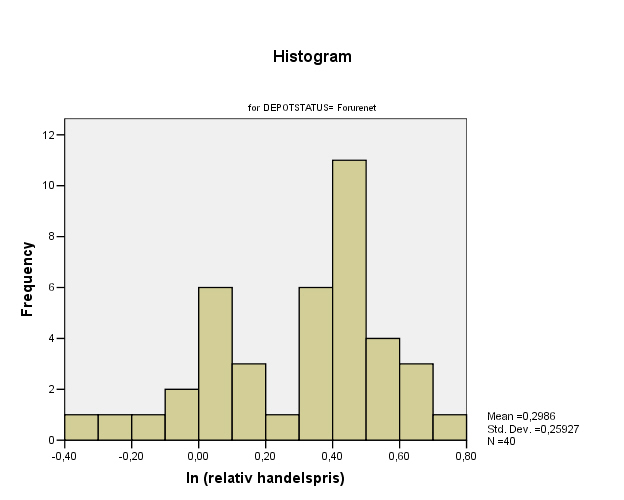
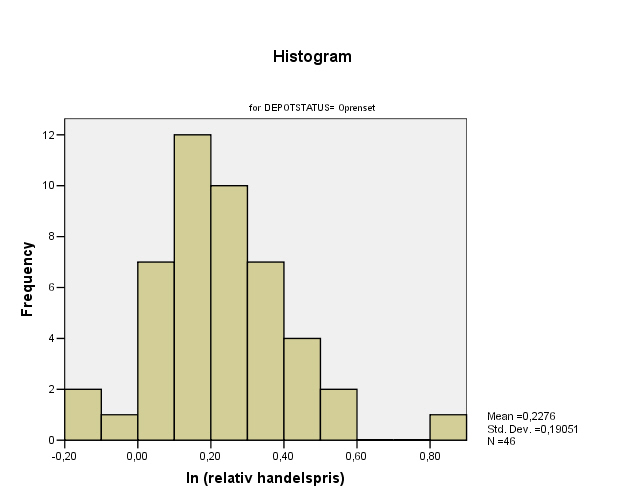
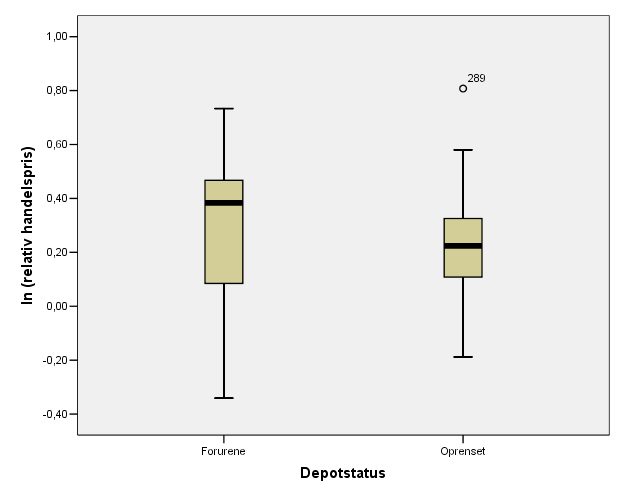
UNIANOVA
  LnRH  BY DEPOTSTATUS
  /METHOD = SSTYPE(3)
  /INTERCEPT = EXCLUDE
  /PLOT = PROFILE( DEPOTSTATUS )
  /EMMEANS = TABLES(DEPOTSTATUS)
  /PRINT = DESCRIPTIVE
  /CRITERIA = ALPHA(.10)
  /DESIGN = DEPOTSTATUS.
Univariate Analysis of Variance
Notes
| Output Created |
23-AUG-2005 15:43:26 |
|---|
| Comments |
|
|---|
| Input |
Data |
W:\sag\1243\Data\Databearbejdning\SPSS\Dataset\Hyp5.sav |
|---|
| Filter |
(LnRH>=-0.47 and LnRH<=0.74 and DEPOTSTATUS=1) or(LnRH>=-0.41 and LnRH<=0.75 and DEPOTSTATUS=2) or(LnRH>=-0.40 and LnRH... (FILTER) |
|---|
| Weight |
<none> |
|---|
| Split File |
<none> |
|---|
| N of Rows in Working Data File |
86 |
|---|
| Missing Value Handling |
Definition of Missing |
User-defined missing values are treated as missing. |
|---|
| Cases Used |
Statistics are based on all cases with valid data for all variables in the model. |
|---|
| Syntax |
UNIANOVA
LnRH BY DEPOTSTATUS
/METHOD = SSTYPE(3)
/INTERCEPT = EXCLUDE
/PLOT = PROFILE( DEPOTSTATUS )
/EMMEANS = TABLES(DEPOTSTATUS)
/PRINT = DESCRIPTIVE
/CRITERIA = ALPHA(.10)
/DESIGN = DEPOTSTATUS.
|
|---|
| Resources |
Elapsed Time |
0:00:00,31 |
|---|
Between-Subjects Factors
|
|
Value Label |
N |
|---|
| Depotstatus |
2 |
Forurenet |
40 |
|---|
| 3 |
Oprenset |
46 |
|---|
Descriptive Statistics
Dependent Variable: ln (relativ handelspris)
| Depotstatus |
Mean |
Std. Deviation |
N |
|---|
| Forurenet |
,2986 |
,25927 |
40 |
|---|
| Oprenset |
,2276 |
,19051 |
46 |
|---|
| Total |
,2606 |
,22655 |
86 |
|---|
Tests of Between-Subjects Effects
Dependent Variable: ln (relativ handelspris)
| Source |
Type III Sum of Squares |
df |
Mean Square |
F |
Sig. |
|---|
| Model |
5,949(a) |
2 |
2,974 |
58,721 |
,000 |
|---|
| DEPOTSTATUS |
5,949 |
2 |
2,974 |
58,721 |
,000 |
|---|
| Error |
4,255 |
84 |
,051 |
|
|
|---|
| Total |
10,204 |
86 |
|
|
|
|---|
| a R Squared = ,583 (Adjusted R Squared = ,573) |
Estimated Marginal Means
Depotstatus
Dependent Variable: ln (relativ handelspris)
| Depotstatus |
Mean |
Std. Error |
90% Confidence Interval |
|---|
| Lower Bound |
Upper Bound |
|---|
| Forurenet |
,299 |
,036 |
,239 |
,358 |
|---|
| Oprenset |
,228 |
,033 |
,172 |
,283 |
|---|
Profile Plots
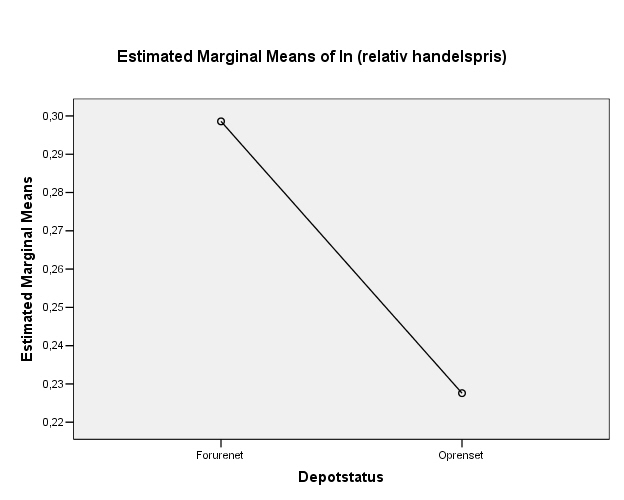
GET
FILE='W:\sag\1243\Data\Databearbejdning\SPSS\Dataset\Hyp5.sav'.
*Define Variable Properties.
*DEPOTSTATUS.
VARIABLE LABELS DEPOTSTATUS 'Depotstatus'.
VALUE LABELS DEPOTSTATUS
1 'Mistanke'
2 'Forurenet'
3 'Oprenset'
4 'Restforurening'
5 'Undersřgt uden fund' .
*lnRH.
VARIABLE LABELS lnRH 'ln (relativ handelspris)'.
*Type.
FORMATS Type (F11.0).
VALUE LABELS Type
12 'Mistanke til forurenet'
13 'Mistanke til oprenset'
15 'Mistanke til undersřgt uden fund'
23 'Forurenet til oprenset'
24 'Forurenet til restforurening'
25 'Forurenet til undersřgt uden fund' .
EXECUTE.
SAVE OUTFILE='W:\sag\1243\Data\Databearbejdning\SPSS\Dataset\hyp5.sav'
/COMPRESSED.
GET
FILE='W:\sag\1243\Data\Databearbejdning\SPSS\Dataset\Hyp5.sav'.
USE ALL.
COMPUTE filter_$=(Type=24).
VARIABLE LABEL filter_$ 'Type=24 (FILTER)'.
VALUE LABELS filter_$ 0 'Not Selected' 1 'Selected'.
FORMAT filter_$ (f1.0).
FILTER BY filter_$.
EXECUTE .
SUMMARIZE
/TABLES=LnRH BY DEPOTSTATUS
/FORMAT=NOLIST TOTAL
/TITLE='Alle observationer'
/MISSING=VARIABLE
/CELLS=COUNT MEAN MEDIAN MIN MAX STDDEV KURT SKEW .
Summarize
Notes
| Output Created |
23-AUG-2005 15:46:44 |
|---|
| Comments |
|
|---|
| Input |
Data |
W:\sag\1243\Data\Databearbejdning\SPSS\Dataset\Hyp5.sav |
|---|
| Filter |
Type=24 (FILTER) |
|---|
| Weight |
<none> |
|---|
| Split File |
<none> |
|---|
| N of Rows in Working Data File |
130 |
|---|
| Missing Value Handling |
Definition of Missing |
For each dependent variable in a table, user-defined missing values for the dependent and all grouping variables are treated as missing. |
|---|
| Cases Used |
Cases used for each table have no missing values in any independent variable, and not all dependent variables have missing values. |
|---|
| Syntax |
SUMMARIZE
/TABLES=LnRH BY DEPOTSTATUS
/FORMAT=NOLIST TOTAL
/TITLE='Alle observationer'
/MISSING=VARIABLE
/CELLS=COUNT MEAN MEDIAN MIN MAX STDDEV KURT SKEW .
|
|---|
| Resources |
Elapsed Time |
0:00:00,01 |
|---|
Case Processing Summary
|
Cases |
|---|
| Included |
Excluded |
Total |
|---|
| N |
Percent |
N |
Percent |
N |
Percent |
|---|
| ln (relativ handelspris) * Depotstatus |
130 |
100,0% |
0 |
,0% |
130 |
100,0% |
|---|
Alle observationer
ln (relativ handelspris)
| Depotstatus |
N |
Mean |
Median |
Minimum |
Maximum |
Std. Deviation |
Kurtosis |
Skewness |
|---|
| Forurenet |
67 |
,2848 |
,2487 |
-,53 |
1,28 |
,32662 |
1,263 |
,620 |
|---|
| Restforurening |
63 |
,1063 |
,1063 |
-,28 |
,41 |
,14443 |
,151 |
-,322 |
|---|
| Total |
130 |
,1983 |
,1558 |
-,53 |
1,28 |
,26948 |
3,074 |
1,122 |
|---|
EXAMINE
  VARIABLES=LnRH BY DEPOTSTATUS
  /PLOT BOXPLOT STEMLEAF
  /COMPARE GROUP
  /PERCENTILES(5,10,25,50,75,90,95) HAVERAGE
  /STATISTICS DESCRIPTIVES
  /CINTERVAL 95
  /MISSING LISTWISE
  /NOTOTAL.
Explore
Notes
| Output Created |
23-AUG-2005 15:46:44 |
|---|
| Comments |
|
|---|
| Input |
Data |
W:\sag\1243\Data\Databearbejdning\SPSS\Dataset\Hyp5.sav |
|---|
| Filter |
Type=24 (FILTER) |
|---|
| Weight |
<none> |
|---|
| Split File |
<none> |
|---|
| N of Rows in Working Data File |
130 |
|---|
| Missing Value Handling |
Definition of Missing |
User-defined missing values for dependent variables are treated as missing. |
|---|
| Cases Used |
Statistics are based on cases with no missing values for any dependent variable or factor used. |
|---|
| Syntax |
EXAMINE
VARIABLES=LnRH BY DEPOTSTATUS
/PLOT BOXPLOT STEMLEAF
/COMPARE GROUP
/PERCENTILES(5,10,25,50,75,90,95) HAVERAGE
/STATISTICS DESCRIPTIVES
/CINTERVAL 95
/MISSING LISTWISE
/NOTOTAL.
|
|---|
| Resources |
Elapsed Time |
0:00:00,30 |
|---|
Depotstatus
Case Processing Summary
|
Depotstatus |
Cases |
|---|
| Valid |
Missing |
Total |
|---|
| N |
Percent |
N |
Percent |
N |
Percent |
|---|
| ln (relativ handelspris) |
Forurenet |
67 |
100,0% |
0 |
,0% |
67 |
100,0% |
|---|
| Restforurening |
63 |
100,0% |
0 |
,0% |
63 |
100,0% |
|---|
Descriptives
|
Depotstatus |
|
|
Statistic |
Std. Error |
|---|
| ln (relativ handelspris) |
Forurenet |
Mean |
,2848 |
,03990 |
|---|
| 95% Confidence Interval for Mean |
Lower Bound |
,2051 |
|
|---|
| Upper Bound |
,3644 |
|
|---|
| 5% Trimmed Mean |
,2727 |
|
|---|
| Median |
,2487 |
|
|---|
| Variance |
,107 |
|
|---|
| Std. Deviation |
,32662 |
|
|---|
| Minimum |
-,53 |
|
|---|
| Maximum |
1,28 |
|
|---|
| Range |
1,81 |
|
|---|
| Interquartile Range |
,38 |
|
|---|
| Skewness |
,620 |
,293 |
|---|
| Kurtosis |
1,263 |
,578 |
|---|
| Restforurening |
Mean |
,1063 |
,01820 |
|---|
| 95% Confidence Interval for Mean |
Lower Bound |
,0700 |
|
|---|
| Upper Bound |
,1427 |
|
|---|
| 5% Trimmed Mean |
,1099 |
|
|---|
| Median |
,1063 |
|
|---|
| Variance |
,021 |
|
|---|
| Std. Deviation |
,14443 |
|
|---|
| Minimum |
-,28 |
|
|---|
| Maximum |
,41 |
|
|---|
| Range |
,69 |
|
|---|
| Interquartile Range |
,21 |
|
|---|
| Skewness |
-,322 |
,302 |
|---|
| Kurtosis |
,151 |
,595 |
|---|
Percentiles
|
|
Depotstatus |
Percentiles |
|---|
| 5 |
10 |
25 |
50 |
75 |
90 |
95 |
|---|
| Weighted Average(Definition 1) |
ln (relativ handelspris) |
Forurenet |
-,2038 |
-,0776 |
,0733 |
,2487 |
,4535 |
,6926 |
1,0040 |
|---|
| Restforurening |
-,1869 |
-,0608 |
,0130 |
,1063 |
,2219 |
,2744 |
,3453 |
|---|
| Tukey's Hinges |
ln (relativ handelspris) |
Forurenet |
|
|
,0751 |
,2487 |
,4461 |
|
|
|---|
| Restforurening |
|
|
,0140 |
,1063 |
,2176 |
|
|
|---|
ln (relativ handelspris)
Stem-and-Leaf Plots
ln (relativ handelspris) Stem-and-Leaf Plot for
DEPOTSTATUS= Forurenet

 Frequency    Stem &  Leaf

     1,00 Extremes    (=<-,5)
     2,00       -0 .  23
     7,00       -0 .  0000011
    16,00        0 .  0000000001111111
    22,00        0 .  2222222222233333333333
     9,00        0 .  444445555
     6,00        0 .  666667
     1,00        0 .  9
     3,00 Extremes    (>=1,0)

 Stem width:      1,00
 Each leaf:       1 case(s)
ln (relativ handelspris) Stem-and-Leaf Plot for
DEPOTSTATUS= Restforurening

 Frequency    Stem &  Leaf

     2,00       -2 .  18
     3,00       -1 .  069
    10,00       -0 .  0112223456
    14,00        0 .  11336666677899
    16,00        1 .  0001122234455799
    13,00        2 .  0122234446677
     4,00        3 .  1447
     1,00        4 .  1

 Stem width:       ,10
 Each leaf:       1 case(s)
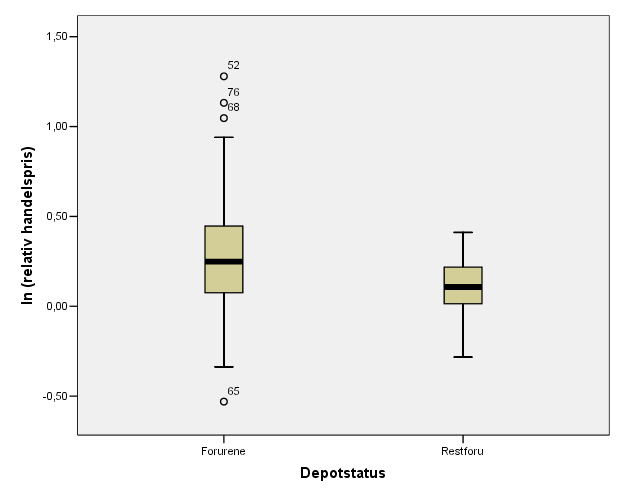
USE ALL.
COMPUTE filter_$=(TYPE=24 and ((LnRH>=-0.5 and LnRH<=1 and DEPOTSTATUS=2) or
(LnRH>=-10 and LnRH<=10 and DEPOTSTATUS=4))).
VARIABLE LABEL filter_$ '(LnRH>=-0.47 and LnRH<=0.74 and DEPOTSTATUS=1) or'+
'(LnRH>=-0.41 and LnRH<=0.75 and DEPOTSTATUS=2) or'+
'(LnRH>=-0.40 and LnRH... (FILTER)'.
VALUE LABELS filter_$ 0 'Not Selected' 1 'Selected'.
FORMAT filter_$ (f1.0).
FILTER BY filter_$.
EXECUTE .
SUMMARIZE
/TABLES=LnRH BY DEPOTSTATUS
/FORMAT=NOLIST TOTAL
/TITLE='Afskĺret med depotstatusvis stem-leaf-plot'
/MISSING=VARIABLE
/CELLS=COUNT MEAN MEDIAN MIN MAX STDDEV KURT SKEW .
Summarize
Notes
| Output Created |
23-AUG-2005 15:46:45 |
|---|
| Comments |
|
|---|
| Input |
Data |
W:\sag\1243\Data\Databearbejdning\SPSS\Dataset\Hyp5.sav |
|---|
| Filter |
(LnRH>=-0.47 and LnRH<=0.74 and DEPOTSTATUS=1) or(LnRH>=-0.41 and LnRH<=0.75 and DEPOTSTATUS=2) or(LnRH>=-0.40 and LnRH... (FILTER) |
|---|
| Weight |
<none> |
|---|
| Split File |
<none> |
|---|
| N of Rows in Working Data File |
126 |
|---|
| Missing Value Handling |
Definition of Missing |
For each dependent variable in a table, user-defined missing values for the dependent and all grouping variables are treated as missing. |
|---|
| Cases Used |
Cases used for each table have no missing values in any independent variable, and not all dependent variables have missing values. |
|---|
| Syntax |
SUMMARIZE
/TABLES=LnRH BY DEPOTSTATUS
/FORMAT=NOLIST TOTAL
/TITLE='Afskĺret med depotstatusvis stem-leaf-plot'
/MISSING=VARIABLE
/CELLS=COUNT MEAN MEDIAN MIN MAX STDDEV KURT SKEW .
|
|---|
| Resources |
Elapsed Time |
0:00:00,02 |
|---|
Case Processing Summary
|
Cases |
|---|
| Included |
Excluded |
Total |
|---|
| N |
Percent |
N |
Percent |
N |
Percent |
|---|
| ln (relativ handelspris) * Depotstatus |
126 |
100,0% |
0 |
,0% |
126 |
100,0% |
|---|
Afskĺret med depotstatusvis stem-leaf-plot
ln (relativ handelspris)
| Depotstatus |
N |
Mean |
Median |
Minimum |
Maximum |
Std. Deviation |
Kurtosis |
Skewness |
|---|
| Forurenet |
63 |
,2564 |
,2330 |
-,34 |
,94 |
,25520 |
,011 |
,236 |
|---|
| Restforurening |
63 |
,1063 |
,1063 |
-,28 |
,41 |
,14443 |
,151 |
-,322 |
|---|
| Total |
126 |
,1814 |
,1513 |
-,34 |
,94 |
,21982 |
,909 |
,609 |
|---|
EXAMINE
  VARIABLES=LnRH BY DEPOTSTATUS
  /PLOT BOXPLOT HISTOGRAM
  /COMPARE GROUP
  /PERCENTILES(5,10,25,50,75,90,95) HAVERAGE
  /STATISTICS DESCRIPTIVES
  /CINTERVAL 95
  /MISSING LISTWISE
  /NOTOTAL.
Explore
Notes
| Output Created |
23-AUG-2005 15:46:45 |
|---|
| Comments |
|
|---|
| Input |
Data |
W:\sag\1243\Data\Databearbejdning\SPSS\Dataset\Hyp5.sav |
|---|
| Filter |
(LnRH>=-0.47 and LnRH<=0.74 and DEPOTSTATUS=1) or(LnRH>=-0.41 and LnRH<=0.75 and DEPOTSTATUS=2) or(LnRH>=-0.40 and LnRH... (FILTER) |
|---|
| Weight |
<none> |
|---|
| Split File |
<none> |
|---|
| N of Rows in Working Data File |
126 |
|---|
| Missing Value Handling |
Definition of Missing |
User-defined missing values for dependent variables are treated as missing. |
|---|
| Cases Used |
Statistics are based on cases with no missing values for any dependent variable or factor used. |
|---|
| Syntax |
EXAMINE
VARIABLES=LnRH BY DEPOTSTATUS
/PLOT BOXPLOT HISTOGRAM
/COMPARE GROUP
/PERCENTILES(5,10,25,50,75,90,95) HAVERAGE
/STATISTICS DESCRIPTIVES
/CINTERVAL 95
/MISSING LISTWISE
/NOTOTAL.
|
|---|
| Resources |
Elapsed Time |
0:00:00,84 |
|---|
Depotstatus
Case Processing Summary
|
Depotstatus |
Cases |
|---|
| Valid |
Missing |
Total |
|---|
| N |
Percent |
N |
Percent |
N |
Percent |
|---|
| ln (relativ handelspris) |
Forurenet |
63 |
100,0% |
0 |
,0% |
63 |
100,0% |
|---|
| Restforurening |
63 |
100,0% |
0 |
,0% |
63 |
100,0% |
|---|
Descriptives
|
Depotstatus |
|
|
Statistic |
Std. Error |
|---|
| ln (relativ handelspris) |
Forurenet |
Mean |
,2564 |
,03215 |
|---|
| 95% Confidence Interval for Mean |
Lower Bound |
,1921 |
|
|---|
| Upper Bound |
,3207 |
|
|---|
| 5% Trimmed Mean |
,2541 |
|
|---|
| Median |
,2330 |
|
|---|
| Variance |
,065 |
|
|---|
| Std. Deviation |
,25520 |
|
|---|
| Minimum |
-,34 |
|
|---|
| Maximum |
,94 |
|
|---|
| Range |
1,28 |
|
|---|
| Interquartile Range |
,33 |
|
|---|
| Skewness |
,236 |
,302 |
|---|
| Kurtosis |
,011 |
,595 |
|---|
| Restforurening |
Mean |
,1063 |
,01820 |
|---|
| 95% Confidence Interval for Mean |
Lower Bound |
,0700 |
|
|---|
| Upper Bound |
,1427 |
|
|---|
| 5% Trimmed Mean |
,1099 |
|
|---|
| Median |
,1063 |
|
|---|
| Variance |
,021 |
|
|---|
| Std. Deviation |
,14443 |
|
|---|
| Minimum |
-,28 |
|
|---|
| Maximum |
,41 |
|
|---|
| Range |
,69 |
|
|---|
| Interquartile Range |
,21 |
|
|---|
| Skewness |
-,322 |
,302 |
|---|
| Kurtosis |
,151 |
,595 |
|---|
Percentiles
|
|
Depotstatus |
Percentiles |
|---|
| 5 |
10 |
25 |
50 |
75 |
90 |
95 |
|---|
| Weighted Average(Definition 1) |
ln (relativ handelspris) |
Forurenet |
-,1596 |
-,0715 |
,0733 |
,2330 |
,4017 |
,6217 |
,6973 |
|---|
| Restforurening |
-,1869 |
-,0608 |
,0130 |
,1063 |
,2219 |
,2744 |
,3453 |
|---|
| Tukey's Hinges |
ln (relativ handelspris) |
Forurenet |
|
|
,0751 |
,2330 |
,3932 |
|
|
|---|
| Restforurening |
|
|
,0140 |
,1063 |
,2176 |
|
|
|---|
ln (relativ handelspris)
Histograms
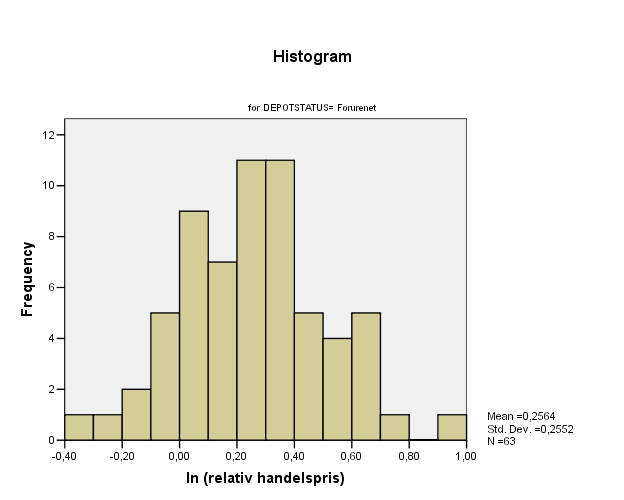
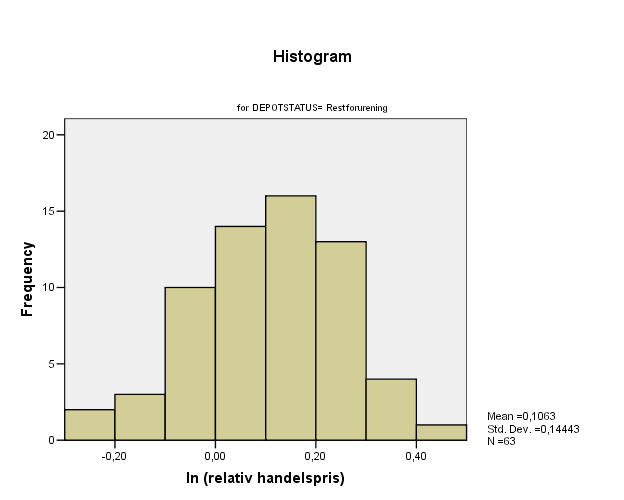
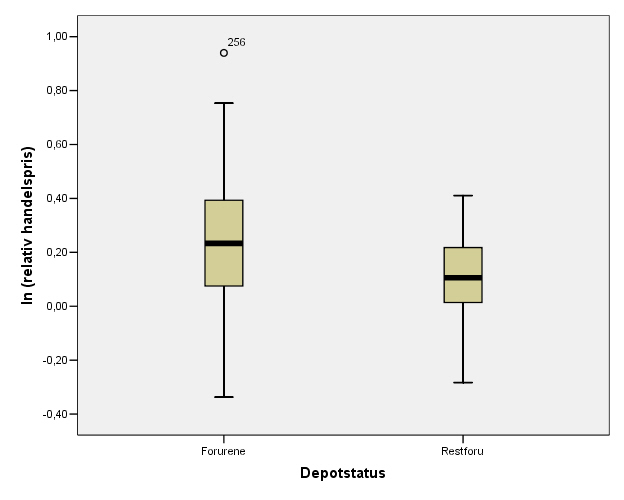
UNIANOVA
  LnRH  BY DEPOTSTATUS
  /METHOD = SSTYPE(3)
  /INTERCEPT = EXCLUDE
  /PLOT = PROFILE( DEPOTSTATUS )
  /EMMEANS = TABLES(DEPOTSTATUS)
  /PRINT = DESCRIPTIVE
  /CRITERIA = ALPHA(.10)
  /DESIGN = DEPOTSTATUS.
Univariate Analysis of Variance
Notes
| Output Created |
23-AUG-2005 15:46:46 |
|---|
| Comments |
|
|---|
| Input |
Data |
W:\sag\1243\Data\Databearbejdning\SPSS\Dataset\Hyp5.sav |
|---|
| Filter |
(LnRH>=-0.47 and LnRH<=0.74 and DEPOTSTATUS=1) or(LnRH>=-0.41 and LnRH<=0.75 and DEPOTSTATUS=2) or(LnRH>=-0.40 and LnRH... (FILTER) |
|---|
| Weight |
<none> |
|---|
| Split File |
<none> |
|---|
| N of Rows in Working Data File |
126 |
|---|
| Missing Value Handling |
Definition of Missing |
User-defined missing values are treated as missing. |
|---|
| Cases Used |
Statistics are based on all cases with valid data for all variables in the model. |
|---|
| Syntax |
UNIANOVA
LnRH BY DEPOTSTATUS
/METHOD = SSTYPE(3)
/INTERCEPT = EXCLUDE
/PLOT = PROFILE( DEPOTSTATUS )
/EMMEANS = TABLES(DEPOTSTATUS)
/PRINT = DESCRIPTIVE
/CRITERIA = ALPHA(.10)
/DESIGN = DEPOTSTATUS.
|
|---|
| Resources |
Elapsed Time |
0:00:00,33 |
|---|
Between-Subjects Factors
|
|
Value Label |
N |
|---|
| Depotstatus |
2 |
Forurenet |
63 |
|---|
| 4 |
Restforurening |
63 |
|---|
Descriptive Statistics
Dependent Variable: ln (relativ handelspris)
| Depotstatus |
Mean |
Std. Deviation |
N |
|---|
| Forurenet |
,2564 |
,25520 |
63 |
|---|
| Restforurening |
,1063 |
,14443 |
63 |
|---|
| Total |
,1814 |
,21982 |
126 |
|---|
Tests of Between-Subjects Effects
Dependent Variable: ln (relativ handelspris)
| Source |
Type III Sum of Squares |
df |
Mean Square |
F |
Sig. |
|---|
| Model |
4,853(a) |
2 |
2,427 |
56,446 |
,000 |
|---|
| DEPOTSTATUS |
4,853 |
2 |
2,427 |
56,446 |
,000 |
|---|
| Error |
5,331 |
124 |
,043 |
|
|
|---|
| Total |
10,184 |
126 |
|
|
|
|---|
| a R Squared = ,477 (Adjusted R Squared = ,468) |
Estimated Marginal Means
Depotstatus
Dependent Variable: ln (relativ handelspris)
| Depotstatus |
Mean |
Std. Error |
90% Confidence Interval |
|---|
| Lower Bound |
Upper Bound |
|---|
| Forurenet |
,256 |
,026 |
,213 |
,300 |
|---|
| Restforurening |
,106 |
,026 |
,063 |
,150 |
|---|
Profile Plots
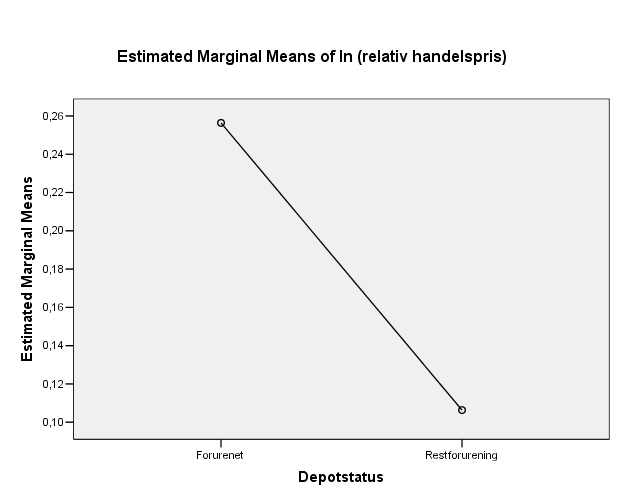
| Forside | | Indhold | | Tilbage | | Udskriftsvejledning |
Version 1.0 November 2005, © Miljøstyrelsen.
|