Afprøvning af immunoassaymetode til bestemmelse afPAH-indhold i jord

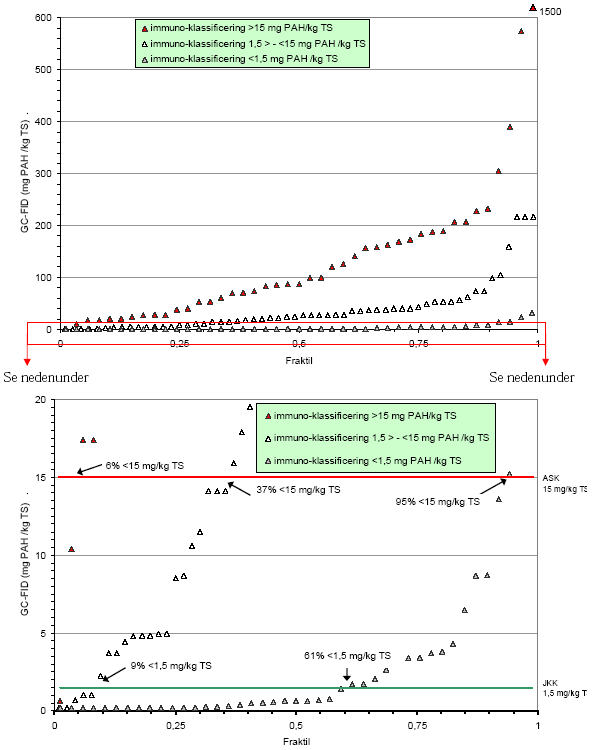
Figur 4.3 Tre fraktilplot af GC-FID data opdelt i henhold til de tre immunoassay klassificering (vist med to forskellig skala)
Three quantile plots of GC-FID data according to the three immunoassay classification groups /shown with to different scales)
Version 1.0 Maj 2007, © Miljøstyrelsen.