|
Report from the Sub-committee on Agriculture
5. Present agricultural production
5.1 Different types of farm
5.2 Crop Yields in present production
5.3 Pests and pesticide consumption of the present cultivation
systems
5.4 Annual variations in pest attack and possibility of
determing the need for control
5.5 Losses as a consequence of pests in the present and
alternative scenarios
5.5.1 Method for calculating losses
5.5.2 Method for estimating total losses
5.6 Variation in yield level in present production
5.7 Pattern of consumption in other countries
5.8 Conclusion concerning present production
5.1 Different types of farm
Description of present structure
In order to evaluate the effects of phasing out pesticides in agriculture, the sub-committee prepared a relatively detailed description of present-day arable farming so as to be able to judge the effects on the different types of farm on clayey and sandy soil (Mikkelsen et al., 1998).
A quantitative combination of the different types of farm was not available at the start of the work but has been established on the basis of operating accounts data from the National Department of Farm Accounting and Management of the Danish Family Farmers’ Association in 1995 and 1996, which cover 13,000 farms. 12 types of farm have been set up (table 5.1). The table gives both the total acreage at the 12 types of farm and the acreage used in crop rotation. The difference between the two figures is due to set-aside acreage, permanent grass and non-food crops. These acreages have not been evaluated because they are estimated to be constant.
Table 5.1 Look
here!
Treatment frequency index (TFI), acreage, livestock units (LU) and relative cereal
yields from the 12 types of farm. The figures have been extracted from farm accounts from
the National Department of Farm Accounting and Management of the Danish Family
Farmers’ Association (crop rotation = acreage used in crop rotation; total = total
acreage in the crop rotation). The treatment frequency index (= TFI) has been fixed on the
basis of average figures from 1994. The TFI figures are exclusive of couch-grass control,
which averages 0.2.
For each of these 12 types of farm a crop rotation has been set up, corresponding to existing practice in agriculture. The operating accounts contain no information on the distribution of the cereal crops at the different types of farm. This breakdown has been carried out to harmonise with the total figures from Danmarks Statistik on sandy and clayey soil. The distribution is based on the following principles: At the individual types of farm, winter wheat is grown after all break crops (rape, peas, oats, potatoes, 75% of the seed-grass acreage, 25% of the sugar-beet acreage and 50% of the rotation-grass acreage. At dairy farms on sandy soil it is assumed that only 25 % of the grass in rotation is used as the crop preceding wheat. An acreage at least corresponding to the acreage with winter rape is sown with winter barley. Beyond this, the species of cereal are distributed over an acreage corresponding to the acreage used in counties with sandy and clayey soil, evaluated on the basis of data from Danmarks Statistik. Winter barley is grown on the remaining acreage.
Table 5.2 below shows the crops included in the 12 crop rotations. For a more detailed description, readers are referred to appendices 1 and 2.
Table 5.2 Look here!
Description of present crop composition in crop rotations on clayey and sandy soil. In
these tables arable farms with and without pigs are combined because they include the same
crops. At the top of the table crops with previous-crop value are shown, followed by other
crops. Miscellaneous covers small acreages with different specialised crops. Appendix 1
contains a more detailed description of the crop rotations, yield level, share of acreage
and treatment frequency index.
Except at the dairy farms, most of the crop rotations are greatly focused on cereal production. All the crops are sold for fodder or quality cereals are produced, such as malt barley, bread-making wheat or seed for drilling. The crop rotation is practised at both pure arable farms and pig farms. The proportion of winter crops is typically around 60% of the total acreage used in the crop rotation. Three typical previous crops for cereals are represented (rape, peas, sugar beet). Three of the types of farm are arable farms with specialised production of sugar beet, seed grass or potatoes. Normal soil preparation and sowing methods are practised in all crop rotations. It is generally assumed that a great deal is done in the way of plant protection and fertilisation to optimise the yield from the crops. As can be seen from table 5.1, the treatment frequency index differs considerably for the different types of farm.
5.2 Crop Yields in present production
Background for chosen yield levels
The yields from the cash crops have been fixed on the basis of Danish statistics for the years 1993-96. In those years there were problems with overwintering of winter rape and weed control in winter rape, and the rape yields were therefore relatively low. The rape yields have therefore been fixed on the basis of the years 1989-96. Yields in the individual counties from the Agricultural Statistics (Danmarks Statistik) (Anon. 1993-96b and Spieger, 1998) have been used to fix the cereal yields on sandy soil (North Jutland, Ringkøbing and Ribe) and clayey soil (Storstrøm, West Zealand, Bornholm, Funen, Århus, Vejle). Viborg, North Zealand, the Metropolitan Region and South Jutland have been omitted because of varying types of soil. Table 5.3 shows yields for the different crops on sandy and clayey soils. Clayey soil comprises farms No. 5, 6 and 7. Sandy soil comprises farms No. 1, 2, 3 and 4.
For the 12 types of farm described, table 5.3 shows the cereal yields adjusted for type of farm by multiplying all cereal yields from table 5.3 by the relative cereal yields shown in table 5.1 from the operating accounts in 1995 and 96. This makes it possible to reflect the effects of a 0-scenario on different yield levels found at the different types of farm.
Table 5.3
Crop yields measured in hkg/ha on sandy and clayey soil 1993-96 (rape 1989-96,
seed 1992-95). Cash crop yields based on county yield figures and coarse fodder yields
calculated on the basis of the farm accounts.
| Crops | Clayey soil | Sandy soil | Danmarks Statistik |
| Hkg/ha | Hkg/ha | Hkg/ha | |
| Winter wheat | 75 | 63 | 70 |
| Rye | 55 | 50 | 48 |
| Winter barley | 59 | 53 | 56 |
| Spring barley, oats, spring wheat | 53 | 44 | 49 |
| Cereals, total | 65 | 52 | 59 |
| Peas | 39 | 37 | 38 |
| Winter rape (89-96) | 29 | 23 | 25 |
| Spring rape (89-96) | 20 | 19 | 18 |
| Seed grass | 9.5 | 8 | 9 |
| Sugar beet | 480 | 440 | 480 |
| Potatoes | 340 | 367 | 360 |
| c.u./ha | c.u./ha | c.u./ha | |
| Grass, wholecrop, maize | 66 | 62 | 65 |
| Mangolds | 120 | 100 | 108 |
| Permanent grass | 20 | 20 | 37 |
Spring cereal, which covers both spring barley, oats and spring wheat, is put at the same yield as winter barley, which is by far the largest crop with respect to acreage. Rye/triticale is included in the 0-pesticide scenarios with a higher percentage of the acreage than in present production. This means that rye would also be grown on "better" types of soil, for which a higher yield is assumed than in present practice, in which rye is often grown on very poor cereal soil. The chosen rye yield has therefore been put 4-5 hkg higher than in table 5.3 according to Danmarks Statistik.
Coarse fodder yield
The coarse fodder yield has been estimated on the basis of the livestock's need for feed units (FU), adjusted in relation to the number, weight and production of livestock (Kristensen, 1998). Bought-in FU has been calculated on the basis of the fodder costs (DKK) in the operating accounts and an adjusted FU price (DKK/FU) (Bisgaard, 1998). The coarse fodder yield has then been calculated as the theoretical need, minus home-grown cereal, minus bought-in fodder. The average coarse fodder yield per ha has then been calculated by dividing the figure arrived at by the total acreage with coarse fodder in the crop rotation. These indirectly calculated coarse fodder yields depend greatly on the price fixed for bought-in fodder. In the calculation of the grass and wholecrop yield, the mangold yield has been fixed at 11,000 FU/ha. On average, the calculated coarse fodder yields lie 15%-units under yields measured on conventionally operated all-year experimental farms in the years 1989-93 (Halberg & Kristensen, 1997). In the scenarios, these have been harmonised to produce the same quantities of coarse fodder per livestock unit.
5.3 Pests and pesticide consumption of the present cultivation systems
In the following a short review is given of present pesticide consumption and the pests that the pesticides are mainly used to control in agriculture.
Present pesticide consumption
The treatment frequency index in 1994 (Danish Environmental Protection Agency Report No. 8/1995) has been chosen in present production. In addition, consumption has been broken down into winter cereal crops and into sandy and clayey soil for winter barley and wheat on the basis of data from AIM-Farmstat.
Table 5.4 Look
here!
Treatment frequency index from 1994 according to the Pesticide Statistics, plus extra
breakdown of winter cereals, spring cereals and sugar beet. The figures do not include the
consumption of seed-dressing products.
The reason for choosing 1994 is that that year best reflects the present consumption (table 5.4). Figures from 1995 and 1996 were affected by big changes in sales due to the introduction of a special tax on pesticides and are therefore not deemed to be representative. The total treatment frequency index for Danish agriculture in 1994 was 2.35, which corresponds to the level in the latest statistics from 1997, which show a treatment frequency index of 2.45.
Pattern of consumption
Herbicides account for around 2/3 of all treatment, insecticides for 10-15%, fungicides for around 20% and growth regulators for 2-5%. The proportion of sprayed acreage at the different farms varies from about 60% at dairy farms and 90% at pig farms (Schou, 1998). The large proportion of non-sprayed acreage at dairy farms is due to a large grass acreage.
Approx. 15% of all spraying is done in the autumn, while more than 65% is done in April, May and June (Schou, 1998). Owing to the large amount of land used for cereals, approx. 65% of all spraying is done in cereal crops, while the intensity is generally greatest in specialised crops. Most spraying is done on clayey soil, where there is the greatest specialisation in arable farming. An average treatment frequency index of 3.3 has for example been found in Storstrøm County, which has a large proportion of sugar beet, compared with 1.9 in Ringkøbing County, which has a large proportion of dairy farms (Schou, 1998). There is bigger consumption of pesticides at the largest farms, due in part to their use of land (Schou, 1998).
Phytotoxicity in connection with spraying
Some pesticides can cause damage to crops and thus reduce their yields. This applies mainly to herbicides. The magnitude and importance of this damage have been investigated in trials and are evaluated in connection with the approval process. The damage is generally estimated to be limited. Whether damage occurs or not depends greatly on the time of spraying. In the large crops, the risk of herbicide damage is greatest in beet. In some small crops the risk of damage is greater because of the low selectivity of herbicides. The risk of damage is generally greatest when the spraying is done in hot weather and bright sunshine.
Weed control
In almost all crops, weeds are controlled with herbicides. In cereal production at pig farms and arable farms, where the proportion of winter cereal is high compared with spring cereal, extensive use is made of agents against monocotyledonous weeds. This applies both in winter wheat and in break crops such as rape and peas. Dicotyledonous weeds are controlled in all crops. Most is done in sugar beet and mangolds, which are sprayed with herbicides 2-3 times. 1-2 crops are treated each year for couch grass in the crop rotation, which means that couch grass is typically controlled every four years on the same acreage. In cereal production that is dominated by spring cereal, herbicides are used against dicotyledonous weeds every year and against couch grass every four years. Soil preparation (mechanical treatment) is rarely if ever used to control weeds in cereals, while, in winter rape, we are seeing the start of a trend towards sowing the crop in widely spaced rows and hoeing to remove weeds.
At dairy farms with a large production of coarse fodder, less use is generally made of herbicides. Mangolds are sprayed 2-3 times. In cereals, it is almost only dicotyledonous weeds that are treated, and couch grass is treated once in a crop rotation, which typically means every four to six years.
Prevention and control of diseases
At least 85% of the seed used for cereals is treated with a fungicide to prevent seed-borne diseases. Cereal crops are treated frequently against leaf diseases. Wheat is treated about twice and winter barley less than once, depending on the pressure of disease and the resistance of the varieties grown. In the case of fungal attack, beet, peas and rape only need treating about every 10 years. Severe attacks of eyespot can develop in some fields, resulting in losses. Generally, only about 5% of the winter cereal acreage is sprayed against eyespot.
In spring barley, treatment on sandy soil differs from that on clayey soil. Figures from AIM show that much less spraying is done on sandy soil (40% of the acreage) than on clayey soil (60% of the acreage). Particularly at farms with a big production of malt barley, where a large grain size is required (good sorting), fungicides are used against leaf diseases.
In specialised productions, such as potatoes, intensive treatment is given against potato blight, although there is some variation, depending on the variety, and a large annual variation. An early attack of blight can mean that the crop is treated 7 to 8 times in a growing season. On average, treatment is given 5-6 times. The main reason for the frequent treatment is that the agents used do not have a good long-term effect. Almost all seed potatoes are dressed to avoid attack by black scurf.
Pest control
In rape, pests are controlled by spraying once or twice each year. In wheat and spring barley, about half the acreage, on average, is sprayed against aphids. There has been a considerable reduction in consumption compared with the figures in 1994. Thus, on average, only one quarter of the acreage with cereals was treated in 1997 (Danish Environmental Protection Agency, Pesticide Statistics 1997). Insecticides are not used in winter barley. Peas are treated against pests every other year, on average. Beet is treated against aphids and other pests every year with an average of two applications or seed-dressing combined with one application. Starch potatoes are treated against bugs and cicada.
Growth regulation
Growth regulators are used on between 10 and 40% of the acreage with winter cereals. The latest figures from 1997 show a treatment frequency index of 0.1 in winter cereal, corresponding to 10% of the acreage. It is believed that growth regulation in conventional cultivation of winter wheat is on the way out because varieties with good stem strength are grown and less nitrogen is used. However, we believe that there is still a need for growth regulation in some varieties of rye, just as some use is made of growth regulators in certain species of seed grass.
5.4 Annual variations in pest attack and possibility of determing the need for control
There is a very considerable variation in the need for prevention and control of both diseases and pests and in the percentage losses from year to year. The variation in the degrees of attack has traditionally been gathered via monthly surveys from the Research Centre for Plant Pathology, which monitors the strength of pest attacks in each year (Stapel, 1983). Its records go back more than 100 years. The system used has recently been replaced by the Danish Agricultural Advisory Centre’s registration system. Figure 5.1 shows the variation in the development of disease for a single fungus in wheat in different years. With a monitoring system for diseases it is possible to follow the development from week to week, both locally and nationally.
Variation in yield loss in cereals
To illustrate the big annual variation, table 5.5 shows the average annual additional yields from treatment with fungicides in a very large number of trials extracted from the Danish Agricultural Advisory Centre's field trial database (Kjær, 1998). The variation in the additional yields is due to a combination of differences in the diseases that dominate in the individual years, variations in the degree of attack and how early the attacks occur. The results can be used as an indicator of the potential additional yield/yield loss in cereals from spraying or not spraying. The latest fungicides (strobilurines), which were approved in 1998, have lifted this yield potential in wheat, for example, by 4-6 hkg/ha.
The weed population in one and same locality varies to a limited extent from year to year. It is difficult to set an actual damage threshold for control measures since a low level of dicotyledonous weed is generally desired in the crops for long-term crop rotation reasons. For monocotyledonous weeds, which have increasingly spread in recent years as a consequence of increased acreages with winter cereals, considerable average additional yields have been measured – 15-20% - with control measures against loose silky-bent and blackgrass (Annual Report of Field Trials, 1997). In some trials with very large stands of loose silky-bent, the yield can be halved. Serious proliferation of monocotyledonous weeds is thus a negative consequence of the big change from spring to winter cereals.
Table 5.5
Average additional yields in cereals (hkg/ha) after treatment with fungicides. The
treatments are typical standard treatments from research programmes and can be used as
indicator of the potential additional yield after spraying 2-3 times in wheat, 1-2 times
in spring barley and twice in winter barley, typically with reduced dosages (source:
Danish Agricultural Advisory Centre's field trial database, 92-98). The fluctuations in
individual trials can be considerably larger than the annual variation.
| Year | Winter cereals hkg/ha |
Spring barley Hkg/ha |
Winter barley hkg/ha |
| 1990 | 27.1 | 7.3 | 10.8 |
| 1991 | 11.4 | 5.9 | 7.1 |
| 1992 | 3.5 | 0.8 | 2.2 |
| 1993 | 4.3 | 5.7 | 5.4 |
| 1994 | 4.0 | 2.3 | 2.3 |
| 1995 | 4.7 | 2.3 | 4.0 |
| 1996 | 5.9 | 1.5 | 3.1 |
| 1997 | 7.6 | 2.7 | 3.8 |
| 1998 | 13.4 | 5.9 | 6.2 |
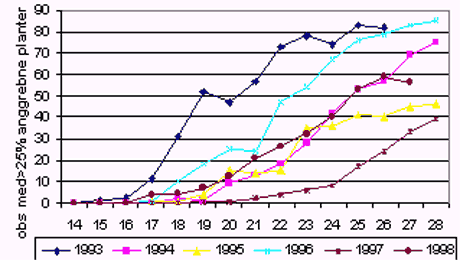
(obs med >25% angrebne planter = observations with >25% plants attacked)
Figure 5.1
Development of mildew attack in wheat determined in the Danish Agricultural Advisory
Centre's registration system. With weekly reporting, the current development of the
individual diseases can be monitored nationally and regionally. The information is used in
connection with advice on the need for control measures.
While dicotyledonous weeds are treated every year over almost the entire acreage, monocotyledonous weeds are generally only treated in the areas in which they occur.
Evaluation of the need for prevention and control measures
In connection with the first pesticide action plan, many activities have been initiated to get the need for prevention and control measures adjusted in relation to the degrees of attack in the individual field and the individual year with a view to avoiding unnecessary spraying. These activities have included the development of damage threshold models for diseases and pests, as for example in PC-Plant Protection. PC-Plant Protection enables farmers to carry out a real evaluation of need in respect of a number of pests. In the case of weed control, use has not generally be made of real damage thresholds. Instead, the dosage and agent have been adjusted to a given weed flora in the field.
PC-Plant Protection
The PC-based guideline programs are used by just under 2,000 subscribers. Besides this direct use of the models, the principles of damage thresholds are disseminated via newsletters from agricultural advisers, the Internet, etc. In an interview-based survey among farmers, 15% stated that they regularly used the damage thresholds from PC-Plant Protection (University of South Jutland, 1998), while another survey in 1994 showed that farmers were generally better at evaluating need today and that they were increasingly using reduced dosages of pesticides (Bager & Søgård, 1994). It has thus been found that consumption has been reduced, especially in the case of fungicides in cereals, although there has been only a limited reduction in total treatment frequency index. The latter is due partly to the fact that more winter cereals are grown now than earlier and that winter cereals generally have a greater need for control measures than spring crops. The reduction in consumption has been limited in the case of herbicides and pesticides, but considerable in the case of fungicides in all cereal crops, where the reduction target of 50% in the pesticide action plan has been achieved. Adjusted for changes in crop composition, the treatment frequency index in 1997 was down by 25% in relation to the action plan target.
5.5 Losses as a consequence of pests in the present and alternative scenarios
Farmers use pesticides to minimise or eliminate major financial losses caused by pests. In several earlier reports, an attempt was made to estimate the economic benefit of spraying in agriculture (Jørgensen et al., 1997, Thonke et al., 1989).
In connection with this report a new evaluation has been carried out of the total crop loss, broken down into individual crops and including alternative methods where practicable (table 5.8). The economic consequences of these losses have been calculated by the Sub-committee on Production, Economics and Employment. The losses have been calculated on the basis of the technology that is available today.
5.5.1 Method for calculating losses
Losses caused by diseases and pests
Losses from diseases and pests have been estimated mainly on the basis of data from trials carried out with pesticides by The Danish Agricultural Advisory Centre and DIAS. The size of the losses in trials cannot generally be said to be representative of the losses that can occur at different types of farm, but there are no other or better sources to use for estimating losses caused by pests. For some of the main pests, e.g. aphids in cereals, we have been able to use trial data to get a breakdown into percentage losses on sandy and clayey soil, while for others we have had to use a national average. For the individual crops we have tried to allow for what can be said to be the most realistic percentage losses on the basis of the available information. For a more detailed review of the data on which the percentage losses in the individual crops are based, see Mikkelsen et al., (1998). In the following we list some factors that influence the magnitude of percentage losses from pests and the uncertainty attaching to them:
| Some types of trial result in overestimation because they are sited with the expectation of an attack. However, in some cases the attack does not materialise because the trial sites, too, are subject to local and annual variations. | |
| For other pests (e.g. diseases in cereals), so many trials are carried out each year that the results can be regarded as reasonably representative of the country as a whole. | |
| For some airborne diseases, plot trials are deemed to result in underestimation of percentage losses because the trials are often sited in fields that have been treated. | |
| The trials do not allow for the fact that the background infection can increase if control measures are omitted altogether. | |
| In the case of big attacks, the trials are often discarded because of too great a statistical uncertainty in the result, which means that the trial results will underestimate the percentage losses. |
Losses as a consequence of impaired quality
Certain losses can only be calculated with difficulty, including effects on quality parameters. Especially in the case of potatoes, it is difficult to calculate losses resulting from poor storage. Consignments of potatoes with blighted tubers are particularly difficult to store in clamps and loosely layered in boxes. Infected tubers have greater respiration and give off moisture to the surroundings, thereby increasing tuber rotting. Consignments of potatoes with more than 2% infected tubers are considered high-risk consignments from a storage point of view. The calculated losses in the three types of potato production are composed as shown in table 5.6.
The losses in potatoes describe very well the differences in the level of yield between organic ware potatoes (approx. 233 hkg/ha) and conventional potatoes (approx. 400 hkg/ha) (Holm et al., 1998 & 1999), which give a reduction in yield of 42%. In figures for organic farms at Foulum in 1996-98, the saleable yields vary between 74 and 370 hkg/ha (Pers. com. Jens Peter Mølgaard). Supply security is therefore a very big problem for industrialised production, for example.
Table 5.6
Percentage losses in 3 different types of potato production, breakdown into damage
caused by disease and damage caused by pests (Based on Holm et al., 1999).
% loss from the following pests |
||||
| Mould attack incl. damage to tubers |
Black scurf | Bugs, cicadas | Total | |
| Seed potatoes | 37* | 6 | 3 | 43 |
| Ware potatoes | 35* | 7 | 6 | 43 |
| Starch potatoes | 35** | 3 | 8 | 42 |
*Direct loss due to leaf diseases plus rejection of 20 hkg/ha with tuber mould
**Direct loss due to leaf diseases plus 5% loss in starch
The production of malting barley is another area where crop quality depends on whether or not pesticides are used. In some years, sorting (pricing is affected by the grain size) can be adversely affected by fungus or aphid attacks, which can make it impossible to sell the cereal as malting barley.
Losses as a consequence of harvesting problems and drying costs, which can occur, especially when there are large populations of weeds, are also difficult to quantify. It is similarly difficult to predict what areas of land would have to be restructured if they became overgrown with weeds.
Losses due to weeds
The size of losses that would result from a switch to mechanical weed control is encumbered with great uncertainty. Trials in which the weed effect and yield with mechanical weed control are compared with those resulting from standard herbicide treatment are few and far between, and in many cases it is not possible to distinguish between the effect of residual weeds on the yield and the effect (crop damage) of mechanical weed control. At the same time, the trials in question were carried out at conventional farms, which means that the weed population was smaller and the composition presumably different than can be expected in a herbicide-free crop rotation.
The types of weeds that are a problem in the present crop rotations are a consequence of the fact that the types are well adapted to the crops in question and to the fact that the available herbicides are not very effective against them. Examples are grass weed in crop rotations with a lot of winter cereal, shepherd’s purse in rotations with winter rape and fool’s parsley in rotations with a lot of beet. In the same way, a crop rotation in which weed control is based only on mechanical control measures must be expected to be dominated by weeds that are favoured in the crops in question and that would be difficult to control mechanically – e.g. camomile and charlock, both of which are very competitive types of weed.
Experience from organic farming
The sizes of the losses in cereals have been estimated on the basis of figures from organic all-year experimental farms, where weeds have been registered after mechanical weed control (Rasmussen et al., 1998). On the basis of 5,173 evaluations of organic cereal fields from 1989-97 at just over 30 farms (dairy farms, egg production units and pure arable farms), an analysis has been carried out of the average incidence and composition of weeds (Kristensen, 1998). Mechanical weed control is much less intensive at the organic farms than is generally recommended for cereals (Rasmussen et al., 1998). It has therefore been suggested that the estimated loss in yield from the direct effect of weeds at the organic all-year farms be halved for use in calculating consequences (Mikkelsen et al., 1998), since it is assumed that increased mechanical weed control could reduce the losses from the present level. This reduction would, however, be cancelled out by the considerable losses resulting from the significant crop damage associated with mechanical weed control. Mechanical crop damage has thus been estimated on the basis of the comparative studies of herbicide treatment. For the other crops, which are not grown at the organic all-year farms, the losses are based on the few trials carried out and on estimates. A more detailed description of the background for the estimated losses from weeds is given in Mikkelsen et al., (1998). The estimated losses as a consequence of crop damage from mechanical weed control and increased residual weed are shown in table 5.7.
On land where there are serious problems with grass weed, the yield losses when wheat is grown without herbicide treatment would exceed the values given in the table in the first few years because some years would pass before the changed crop rotation reduced the weed-grass problem. On the other hand, the yield losses due to dicotylodenous weeds would be smaller than assumed in the table for a short transitional period because some years would pass before the level of weeds rose from the present level up to the level at organic farms, on which the loss calculations in the table are based.
Table 5.7
Estimated losses in per cent due to mechanical weed control measures in agricultural
crops. The losses are included in the total loss function (Mikkelsen et al., 1998).
| Crop | Loss due to crop damage from mechanical weed control | Loss due to residual weed | Total loss during transition to mechanical weed control |
| Winter cereals | 5-10% |
6% |
11-16% |
| Winter barley | 2-5% |
3% |
5-8% |
| Winter rye | 1-3% |
2% |
3-5% |
| Spring barley | 0-3% |
6-12% |
6-15% |
| Peas | 3-7% |
5-10% |
8-17% |
| Winter rape | 0% |
0% |
0% |
| Beet | 0% |
0% |
0% |
| Seed grass | ? |
? |
? |
Losses due to adjustment of cultural practices
Chapter 8 contains a description of alternative methods of preventing and minimising pest problems. However, use of these alternative methods would have disadvantages with respect to yield, which are also listed in table 5.8. To minimise weed problems it is recommended that sowing of wheat, winter barley and rye be postponed. However, sowing in the second half of September is normally recommended to ensure a good and competitive crop. Sowing later than that would for many years reduce the chance of getting winter cereals established and is therefore not recommended. The proposed postponement could be expected to result in a small loss in yield (Kjærsgård, 1996 and Pedersen et al., 1997). The reduction in yield from postponing sowing from 20 September to 10 October has averaged about 7 hkg/ha. It is estimated that less than half of the fields would be sown so late that it would affect the yield. For this reason, the loss in wheat as a consequence of late sowing has been reduced to 3 hkg/ha (corresponding to 4%). In winter barley, the loss as a consequence of postponed sowing has been put at 7% (Pedersen et al., Pers com.).
Another parameter that can reduce yield is use of the most resistant wheat varieties. The most resistant varieties have a lower yield potential than the highest yielding varieties, and on the basis of the trials carried out in 1995-97, it would have cost 4-5 hkg/ha to prioritise resistance over yield (Hovmøller et al., 1998). Since an average of all varieties in the period 1992-97 has been used in the case of losses from diseases, which means that no special allowance has been made for the losses in resistant varieties, we have chosen to halve the loss of 4-5 hkg/ha as a result of choosing resistant varieties because the additional yields in the more resistant varieties are realistically estimated to be 2 hkg/ha less than if the more sensitive varieties were used (cf. table 8.4). A loss of 3% has been added to the loss due to the use of resistant varieties of wheat, whereas there is nothing to indicate such a loss in the other varieties of cereal.
5.5.2 Method for estimating total losses
Composition of yield loss
The total loss is composed of 5 different loss sizes that are estimated to apply in the different crops (see table 5.8).
Table 5.8 Look
here!
Estimated percentage losses resulting from pests, etc., in different crops in the
0-scenario. Only direct yield losses are included. Losses due to the increased cost of
weed control are not included in this table.
Here, Loss 1 covers losses after changed cultural practices to minimise the risk of pests, including postponed sowing time and choice of resistant varieties. Loss 2 covers losses from diseases. Loss 3 covers losses due to pests. Loss 4 covers losses from damage to the crop in connection with mechanical weed control. Loss 5 covers losses due to more weed remaining after mechanical weed control than after treatment with herbicides.
The various loss sizes can be either added or multiplied. Here, the multiplication method has been chosen. The method ensures that in extreme situations one does not risk getting negative yields. The formula for calculating the total loss is as follows:
| Total loss = | (1- | (100-loss1) x | (100-loss2) x | (100-loss3) x | (100-loss4) x | (100-loss5)) | x 100 |
100 |
100 |
100 |
100 |
100 |
In the trials, the losses were mainly expressed in hkg/ha. They have since been converted into percentage losses. Except in the case of diseases in wheat, it has not been possible to differentiate loss sizes in relation to crop yields.
Evaluation of maximum loss in yield
Table 5.8 also shows a maximum loss. This covers the situation in which one of the five loss functions gives maximum loss and will thus establish a basis for the worst possible loss in the crop in question. As will be seen, many of the maximum losses are about twice as large as the average losses. They can occur, for example, if a potato blight attack develops very early in the growing season or if wheat suffers a severe attack of stripe rust or Septoria. It is difficult to estimate the frequency at which such maximum losses will occur as they usually depend very much on the weather.
5.6 Variation in yield level in present production
In conventional cultivation the yield level generally exhibits very high scatter because of local cultivation conditions, climatic factors in the individual years and variations in pest levels. On the face of it, greater variation must be expected if pesticides are not available because pests would have greater "freedom" to cause yield losses. This is reflected, for example, in the many trials in which increased yields were harvested after spraying.
The yield level varies from year to year
Figures from the Danish Agricultural Advisory Centre’s field trial database, which has collected data for the period 1992-1998, show very large annual yield variations for the trials in which pesticide treatment was generally carried out (see figure 5.2).
No data showing cultivation security in 0-scenario
There is no data to document the variations in yield level in areas that have not been treated with pesticides at all. Data are only available for individual factors (disease or pests or weeds). A look at the variations in the trials without fungicide treatment and how they change over the years shows that the average difference between the treated and untreated areas is in most years is simply a parallel shift in the level. In years with severe disease attack, such as 1998, there is a clear tendency for the curves to drop, which indicates reduced cultivation security (figure 5.3). Cultivation security would be impaired most in crops with the largest pesticide consumption, e.g. potatoes, vegetables and fruit and berries.
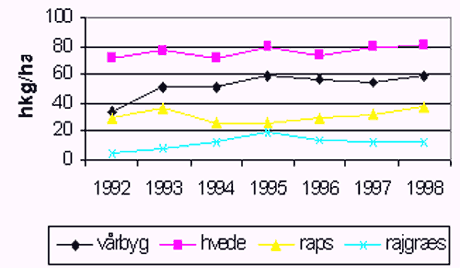
(Vårbyg = Spring barley, hvede = wheat, raps = rape, rajgræs = rye grass)
Figure 5.2
Annual variation in the average yields of four crops cultivated conventionally. In a
given locality the variation can be considerably greater. Source: Danish Agricultural
Advisory Centre’s field trial database.
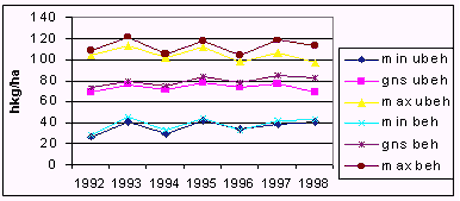
(min ubeh = min. untreated
gns ubeh = average untreated
max ubeh = max. untreated
min beh = min. treated
gns beh = average treated
max beh = max. treated)
Figure 5.3
Annual variation in the average yield level in winter wheat in untreated areas,
together with indication of minimum and maximum values. Source: Danish Agricultural
Advisory Centre’s field trial database.
5.7 Pattern of consumption in other countries
Big differences in pesticide consumption in the EU
The need to use pesticides varies considerably from country to country, depending, for example, on the crops grown, climatic conditions and considerable differences in the pressure of disease and pests. Generally speaking, the further north one goes, the lower the pressure of damage from diseases and pests. The relatively low consumption in the other Nordic countries is due to the fact that more extensive production than in Denmark is practised in large parts of the cultivated acreage. In several of the other EU countries, including the Netherlands and Belgium, production is more intensive.
Only Denmark has figures for treatment frequency index
Figure 5.4 shows the consumption of active ingredients in different countries. As will be seen, Denmark has the third lowest level. Unfortunately, there are no figures that allow a comparison of the consumption on the basis of treatment frequency indices because Denmark is the only country that calculates consumption in this way.
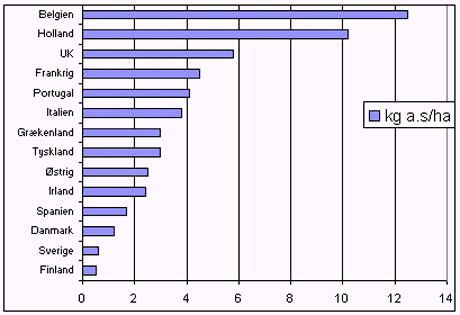
| (Belgien = Belgium | |
| Holland = Netherlands | |
| UK = UK | |
| Frankrig = France | |
| Portugal = Portugal | |
| Italien = Italy | kg a.s/ha = |
| Grækenland = Greece | |
| Tyskland = Germany | |
| Østrig = Austria | |
| Irland = Ireland | |
| Spanien = Spain | |
| Danmark = Denmark | |
| Sverige = Sweden | |
| Finland = Finland) |
Figure 5.4
Pesticide consumption in the EU countries in 1996, calculated as kg active ingredient
(a.i.) per ha agricultural land (acreage in rotation + permanent grass + perennial crops)
Source: Eurostat.
Limited information on pattern of consumption in the EU
Only limited information is available on the pattern of pesticide consumption in different crops, which is needed for determining whether Danish fruit and vegetables, for example, are sprayed more than foreign products. A study from 1996 (Landell Mills) described the consumption in kg active ingredient in four countries. It has been possible to add figures for average consumption in Denmark on the basis of the Pesticides Statistics (table 5.9). In the comments from the Landell Mills study, which was carried out in 1994 at 850 farms in 13 regions in the EU, it is noteworthy that the quantities used within the individual regions vary as much as they do. This indicates that even though there are differences between regions, they are considerably smaller than between farms in the same region. The big differences are due to differences in the cultivation system, the varieties grown and the crop rotation used, variations in diseases and the pressure of pests, and the choice of agent and dosage. As will be seen, with our present body of knowledge, it is difficult to generalise about the use of pesticides in crops cultivated in different regions. Measured in kg active ingredient in the individual crops, Denmark’s consumption generally lies at the lower end of the scale. An example of an area in which there is a significant difference between consumption in Denmark and consumption in neighbouring countries is the consumption of fungicides in cereals (table 5.10). The reduction that has taken place in Denmark has not happened to the same extent in the other countries (Secher & Jørgensen, 1995).
Table 5.9
Quantity of pesticide (kg active ingredient/ha) used in different crops
| Crop | Region | Quantity kg a.i/ha |
Variation between farms kg a.i./ha |
| Wheat | Germany (Hannover) | 4.5 | 0.08-8.5 |
| UK (East Anglia) | 4.6 | 0-10.1 | |
| France (N. Central) | 3.8 | 0.7-13.7 | |
| Italy (Piemonte) | 2.1 | 0.02-7.2 | |
| Denmark | 2.3 | ? | |
| Potatoes | Germany (L�neburg) | 9.8 | 2.7-22.3 |
| Netherlands (Flevoland) | 12.6 | 1.6-34.6 | |
| UK (East Anglia) | 13.1 | 2.0-26.7 | |
| France (North East) | 32.0 | 9.0-73.7 | |
| Denmark | 9.0 | ? | |
| Apples | France (South East) | 41.4 | 1.7-146.7 |
| Italy (Trentio) | 33.7 | 0.6-83.4 | |
| Spain (Lerida) | 27.4 | 1.4-109.6 | |
| Denmark | 28.0 | ? |
Source: Landell Mills (1996). The Danish figures have been converted on the basis of the Chemical Statistics’ treatment frequency index in 1994. The figure for apples has been provided by the Association of Danish Fruit Growers.
Table 5.10
Treatment frequency index for fungicides in winter wheat in four European countries. The
figures are based on consumer surveys carried out by market research companies (modified
on the basis of Secher & Jørgensen 1995).
| Country | 1990 | 1992 | 1994 | 1997 |
| UK | 1.70 | 1.73 | 1.40 | 2.2 |
| Germany | 1.92 | 1.76 | 1.80 | 1.34 |
| France | - | 1.43 | 1.61 | 2.5 |
| Denmark | 1.19 | 0.83 | 0.75 | 0.61 |
5.8 Conclusion concerning present production
The production and crop rotations practised at conventional farms today are a result of the fact that pesticides are available.
As our basis for evaluating present production we have used yields from 1993-96 and treatment frequency indices from 1994. As the basis for the agricultural scenarios we have broken Danish farms down into 12 types of farm on the basis of 13,000 operating accounts from 1995-96. These 12 types of farm can be summed by scaling them so that the total figures are in accordance with figures from Danmarks Statistik. The 12 types of farm represent the main types of crop rotation on sandy and clayey soil. Unfortunately, they do not reflect all present situations, but greater differentiation was not feasible.
Scope of present prevention and control
In conventional forms of production, dicotylodenous weeds in all crops are controlled with herbicides. In some parts of the country, especially those where winter cereal is grown, both monocotyledonous and dicotyledonous weeds are controlled. The biggest use of herbicides is in sugar beet, which is sprayed 2-3 times. In 1-2 crops couch grass is controlled every year in the crop rotation, which means that it is typically controlled every four years on the same land. Soil preparation (mechanical weed control) is rarely if ever used to control weeds in cereals. In winter rape, farmers have started sowing the crop in widely spaced rows (5% of the acreage in 1998/99) and using hoeing to remove weeds.
At least 85% of seed for drilling is dressed with fungicide to prevent seed-borne diseases. Cereal crops are treated frequently against leaf diseases. Wheat fields are treated twice a year and spring barley less than once, depending on the pressure of disease across the productions. Peas and rape are treated with fungicide only about every tenth year. Potatoes are treated intensively – about 5 or 6 times - against blight. Potatoes are dressed against black scurf to ensure good establishment and avoid losses of about 3%.
Pesticides are used in a wide range of agricultural crops. Rape is sprayed once or twice each year. About one quarter to one half of the acreage with wheat and spring barley is treated against aphids. In peas, pests are controlled every other year on average, and in beet, aphids and other pests are controlled every year, either by spraying approximately twice or through a combination of seed-dressing and one spraying.
In general, only limited quantities of growth regulators are used. Growth regulation in conventional cultivation of winter wheat is thought to be on the way out because strong-stemmed varieties are now being grown and less nitrogen is being used. Growth regulation is still deemed necessary in some varieties of rye and species of grass seed.
Variation in need for prevention and control
There is a very large variation in the need for prevention and control of diseases and pests and in the percentage losses from year to year, while in the case of weeds, there is a more uniform need for control measures to keep the general pressure of weeds down.
Pesticide consumption is low in Denmark compared with many of our southern and western neighbours, while consumption in Sweden and Finland is lower than in Denmark because of a lower pressure of infection and more extensive cultivation. The need for pesticides varies considerably from country to country. The variation is due to differences in the crops grown, climatic conditions and a big variation in the pressure of disease and pests.
The consumption of active ingredients in different countries can be used as an indirect measure of the burden on the environment in the individual countries. Only limited information is available about the exact pattern of use of pesticides in different crops, which makes it difficult to compare the pattern of spraying in different countries.
References
Anon. (1995): Pesticide Statistics, 1994. Report No. 8 from the Danish Environmental Protection Agency.
Anon. (1988-96a): Accounting Statistics. Agriculture. 1988-96. Danish National Department of Farm Accounting and Management of the Danish Family Farmers’ Association.
Anon. (1993-96b): Agricultural Statistics 1993-96. Danmark Statistik.
Bager, T., Søgaard, V. (1994): The Farmer and the Environment. Sydjydsk Universitetsforlag. Esbjerg.
Bisgaard, Chr. (1998): Personal communication. Danish Family Farmers’ Association.
Eurostat (1999): Pesticide consumption in EU.
Halberg, N. & Kristensen, Ib Sillebak (1997): Expected crop yield loss when converting to organic dairy farming in Denmark. BIo., Hort. and Agric. Sci.14:25-41.
Hovmøller, M.S., Eriksen, B., Østergård, H., Munk, L., Birger Pedersen, J. (1998): Compilation of existing knowledge concerning possibilities of preventing attacks by diseases in agricultural crops through the use of resistant plants. Report prepared for the Pesticide Committee.
Jørgensen, L.N., Hansen, L.M. & Kudsk, P. (1997): Pesticide Consumption in Danish Agriculture 1987-1996. SP Report No. 11, 93-99.
Kjær, L. (1998): Report on yield data extracted from the Danish Agricultural Advisory Centre’s field trial database. Report prepared for the Pesticide Committee.
Kjærsgaard, J. (1996): Sowing-time trials. Arable farming report. Køge-Ringsted Farmers’ Association. 157-184.
Kristensen, Ib Sillebak (1998): Personal communication. DIAS., Dept. for Agricultural Systems. Foulum.
Landell Mills (1996): Regional analysis of use patterns of ppps in 6 EU countries. Executive summary and cross regional reviews: wheat, potatoes, apples, vines. Landell Mills Market Research lmt, Bath. UK.
Mikkelsen, G., Sillebak-Kristensen, I., Holm, S., Jensen, P.K., Jørgensen, L.N. (1998): Crop rotation models that are to form the basis for evaluation production and economy with present and no use of pesticides. Report prepared for the Pesticide Committee.
Pedersen J.B., Kristensen, H., Nielsen, G.C., Petersen, P.H. (1998): Section on winter cereal. Annual Report of Field Trials, p. 84.
Rasmussen, K., Holst, N., Kristensen, I.S. (1998): Weeds at eight organic dairy farms – major factors for the development of weeds. 1989-1996 15th Danish Plant Protection Conference – Weeds, DIAS Report No. 2 203-217.
Schou, J.S. (1998): Studies of pesticide consumption in agriculture, Danish Institute of Agriculture and Fisheries Economics (DIAFE) Working Paper, No. 13.
Secher, B.J.M. & Jørgensen, L.N. (1995): Current development in fungicide use - Success or failures SCI conference: A vital role of fungicides in cereal production, 241-250.
Stapel, C. (1983): Plant diseases in Denmark through 100 years 1884-1883. National Research Centre for Arable farming. Danish Institute for Plant and Soil Science, 1984.
[Front page] [Contents] [Previous] [Next] [Top] |