[Front page] [Contents] [Previous] [Next] |
Management of Contaminated Sites and Land in Central and Eastern Europe
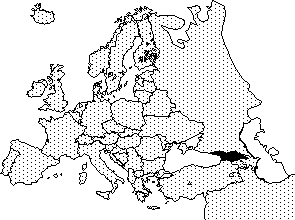
Georgia
Country Characterisation
Background
The existing information on managing of contaminated sites and land in Georgia is limited. However, it is estimated that more than 27 ha territory of Georgia is contaminated by different forms of pollutants.
Total area |
Agricultural areas |
Wooded areas |
Nationally protected areas |
Other areas |
||||
km2 |
km2 |
% |
km2 |
% |
km2 |
% |
km2 |
% |
69700 |
29886 |
43 |
30031 |
43 |
2779 |
4 |
9552 |
14 |
| Figure on total area from UN/ECE, 1998. | ||||||||
Population |
Population density |
Annual pop. growth |
Life expectancy at birth Male Female |
|||||
1000 |
per km2 |
% |
years |
years |
||||
| 5427 | 78 | 0,14 | 69 | 76 | ||||
| Figures from UN/ECE, 1998, and POPIN, 1999. | ||||||||
Legal and Administrative Basis
Definition of Contaminated Sites and Land
No data available
Legislation
Georgia has adopted following laws in the field of the environment.
| Year | Law | Function |
| 1960 | Criminal Code | Specifies penalties for violating environmental laws |
| 1978 | Forest Code | Specifies forest policy |
| 1981 | Law on the Protection of Atmospheric Air | Protects air quality |
| 1984 | Administrative Violation Code | Enforcement law |
| 1994 | Law on Soil Protection | Regulates the use of fertilisers |
| 1994 | Law on Plant Protection | Regulates the harvesting of wild plants |
| 1994 | Law on Basic Taxation. | Tax law |
| 1995 | Law on Transit and Import of Waste | Prohibits the import or transit of hazardous waste |
| 1995 | Law on Tourism | Encourages tourism |
| 1995 | Constitution of Georgia | Defines basic rights |
| 1996 | Law on Protected Area System | Provides for seven national parks |
| 1996 | Law on Mining | Introduces a taxation system for the use of subsurface natural resources |
| 1996 | Law on State Ecological Examination | Requires Environmental Impact Assessments (EIAs) to be carried out for certain classes of development. EIAs must be conducted and financed by the proposing party. NGOs may conduct independent EIAs with full access to information |
| 1996 | Law on Environmental Permission | Requires releases to the environment to be kept within specified limits. Companies must submit details of their planned emissions, releases and utilisation of resources |
| 1996 | Law on Environmental Protection | Framework Law |
| 1997 | Law on the Animal Kingdom | Provides a basis for protecting the diversity of fauna |
| 1997 | Law on Water Resources | Defines water as a non-renewable resource and introduces fees for its use |
Implementation of Limit Values
No data available
Responsible Public Authorities
The responsible public authorities are as follows:
| The Ministry of Environment of Georgia. | |
| The Ministry of Health of Georgia. | |
| Other governmental organisations. |
Registration
No data available
Characterisation of Soil and Groundwater Contamination
Sources of Soil and Groundwater Contamination
As contaminated sites could be considered the Black Sea Coastal Zone and Terminals located in this area and also those resorts where the technologies and proper treatment facilities are not functioning.
There are many sources of soil and ground water contamination. One of them is landfill. There are 46 registered landfills. These do not meet the requirements, even basic. There are also illegal landfills, and they are considered as the significant sources of contamination.
Number of Registered Contaminated Sites / Contaminated Land Areas
It is estimated that more than 27 ha territory of Georgia is contaminated by different forms of pollutants.
Areas contaminated by oil and oil products are estimated to amount more then 10 ha, and more than 17 ha are estimated to be contaminated with different kind of wastes. There are no specific landfills for toxic or hazardous waste.
In most cases, industrial waste (accumulated or generated) on the companies sites are toxic. According to the data of 1988, the total amount of waste is 64,5 mt from which 70% comes from mining activities. There is 1,3 mt of hazardous waste, among them are:
| 658 t hydrological waste; | |
| 15,8 thousand tons wall (fence) mud; | |
| 4,8 t cobalt containing dust; | |
| 1829 t arsenic waste; | |
| 726 t chromic waste; | |
| 293 t dust from reactive cleaning; | |
| 1404 t paintings and their solutions; | |
| 50000 t acid tar; | |
| 3000 t pesticide. |
Poor agricultural technologies, not environmentally sound disposal of fertilisers and chemicals, their improper usage, transportation and utilisation remains as considerable problems.
1990s data indicates that nautrical fusion in soil exceeds the limit 20 - 80 times. For pesticides, limits are exceeded 30 - 50 times in rivers and underground water.
Investigation Methods
Identification of Potentially Contaminated Sites and Areas
At present, analyses are not carried out for determining the contamination level and the concentration of the specific substances in water, soil and air (due to the poor capacity).
Investigation of Contaminated Sites and Areas
See above.
Facilities for Contaminated Soil
Handling and Treatment of Excavated Contaminated Soil
Handling and treatment of excavated contaminated soil is not often carried out, but sometimes this is done for a technical and biological, recultivation point of view.
Measures Used by Remediation of Soil and Groundwater Contamination
Financing and Liability
Investigation and Remediation Activities
Legal Requirements re. Polluters and Site Owners
According to the law, the site owner is obliged to protect the soil from the degradation and contamination.
The polluter pays for the pollution and caused damage to the owner and environment.
Polluters must compensate to owner damage and restore the soil that was contaminated. At one location, a contaminated site covers more than 27 ha, and it is estimated that costs for clean-up activities is around 120.000 GEL (Georgian Currency).
Scope of the Problem
Scale of the Problem and Handling Costs
Priority in Relation to Other Societal Problems
Illustrative Cases
References
Information provided by Givi Kalandadze at the Ministry of Environment of Georgia. April 14, 1999.
POPIN (Population Information Network) (1999). The Demography of Countries with Economies in Transition. At gopher://gopher.undp.org/00/ungophers/popin/wdtrends.
UN/ECE Statistical Division (1998). Trends in Europe and North America. 1998 Statistical Yearbook of the UN/ECE. At http://www.unece.org/stats/trend/trend_h.htm. Based on figures from 1994 – 1997.
[Front page] [Contents] [Previous] [Next] [Top] |