Survey and Health Assessment of Possible Health Hazardous Compounds in Proofing Sprays
4 Experimental investigations
- 4.1 Background. Summary of literature retrieval and survey
- 4.2 Selection of products
- 4.3 Analysis programme
4.1 Background. Summary of literature retrieval and survey
As it appears from Table 3.1, 29 products were registered of which 26 were purchased. To a certain degree, we succeeded in obtaining information about the solvent and propellant content especially from the procured safety data sheets. That information also appears from Table 3.1. For some products it also appears which type of coating (fluorpolymer, silicone based or the like) was used.
The information has been collected in Table 4.1.
Table 4.1 Outline of advance knowledge about substances distributed on spray and pump products.
| No. of spray products | No. of pump products | Total | |
| Total | 17 | 12 | 29 |
| Active substance: | |||
| Fluorpolymer based | 4 | 2 | 6 |
| Silicone based | 3 | 1 | 4 |
| Wax | 0 | 1 | 1 |
| Not informed | 10 | 8 | 18 |
| Solvent: | |||
| Organic solvent1 | 16 | 6 | 22 |
| Water | 0 | 3 | 3 |
| Not informed | 1 | 3 | 4 |
1Alcohols, ketones, esters, oil fractions (”nafta”, petroleum distillates). In some cases, mixtures of water and solvents are in question.
In connection with products where the active substance (coating type) was informed, either fluorine based products or silicone/siloxane based products are in question. In addition, one single product is based on wax. The exact chemical structure of the applied coating has not been informed in any of the cases.
The vast majority of the products contain organic solvents and they either constitute the main part in the product or are found in a mixture with water. A few pump products are declared as purely water based and it is not clear which type of coating is in question in connection with these products.
The literature searches show that products that have caused health effects mainly contain fluorine containing polymers (15 out of 17 products). In connection with 1 product the content is not stated and the last product that is described in an older article contains melamine. It should be noted that some products in addition to fluorine compounds also contain silicone compounds.
It is most likely that products with fluorpolymers in certain cases can give unwanted health effects in the respiratory passages. In principle, the health effects can be due to the following effects or a combination:
- The applied fluorine compounds are directly toxic to respiratory passages/ lung tissue.
- During use small particles are created that can penetrate into the lung tissue and e.g. give rise to harmful inflammatory conditions.
- The solvents that are used for fluorine compounds are injurious in the resulting concentration.
In literature (Yamahita et al, 1995), there are indications that aerosol size plays an important part. It is known from other connections that certain materials are non-toxic when they exist as larger aerosols, but they can be toxic when they exist as nanoaerosols (diameter < 100 nm). It has not been possible to find accessible information that indicates that solid or non-aerosol fluorpolymers in general are toxic.
Proofing agents that are used as spray (under pressure and with propellant) or by means of a pump are applied to the exposed material as aerosols in varying sizes that deposit on the material. Spray agents give rise to smaller aerosols (~10 µm) than pumped agents (~100 µm). However, the main drops will nevertheless mainly consist of very volatile organic solvents or water that quickly evaporate and therefore can leave substantially smaller aerosols consisting of non-volatile material behind.
In the light of the above, the following experimental investigations were carried out:
- Determination of size distribution of liberated aerosols during use and for a well-defined period of time after use.
- Screening for possible content of fluorine and/or silicium (as the proofing agent in many cases is unknown).
- Investigation of the compostion of the applied solvent, including content of other organic additives and microcompounds and the content of monomers or oligomers in the used proofing material.
4.2 Selection of products
16 products were chosen for analysis and the principle was that spray as well as pump products should be represented, that fluorine as well as silicone based products should be investigated and that products with known as well as unkown substances should be examined. The selected products appear from Table 4.2.
Table 4.2 Products selected for analysis.
| No. | Active substance | Aerosol mechanism |
| 1 | Fluorpolymer | Spray |
| 3 | Unknown | Spray |
| 4 | Siloxane polymer | Pump |
| 6 | Fluorpolymer | Spray |
| 8 | Unknown | Spray |
| 9 | Unknown | Spray |
| 11 | Fluorpolymer | Pump |
| 14 | Unknown | Spray |
| 15 | Unknown | Pump |
| 16 | Unknown | Pump |
| 18 | Silicone | Spray |
| 20 | Silicone | Spray |
| 21 | Fluorpolymer | Spray |
| 24 | Unknown | Pump |
| 25 | Unknown | Spray |
| 26 | Unknown | Spray |
4.3 Analysis programme
4.3.1 Screening analyses
X-ray
Screening was carried out to determine the content of the elements fluorine and silicium by means of wavelength dispersive x-ray spectroscopy. That is a quick method used to determine if the proofing agent is based on fluorine compounds, silicone compounds or others.
Undyed cotton fabric was spray proofed with the product for 10 s. The samples were analysed directly with the proofed side turned towards the x-ray pipe after evaporation of the solvent. The result gives a quantitative measurement of the fluorine and silicium content. Elements with atom numbers larger than fluorine are also detected by this method if they are present in significant amounts.
Table 4.3 Parameters for x-ray measurements
| X-ray equipment | Wavelength dispersive x-ray equipment with model Philips PW 2400 with UNIQUANT calculation programme ver 5.49 |
| Counting time | 6-20 sec. per element |
| Power pipe | 2400 W |
The achieved knowledge about content of elements has created the basis for applying subsequent GC/MS analyses so the greatest possible amount of information about substances and coating type has been obtained.
Aerosol measurements
In connection with the aerosol analyses it has not been necessary to carry out a separation of qualitative and quantitative measurements as the measurements always are quantitative and as a result state the amount of aerosols per volume unit. Please also see 4.3.2.6.
Semi-quantitative GC/MS screening
A subsample, approx. 2-3 g, was weighed and a known amount of dichloromethane containing internal standards was added. Internal standard was added in order to obtain semi-quantitative results. The product was sprayed directly into a calibrated flask and dissolved in dichloromethane. The extracts were subsequently analysed by means of gas chromatography (GC/MS).
The results from this analysis cover the semi-volatile compounds and not propellants or the most volatile organic solvents. In connection with the screening that was carried out, the detected compounds were merely identified by comparison with the NIST MS library (NIST02 Version 2.0).
The detection limit of the analysis method is estimated to be 0.01 mg/g and the measuring uncertainty is estimated to be ± 20 %, however, it is higher for some compounds as semi-quantification only has been carried out against an internal standard, bromobenzene. In some cases, another internal standard was used, o-terphenyl, due to interference in relation to bromobenzene.
Table 4.4 GC/MS analysis parameters
| GC/MS instrument | Agilent HP 5973 ALS |
| GC parameters | Column: Zebron ZB-1, 20 m x 0,18 mm id., 0.18 µm film thickness Carrier gas: Helium, constant flow at 0.8 ml/min. Oven programme: 40ºC for 2 min., 15ºC/min. up to 300ºC Injection: 275ºC, split 1:10. |
| MS parameters | Scan mode: 35-550 m/z Solvent delay: 2 min |
In addition, the samples were screened for volatile compounds by means of fixed-time microextraction (SPME) which makes it possible to detect very volatile substances as no solvents are used that can interfer with these substances.
A subsample, approx. 0,2 g, was weighed directly in headspace glass. The gas phase was subsequently analysed by means of SPME-GC/MS.
The results of this analysis mainly cover the content of propellants and organic solvents. In connection with the screening that was carried out, the detected compounds were merely identified by comparison with the NIST MS library (NIST02 Version 2.0).
The detection limit of the analysis method is estimated to be 0.001-0.1 mg/g, but will depend on the vapour pressure and affinity against the applied SPME fibre of the individual component. No assessment of the amount of the identified substances in the product was carried out, as the results only are qualitative and therefore no analysis uncertainty is stated.
Table 4.5 SPME-GC/MS analysis parameters
| GC/MS instrument | Finnigan Focus GC-DSQ |
| GC parameters | Column: Zebron ZB-1, 30 m x 0.25 mm id., 1.0 µm film thickness Carrier gas: Helium, constant flow at 0.8 ml/min. Oven programme: 40ºC for 1 min., 10ºC/min. up to 275ºC, 275ºC for 10 min. Injection: 275ºC, split 20 ml/min. |
| SPME parameters | Fiber: 85 µm Carboxen/PDMS Absorption: 35ºC, 15 min. Desorption: 3 min. |
| MS parameters | Scan mode: 35-450 m/z Ion source 225ºC |
The combination of x-ray and GC/MS analyses can give information about which type of proofing can be obtained from the different products and which chemical compounds form part of the structure. However, it should be stressed that the finished surface/proofing typically will be a polymerized material and it can be difficult to finally determine the exact structure of that material.
4.3.2 Quantitative analyses
In the light of the screening analyses, 10 products were selected for quantitative analyses in co-operation with the Danish Environmental Protection Agency. However, aerosol analyses were carried out on all 16 products from the screening phase.
With a starting point in which substances were identified during the screening analyses and an evaluation of the relevance of the different substances to a health assessment, a number of organic compounds in the 10 products were selected for quantification. In order to quantify the selected organic compounds it was necessary to use three different analysis methods due to the difference of the substances with regard to volatility. From the screening analyses it was assessed that it is not relevant to analyse all products with all methods and for all compounds. External standards were used to identify and quantify the organic compounds. Analyses in duplicate were carried out. The detection limits are estimated from analysis of external standards and they appear from the result tables. The analysis uncertainty of the analysis methods was estimated to be 10 % while uncertainty on analyses in duplicate appears from the result tables.
4.3.2.1 GC/MS analysis of dichloromethane solution
A sub sample (2-3 gram) was weighed and a known amount of dichloromethane (50 ml) containing internal standards was added. The samples were subsequently analysed by means of GC/MS, see Table 4.6.
By using that method, it was possible to quantify the following compounds: n-butyl acetate, n-propylacetat, 2-butoxyethyl acetate, d-limonene, toluene, ethylbenzene, xylene, dodecamethylpentasiloxane, 1-perfluoroctan-1-ol and other fluorine compounds. The following products were analysed: 1, 3, 4, 8, 14, 16, 18, 21 and 25.
Table 4.6 GC/MS analysis parameters
| GC/MS instrument | Agilent HP 5973 ALS |
| GC parameters | Column: Zebron ZB-1, 20 m x 0.18 mm id., 0.18 µm film thickness Carrier gas: Helium, constant flow at 0.8 ml/min. Oven programme: 40ºC for 2 min., 15ºC/min. up to 300ºC Injection: 275ºC, split 1:10. |
| MS parameters | Scan mode: 35-550 m/z Solvent delay: 2 min |
4.3.2.2 GC/MS analysis of carbon disulphide solutions
A sub sample (approx. 1 g) was weighed and a known amount of carbon disulphide (25 ml) containing an internal standard was added. The samples were subsequently analysed by means of GC/MS.
By using that method it was possible to quantify the following compounds: cyclohexane, heptane and 1-butanol. The following products were analysed: 1, 3, 4, 8, 18, 21, 25 and 26.
Table 4.7 GC/MS analysis parameters
| GC/MS instrument | Finnigan Focus GC-DSQ |
| GC parameters | Column: Zebron ZB-1, 30 m x 0.25 mm id., 1.0 µm film thickness Carrier gas: Helium, constant pressure, 0.8 psi. Oven programme: 40ºC for 2 min., 10ºC/min. up to 130ºC, 120ºC/min. up to 270ºC, 270ºC for 10 min. Injection: 275ºC |
| MS parameters | Scan mode: 40-400 m/z Solvent delay: 3.8 min |
4.3.2.3 GC/MS analysis of xylene solutions
A sub sample (approx. 1 g) was weighed and a known amount of xylene (25 ml) containing an internal standard was added. The samples were subsequently analysed by means of GC/MS.
By using that method it was possible to quantify the following compounds: 1,1-dichloroethane, methylene chloride, 1,2-dichloroethene and 2-butanon. The following products were analysed: 8 and 4.
Table 4.8 GC/MS analysis parameters
| GC/MS instrument | Finnigan Focus GC-DSQ |
| GC parameters | Column: Zebron ZB-1, 30 m x 0.25 mm id., 1.0 µm film thickness Carrier gas: Helium, constant pressure, 0.8 psi. Oven programme: 100ºC for 2,5 min., 30ºC/min. up to 250ºC, 250ºC/min. for 1 min. Injection: 225ºC |
| MS parameters | Scan mode: 40-400 m/z |
4.3.2.4 Analysis of fluorinated organic compounds
Samples that in the screening analyses turned out to contain substantial amounts of fluorine were analysed by means of GC/MS with negative chemical ionisation (NCI), see Table 4.9. This method is specific for organic substances that contain halogen atoms, including fluorine. In addition, this method can give information about the melocular mass of the substances which with advantage can be combined with the knowledge about the structure of the substances obtained by normal GC/MS. A subsample was weighed and acetone was added.
The following products were analysed: 4, 8, 14, 21 and 25.
Table 4.9 GC/MS analysis parameters
| GC/MS instrument | Agilent HP 5973 ALS |
| GC parameters | Column: Zebron ZB-1, 20 m x 0.18 mm id., 0,18 µm film thickness Carrier gas: Helium, constant flow at 0.8 ml/min. Oven programme: 40ºC, 10ºC/min. up to 300ºC, 300ºC for 5 min. Injection: 280ºC |
| MS parameters | Scan mode: 50-650 m/z |
4.3.2.5 Analyses of product no. 4
No organic substances were detected during the screening analyses of product no. 4. Therefore, it was attempted to dissolve product no. 4 in various solvents and they were analysed by means of GC/MS to determine if the solvent had any influence on this. The following solvents were tested: dichloromethane, acetone, carbon disulphide and xylene.
The content and concentration of the solvents were analysed by means of GC/MS. Similar to the screening analyses the products were injected directly into a calibrated flask and diluted.
4.3.2.6 Aerosols
All 16 products were analysed for liberation of aerosols of up to 1 µm in aerodynamic diameter during use on a piece of textile. Exposure took place in a purpose-built pipe system where it is possible to carry out dynamic measurements during use and measurement after maintaining the air for a shorter period of time. Measuring took place 1 min. and 7 min. , respectively, after application.
The objective of the analysis carried out after 7 min. was to investigate if the size distribution changed in the period immediately after use due to solvent evaporation.
The suggested times are not necessarily representative of typical application patterns but the results can from the knowledge of the applied product amount be immediately scaled to more or less comprehensive use. This procedure was chosen because it is not possible to state a standardised application pattern as the products are used for small and large items where exposure time and amount vary substantially.
By determining the applied product amount gravimetrically, a measure for the aerosol concentration per mass unit was obtained.
Undyed cotton fabric with a pore size of 200-300 µm (Figure 4.1) covered the purpose-built semi-closed experimental chamber (Figure 4.2 and Figure 4.3) and the distance from the spraying can to the fabric was 24 cm.
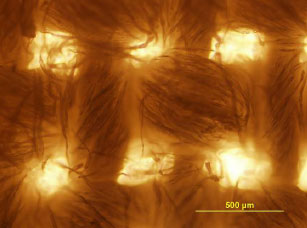
Figure 4.1 Optical microskope image of the undyed cotton fabric.
Fabric proofing was carried out by applying the product through a small cylinder at the top of the experimental chamber. Spraying took 10 s as it appeared that enough proofing liquid was liberated in that amount of time to carry out particle measurements. If proofing takes longer time e.g. 1-2 min. very large amounts of proofing liquid is liberated compared to the volume of the experimental chamber (7.5 litres). All products with propellant for spraying of the content were kept horizontal during proofing, and all produts with a pump mechanism for spraying of the content were kept vertical during proofing. After proofing the experimental chamber was closed with a plug so the time-related development in size and number of aerosols could be determined. There was no sign of condensation in the chamber.
Figure 4.2 Schematic drawing of the experimental setup.
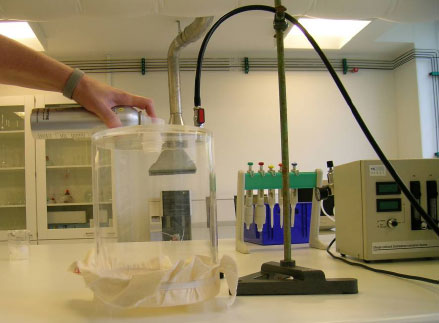
Figure 4.3 Experimental setup in plexiglass which is shown schematically in figure 4.2.
Aerosols created by the spray products were measured behind the product corresponding to the ordinary application situation where the user directs the spraying away from the body. That means that spraying does not take place directly into the measuring device, but measuring takes place on aerosols liberated to the air during use of the products.
Aerosol size distribution of the aerosols was measured with a Scanning Mobility Particle Sizer (TSI SMPS 3934 equipped with Differential Mobility Analyzer (DMA model 3081) and ultra fine Condensation Particle Counter (CPC model 3776)). Aerosols are drawn into the device and pass a radioactive source by means of which the aerosols obtain a known charge distribution. Then the aerosols are led to a laminar air flow through an electric field that separates the aerosols according to size. The aerosols are counted by a condensation particle counter.
Depending on the configuration, the instrument can measure particles in the interval of 2.5-1000 nm. In this project, measuring initially took place in the interval of 6-650 nm. In certain products, larger aerosols were suspected and in those cases the products were analysed for particles of between 650 nm and 1000 nm. The aerosols were sucked into a measuring instrument with a flow of 0.3 L/min. or 1.5 L/min. through a purpose-built silicone tube. Significant amounts of aerosols were not deposited in this tube. Each measurement of size distribution lasted 60 s.
Figure 4.4 gives a schematic presentation of the experimental course. After 10 s of proofing, the experimental setup was closed with a plug. After 60 s, aerosols were measured in the order of magnitude of 20-650 nm. This measurement took 60 s. Then another 5 min. passed and the measurement was repeated. The aerosol flow was then increased to 1.5 L/min. in order to measure particles down to 6 nm. Measurements took place at two different points of time to see if there was a time-related change in the size and the amount of the liberated aerosols.
Figure 4.4 Schematic presentation of the experimental course.
Before each measurement, a measurement of the background level of aerosols was carried out and it showed that the number of background aerosols varied from 500-4000 aerosols/cm³ per minute, corresponding to the expected level of background aerosols in an indoor environment.
Version 1.0 October 2008, © Danish Environmental Protection Agency