Model assessment of reductive dechlorination as a remediation technology for contaminant sources in fractured clay: Modeling tool
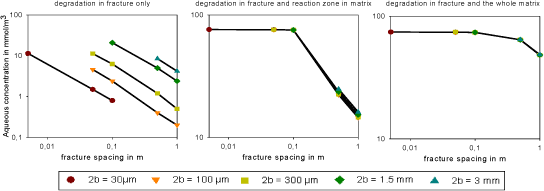
Figure J.4 – Average maximum concentration for the daughter products (DCE and VC), for degradation in fracture (a), degradation in fracture and reaction zone in matrix (b) and degradation in fracture and the whole matrix (c), note the log vertical and horizontal scale
Version 1.0 July 2009, © Danish Environmental Protection Agency