Model assessment of reductive dechlorination as a remediation technology for contaminant sources in fractured clay: Modeling tool
Appendix K Aquifer model - Sensitivity analysis
Numerous independent parameters are used in this model, but it is possible to group some parameters in order to reduce the amount of independent variables.
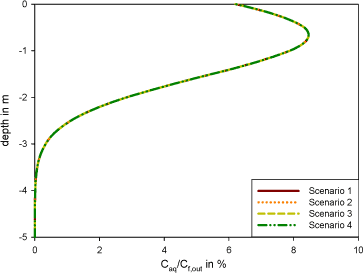
For the case with top recharge, it appears that the dilution factor df depends on the flow factor (ff), defined as the ratio of the recharge rate I and the mean specific discharge (=K*i). The variable ff groups recharge rate I, hydraulic conductivity K and hydraulic gradient i. This concept is illustrated with some examples, where the aquifer thickness, the transverse vertical dispersivity, the porosity and the source width are fixed (b = 5m, αT = 0.005 m, φaq = 0.3 and W = 30m) while the hydraulic gradient, the recharge rate and hydraulic conductivity vary in order to keep ff = 0.5% (Table K.1 and Figure K.1).
Table K.1 - Four scenarios with ff = 0.5%
| Hydraulic conductivity | Recharge rate | Hydraulic gradient | Flow factor | |
| K | I | i | ff | |
| m/year | m/year | - | % | |
| Scenario 1 | 2500 | 0.1 | 0.008 | 0.5 |
| Scenario 2 | 5000 | 0.05 | 0.002 | 0.5 |
| Scenario 3 | 10000 | 0.2 | 0.004 | 0.5 |
| Scenario 4 | 30000 | 0.3 | 0.002 | 0.5 |

Figure K.1 – Dilution factor for leaky aquifer along the cross section at 100 m from the source for the 4 scenarios
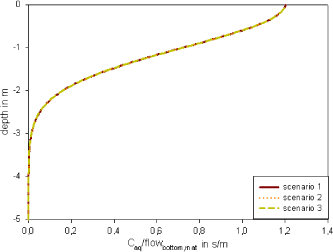
The results are identical for all cases shown in Figure K.1. For the confined aquifer case, df depends on the mean specific discharge (=K*i), as shown with three examples on Figure K.2, with the same parameters and a mean discharge of 6 m/year (scenario 1 with K = 10000 m/year and i = 0.0006, scenario 2 with K = 3000 m/year and i = 0.002 and scenario 3 with K = 750 m/year and i = 0.008).

Figure K.2 – Dilution factor for confined aquifer along the cross section at 100 m from the source for the 3 scenarios
A sensitivity analysis is performed on the 5 independent parameters (flow factor, source width, transverse dispersivity, aquifer thickness and porosity), with change of +/- 20% and the sensitivity index is calculated relatively to the change in the dilution factor df. The analysis is performed for both the leaky and confined cases.
Table K.2 shows that the source width is the most sensitive parameter in case of a leaky aquifer, followed by the flow factor and the vertical transverse dispersivity. On the contrary the model is almost insensitive to the aquifer thickness and the porosity. For information the sensitivity to the parameters which formed the flow factor is indicated.
The same conclusions can be done for the confined case (Table K.3).
Table K.2 – Sensitivity index for the contaminant flux model in case of a leaky aquifer
| Base case value | +20% | -20% | Average | |||
| Source width | W | m | 30 | 6.09 | -6.09 | 6.1 |
| Flow factor | ff | % | 0.33 | 4.87 | -5.13 | 5.0 |
| Transverse dispersivity | αT | m | 0.005 | -2.15 | 2.83 | 2.5 |
| Aquifer thickness | b | m | 5 | -0.09 | 0.14 | 0.1 |
| Porosity | φaq | - | 0.25 | 0 | 0 | 0 |
| Hydraulic conductivity | K | m/year | 3000 | -4.26 | 6.05 | 5.2 |
| Hydraulic gradient | i | - | 0.01 | -4.26 | 6.05 | 5.2 |
| Recharge rate | I | m/year | 0.1 | 4.87 | -5.13 | 5.0 |
Table K.3 - Sensitivity index for the contaminant flux model in case of a confined aquifer
| Base case value | +20% | -20% | Average | |||
| Flow factor | ff | m/s | 30 | -0.67 | 1 | 0.84 |
| Source width | W | m | 30 | 0.8 | -0.81 | 0.81 |
| Transverse dispersivity | αT | m | 0.005 | -0.35 | 0.48 | 0.42 |
| Aquifer thickness | b | m | 5 | 0 | 0 | 0 |
| Porosity | φaq | - | 0.25 | 0 | 0 | 0 |
| Hydraulic conductivity | K | m/year | 3000 | -0.67 | 1 | 0.84 |
| Hydraulic gradient | i | - | 0.01 | -0.67 | 1 | 0.84 |
Version 1.0 July 2009, © Danish Environmental Protection Agency