Funktionen af den reaktive væg på Vapokon grunden - 7 år efter etableringen
Bilag 13 Rapport fra VITO, Belgien – mineralogisk og mikrobiologisk karakterisering af jernkerner fra væggen på Vapokon-grunden

VAPOKON BARRIER: Overview of microbial and mineralogical characterization
T. Van Nooten & L.Bastiaens
L242G/L2480/TVN/lb07-10
May 2007
Introduction
In March 2007, Vito received 6 cores containing undisturbed material from within and near an iron barrier in Denmark (Vapokon site). These samples were taken and provided by the Danish Technical University (Peter Kjeldson & Nanna Muchitsch). The task of Vito in this project was:
- to characterize the microbial population in the different samples with PCR-technique
- to characterize the mineralogy in the different samples
This brief report describes the results that were obtained and contains:
- A short summary of the background information about the barrier, based on provided literature
- An experimental section with a description of the methods and the results
- Conclusion
Background
In September 1999, a funnel-and-gate Fe0-PRB was installed at the Vapokon site (Denmark) for the treatment of groundwater contaminated with CAHs (PCE, TCE, 1,1,1-TCA, cis-DCE and DCM) and BTEX. The gate (14.5 m wide – 9 m deep – 0.8 m thick) was filled with 270 ton Connelly iron (ETI-CC-1004; 0.30-1.18 mm; K = 20.28 m/d ; n = 0.60) and flanked up- and downgradient by 1 m gravel packs.
Groundwater with high concentrations of Ca2+, total alkalinity and sulfate is flowing through the barrier with a flow velocity of 99.5 m/year (retention time of 70.4 h). Four years of monitoring (March 2000 – August 2003) revealed (i) efficient CAH removal (>92%), (ii) removal of Ca2+ (82%), total alkalinity (90%) and sulfate (69%; concentrations upgradient ranging from 27 to 189 mg L-1), and (iii) a pH increase (7 à 9.5-10.5) and Eh decrease (105 à -150 mV) across the barrier.
Six core samples were taken in March 2007 from different locations, in or around the barrier, for microbial and mineralogical characterization. Precipitates that could be expected based on groundwater geochemistry include carbonates (CaCO3, ferrous hydroxy carbonate, siderite), iron oxides (carbonate green rust, magnetite, goethite) and sulfides (mackinawite). The detection of sulfate-reducing bacteria was expected due to the observed sulfate removal.
Experimental section
Samples were taken from 2 locations in the barrier, each at two depths. Furthermore, aquifer samples were taken up- and downgradient from the barrier (Figure 1). The locations were selected due to differences in permeability and contaminant concentrations (Figure 2 and 3). All core samples were stored anaerobically at 4 °C. The cores were dismantled in an anaerobic glovebox. Material was taken at different core depths and homogenized. From each depth, 2 g subsamples were taken in duplicate for from DNA-extraction. The microbial diversity of the samples was evaluated by performing PCR, using group specific primer sets, on 10-times diluted DNA-samples.
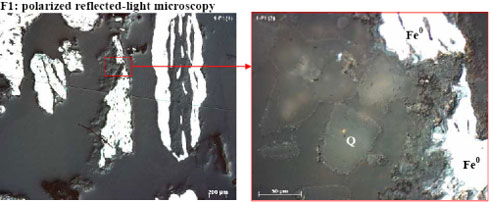
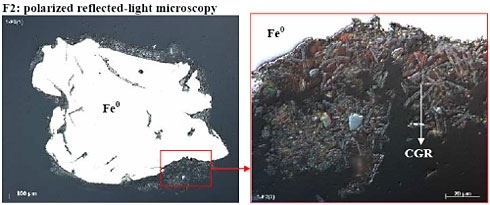
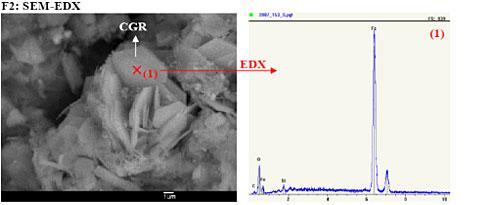
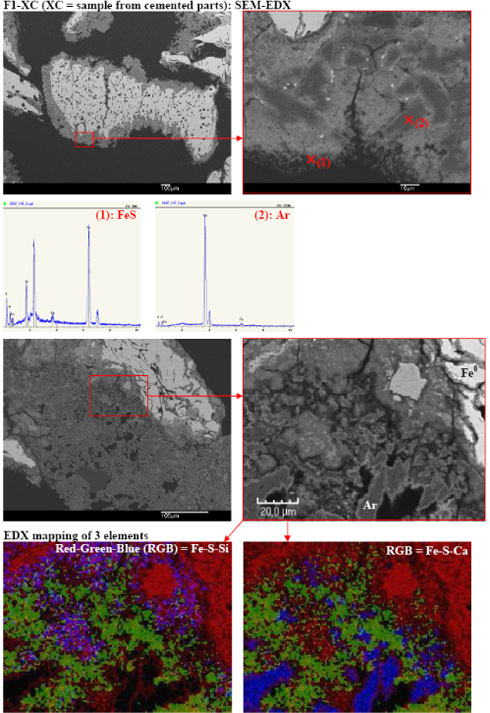
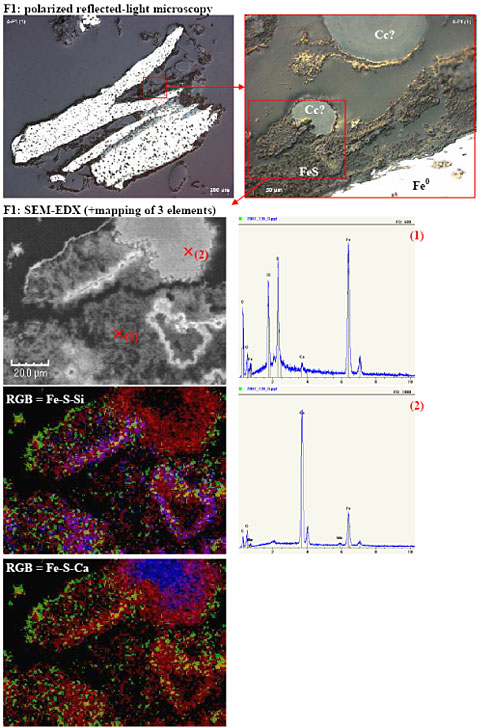
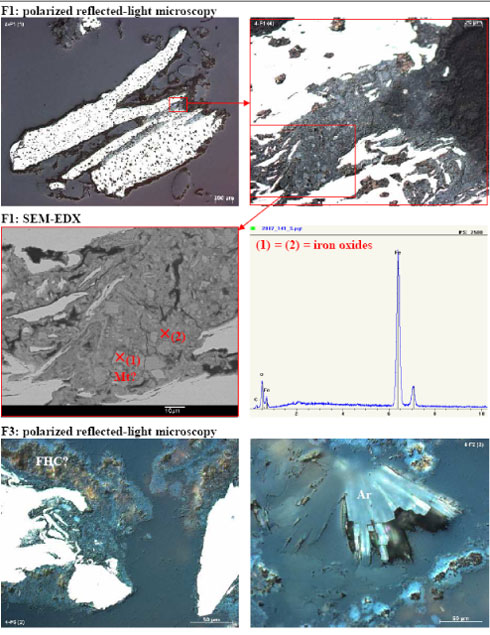
For XRD-analysis, 25 g subsamples were taken and sonicated for 30 minutes in 50 mL acetone to detach precipitates from Fe0 filings. The fine precipitate fraction was recovered by filtration of the acetone solution and stored anaerobically in capped glass vials. For microscopical analysis, approximately 1 g subsamples were taken from selected sections and dried at room temperature in the anaerobic glove box. Dry Fe0 filings were embedded in epoxy and polished after hardening for 12 h. Polished sections were studied using a reflected-light microscope and selected sections were platina coated for examination with SEM-EDX.
VAPOKON BARRIER: Overview of microbial and mineralogical characterization
Figure 1. Plan distributions of the sum of maxium concentration of (a) major chlorinated organics and (b) chlorinated daughter products across the Fe0 PRB in January 2003.
Figure 2. (a) Plan; (b) side views of movement of Li+ plume across permeable treatment zone.
Figure 3. Hypothesis of the flow circulation established by the clogged upgradient interface of the upper part of the Fe0 reactive medium
Location 1:
Core 1: gravel (G) – iron (F) (2 mbgs)
G1 5-8 cm
G2 22-25 cm (dark color)
F1 35-38 cm (loose filings, black color)
F2 49-52 cm (loose filings, black color)
F3 62-65 cm (loose filings, black color)
XRD and PCR results:
- Precipitate mass obtained after ultrasonification in acetone is
indicated by the shaded bars. - XRD results are presented in the rectangular callouts
Location 1:
Core 2: gravel (G) (5 mbgs)
G1 5-8 cm
G2 24-27 cm
G3 43-46
XRD and PCR results:
Location 2:
Core 3: gravel (G) – iron (F) (3 mbgs)
G1 5-8 cm
F1 13-16 cm (black color, some cemented parts - diam. ~10 mm)
F2 33-36 cm (loose grains, black color)
F3 51-54 cm (loose grains, black color)
XRD and PCR results:
Location 2:
Core 4: iron (F) (5 mbgs)
F1 5-8 cm (loose grains, very black color)
F2 24-27 cm (loose grains, dark grey/green color)
F3 63-66 cm (loose grains, grey color)
XRD and PCR results:
Conclusions microbial characterization:
- Most of the duplicate samples exhibited similar PCR results. In case not, results were extrapolated:
- + and (+) → + + and - → (+) (+) and - → (+)
- Detection of Eubacteria, Archaea, methanogens, SRB, IRB, denitrifying bacteria and halorespiring bacteria. No detection of Geothrix and nirK-containing denitrifying bacteria.
- Detection of significantly more microbial groups in gravel and entrance part of the Fe0 matrix, compared to Fe0 samples more downgradient (except for core 4). This is consistent with the findings of Wilkin et al. (2002) and Van Nooten et al. (2007) and might be explained by a decreasing redox potential and a rising pH along the flow path.
- Detection of more halorespiring bacteria in the iron samples of location 2 (core 3 and particularly core 4), compared to iron samples of location 1 (core 1). This might be related with the higher inflow of CAH-contaminated groundwater at location 2 (deep).
- No differences could be detected between the upgradient and downgradient aquifer samples
Table 1. Overview of all PCR results (duplicate samples)
Conclusions mineralogical characterization:
- Loose and uncemented iron grains in all iron cores, except for core 3 where some cemented parts could be observed at the gravel-Fe0 boundary.
- Most of the hypothesized mineral precipitates in the iron samples could be detected with XRD, including CGR, FHC, magnetite and CaCO3 (calcite and aragonite) (but not siderite and goethite!).
- Similar precipitates for cores 1 and 3 (shallow: ~2 and 3 m bgs), but strongly different compared to core 4 (deep: ~5 m bgs).
- Quartz was only detected at the entrance of the iron barrier, probably due to the inflow of fine particles from the gravel pack.
- Detection of different mineral phases in the gravel pack (core 2), including Q, Cc, Mk, Alb, Mcl and Gl.
- Iron sulfides were expected to be present, due to significant sulfate removal in the barrier. Crystalline iron sulfides (mackinawite) could only be detected in core 2 (gravel). In the other cores, however, iron sulfides were present as amorphous FeS coatings (evidenced by SEM-EDX), which can not be detected with XRD.
- The precipitate mass that could be extracted after ultrasonification was significantly higher for core 4 (particularly the entrance part, F1). A high amount of amorphous FeS was believed to be present at the entrance of core 4, based on to the high amount of extracted black precipitates and the microscopical observations.
Table 2. Overview of the XRD-results (height of principal peak is given in counts s-1)
Figure 4. (A) Semi-quantitative overview of the XRD results of the iron cores (height of principal peak is given in counts s-1). (B) Overview of the precipitate mass obtained from the iron cores after ultrasonification.
References
Van Nooten, T.; Lieben, F.; Dries, J.; Pirard, E.; Springael, D.; Bastiaens, L. Impact of microbial activities on the mineralogy and performance of column-scale permeable reactive iron barriers operated under two different redox conditions. Environ. Sci. Technol., Accepted for publication.
Wilkin, R. T.; Puls, R. W.; Sewell, G. W. Long-term performance of permeable reactive barriers using zero-valent iron: geochemical and microbiological effects. Ground Water 2002, 41, 493-503.
Version 1.0 marts 2009, © Miljøstyrelsen.