Ship emissions and air pollution in Denmark
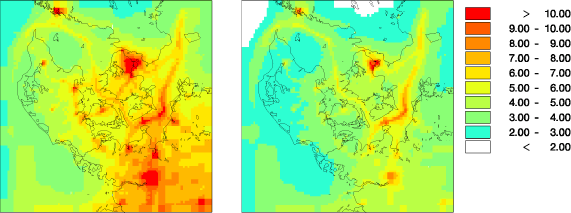
Fig. 6 Calculated concentrations of NO2 In μg/m³. The left panel represents the situation in 2007, the right panel the situation in 2020. There is hardly any change in the emissions of NOX from ship traffic between the two years, while there are large reductions for land-based sources.
Version 1.0 October 2009, © Danish Environmental Protection Agency