Water Prices in CEE and CIS Countries. Volume II: Case Studies
Chapter 2.Willingness to pay
2.1 Introduction
The objective of this chapter is to present the methodology applied and the results of the stated preference survey.
The methodology comprises a number of steps. These include background research, qualitative research and quantitative research. Each of the steps is discussed in the section on methodology.
The quantitative research is based on interviews with 150 consumers living in Brno and being responsible for paying the household water bill. While the estimates for the willingness to pay is presented in this chapter the estimates for the water demand elasticities are presented in Section 2.5.
In order to assess the willingness to pay a stated preference approach has been used, and the results indicate some willingness to pay. There is willingness to pay both to have improved water quality and to have a cleaner environment.
2.2 Stated preference survey methodology
The method applied in this stated preference survey contains a number of tasks. These include:
- Background research
- Qualitative research
- Design of questionnaire
- Pilot survey
- Final survey
- Data analysis.
Each of the points is discussed below.
2.2.1 Background research
The first step in the analyses is background research. The purposes of the background research are to:
| Understand the realistic technical alternatives and in particular their impact on realistic service levels; | |
| understand payment collection, enforcement and usage measuring princi-ples and practices, and the financial standing of the utility; | |
| understand the socio-economic context, in particular income levels and di-stri-bution and types of households. |
The background research have also included:
| Discussions with other team members covering technical and financial issues; | |
| consultation of earlier reports, statistics, working papers giving general introduction to the utility and the local economy in Brno. |
2.2.2 Qualitative research
Following the background research, qualitative research amongst consumers is undertaken. The purposes of the qualitative research are to:
| Gain a first understanding of which service factors are perceived as important by consumers, and which factors are the more important; | |
| gain a first rough understanding of willingness to pay for water and waste water services and the most important factors; | |
| understand the cultural context and formulations understood by consumers in relation to water and waste water utilities. |
In Brno twelve face-to-face interviews with consumers were carried out. An open-ended topic guide was applied. The face-to-face interviews were conducted in an interview room. Two interviewers interviewed each respondent with consecutive translation by a professional interpreter.
The qualitative research is critical, as the outputs form the limitations to what is going to be explored during the quantitative research.
2.2.3 Design of questionnaire
On the basis of the information gathered in the background research and the qualitative work the questionnaire is designed. The questionnaire includes :
| present water and wastewater services; | |
| attitude towards the water services; | |
| attitude towards BVK; | |
| willingness to pay for improvements of the tap water quality and the wastewater treatment; | |
| water demand elasticities (for price and income); | |
| political observance and attitude towards EU; | |
| socio-economic background. |
Many subjects can be covered by a questionnaire. However, a selection has to be made in order to keep the length of an interview acceptable to the respondent.
A long list of possible improvements to the water services was identified in the qualitative research. The most important services are included in a stated preference game as described below, because only a limited number of services can be evaluated in the stated preference game.
An example of a choice task in the stated preference game is presented in Table 2.1. Here the respondent must decide whether they would prefer to pay 14 Kc extra to have tap water as good as bottled water, or whether they would prefer to have better wastewater treatment and pay the same amount as at present. If tap water quality is an important issue to the respondent B is preferred, if clean wastewater and/or money saving is important to the respondent A is preferred.
In both alternatives wastewater treatment meets the EU standards. This is altered in other choicetasks.
Table 2.1:
Example of a choice pair

Eight choice-tasks, such as the above, are presented to each respondent. There is a limit to the number of choices a respondent can make while remaining concentrated and while still presenting a realistic choice.
The stated preference game consists of four factors:
| Water quality; | |
| Standard of wastewater treatment; | |
| Cost; | |
| Wastewater treatment and EUstandard. |
Usually four is the maximum number of factors the respondents are able to evaluate in one stated preference game. This is the reason why e.g. information issues have not been included in the game.
The stated preference analysis focuses on exploring the willingness to pay for improvements. Two or three levels represent each of the service improvements. Each level describes a service improvement and these service improvements are the ones that can be evaluated when analysing the game. The costs are increasing in comparison to the present situation in all choicetasks. The levels are described in Table 2.2.
Table 2.2:
Factor and levels in the stated preference game
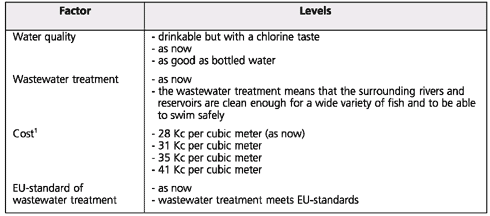
Note: (1) One third of the respondents was presented to a game with lower cost levels, i.e. 28, 32 and 34 Kc.
Three different designs of the stated preference game were made. Two designs with the levels in the above table and one design with lower cost, i.e. 28, 32, and 34 Kc. This is in order to be able to make a statistically sound model.
Price and income elasticities for water demand are also examined in the survey for Brno. The respondents are asked to state water consumption and income in 1997 and 1999. This enables a calculation of the income elasticity.
In order to estimate a price elasticity stated intention questions are included in the questionnaire. An example is:
| If cold water and wastewater costs were 42 Kc per m3, do you think your household would reduce the amount of cold water it uses? If affirmative: How much? |
Each respondent is presented to two stated intention questions where the price per cubic meter differs. Also, like the cost levels in the stated preference game, the prices per cubic meter is varied for different types of questionnaires.
The estimated elasticities are presented in Section 2.5.
2.2.4 Pilot survey
The pilot survey is used to test the design of the questionnaire and to identify necessary changes. In Brno, 25 pilot interviews were conducted and the results were analysed. The answers are checked in order to ensure that all questions are well understood and that the stated preference game is working well. Checking the stated preference games includes assessing if all levels are relevant to the consumers, and if the levels of e.g. cost are perceived to be within realistic limits. As an example, if respondents choose alternatives with the lowest cost in most stated preference questions the cost levels should be adjusted downward. This was in fact the case for the pilot in Brno.
2.2.5 Final survey
By including the changes to the questionnaire from the pilot survey the final questionnaire was made. 125 respondents where chosen at random and interviewed. Only respondents responsible for paying the water bill were interviewed.
2.2.6 Data analysis
Both the data from the pilot questionnaire and the data from final questionnaire are included in the statistical analysis. This is possible because only few changes were made to the pilot questionnaire. However, where questions differ significantly in the two versions the results from the pilot questionnaire are excluded. This is the case for the stated preference game.
The stated preference data is analysed by applying advanced statistical tools. A so-called logit model is estimated. Before estimating the model a set of a priori hypotheses is described and these are tested in the model. Examples of such a priori hypotheses are:
| consumers with higher income have a higher willingness to pay; | |
| consumers with a water meter have a higher willingness to pay because they are able to adjust consumption as a response to an increase in tariffs. |
The model also allows for different willingness to pay for consumers with different backgrounds, e.g. age and gender. For age and gender the model process is exploratory, that is no a priori hypotheses are needed. However, all effects in the model must have a clear interpretation.
In order to ensure that the sample is representative, it is tested whether the age and gender distribution in the sample differs from the distribution in Brno. Census data from 1998 is used. The test indicates that some groups are over represented in the sample, and therefore all results are weighted by age and gender. By weighting with the age and gender distribution of entire population, it is assumed that all groups are equally responsible for paying the water bill. Hence, the results can be interpreted as representative.
2.3 Qualitative research
The qualitative research was based on a topic guide that was prepared using background information about Brno. Interviews were carried out as face-to-face interviews in interview rooms. Two members of the project team interviewed each respondent with consecutive translation by a professional interpreter.
Each interview lasted between 30 minutes and 1 hour and 5 minutes (design time around 35 minutes). Twelve interviews were carried out.
Respondents were selected by random. The respondents were between 24 and 75, and represents different employment status and different income groups. Also, the respondents covered in the qualitative work have different political standpoints and resided in various districts throughout Brno. Hence, the respondents interviewed represent a broad spectrum of inhabitants in Brno.
2.3.1 Results from the qualitative work
Water quality
Most of the respondents interviewed do not drink the water directly from the tap. Instead they buy bottled water.
The majority of respondents interviewed are willing to pay for better tap water, but some respondents would prefer to keep the low quality of tap water alongside the present price and continue to buy bottled water for drinking.
Wastewater standard
The respondents interviewed are aware of the environmental problems implied by a low standard of wastewater treatment. The main perceived indications of problems with present wastewater treatment are smelly river, lack of fish or not possible to eat fish cached in the river, and not possible to swim in the river.
The respondents also mentioned other sources of pollution than wastewater from households. A few respondents believe industries are the main polluters, and one claims that households do not to pollute at all.
A majority of the interviewed respondents were aware that the EU requires a certain level of wastewater treatment for the Czech Republic to become a member of the European Union.
Most of the respondents are be willing to pay more for better wastewater cleaning. Accepted increase of price ranges from 10% to "several times". One respondent wished to have a guarantee or refund of price increase if improved wastewater treatment do not benefit the local environment.
Water cost
Most of the interviewed respondents are not aware of how much their normal monthly payment is, but aware of the unit costs.
Most respondents think water and wastewater services have increased in price at the same rate as other services. This is in spite of the fact that water prices have increased much more than other prices and wages in the past two years.
Perceptions of what would happen if consumers do not pay the water bill are mixed. Some think that consumers not paying are cut off and some think nothing happens. Almost all respondents interviewed find it reasonable to cut off consumers not paying their water bills - at least after a warning.
All twelve respondents would keep on paying their bill even if the price was increased.
Metering and water consumption
Most of the twelve respondents have individual metering for the flat or house and the rest have a meter for the block they live in. However, the individual meters in a block of flats are not managed by BVK. The landlord uses these to monitor the use of water.
Most respondents interviewed have undertaken measures to reduce consumption e.g. by repairing leaks fast, showering, and using less water in the bathtub. Some indicate that they can reduce consumption further.
There is a certain level of environmental concern among the twelve respondents interviewed. A majority recycles or would like to recycle if facilities were available. But also, some do not undertake any actions at all to act friendly to the environment.
Knowledge of BVK
Most of the twelve respondents know BVK. They do not believe that BVK is inefficiently managed. However, some indicate that competition would be better, that BVK is a monopoly, and that foreign involvement would lead to better management.
A few had heard about some foreign involvement in BVK, and there are no clear preferences for a Czech versus a foreign operator among the twelve respondents. On the contrary, there is not a lot of confidence in a state-owned company among the interviewed respondents.
Many respondents are aware that a new major wastewater treatment plant is being planned. The aware respondents know that the plant is expensive to build.
Upon prompting, most of the respondents trust that investments by BVK will lead to better wastewater treatment and a better local environment.
Information
The respondents interviewed do not find themselves well informed about water issues by BVK. However, they are able to obtain information through local media (press and radio) on the water and waste-water services.
2.4 Quantitative research
The number of respondents included in the stated preference study is 150, i.e. 125 from the final questionnaire and 25 from the pilot questionnaire. Because of modifications between the pilot and the final questionnaire the 25 respondents from the pilot questionnaire are not always included in the results presented in the following.
While the results for the willingness to pay is presented in this section the survey results for the water demand elasticities is presented in Section 2.5.
2.4.1 Socio-economic characteristics
A majority of the 150 respondents are women (58%) and more than half of the respondents are older than 44 years. For this reason the age and gender distribution is compared to the age distribution for the Brno population by 31 December 1998. The total population at this date was 384,727 inhabitants.
The comparison between the sample distribution and the Brno distribution is shown in Figure 2.1. Males between 18 and 34 years are under-represented whereas males between 55 and 60 years are over-represented. For females the age groups between 18 and 24 years and between 55 and 60 years are under-represented, whereas women between 25-34 years are over-represented. In order to have a representative sample of Brno the results of this survey have been weighted. This means that the results are representative to the entire population and not necessary to the consumers responsible for paying the water bill.

Figure 2.1:
Age of the respondents, stated preference survey and the population in Brno by
31.12.1998
Three quarters of the respondents have been living in Brno for more than ten years. The average time in Brno, for all respondents, is 21 years.
The employment status for the respondents is shown in Figure 2.2. Two thirds of the respondents are employed. The largest employer is the public sector (31%). There is a relatively high proportion of retired people (24%) among the respondents, which is expected considering the number of respondents older than 60 years.
Figure 2.2:
Employment status of the respondents

Note: These results are not weighted.
The distribution on type of accommodation is shown in Table 2.3. The respondents are equally divided into rented accommodation and privately owned accommodation, cf. Table 2.3. A majority lives in flats.
Table 2.3:
Type of accommodation

Note: These results are not weighted.
The number of household members varies between one and eight with an average just above three. More than half of the households do not have children, cf. Table 2.4.
Table 2.4:
Type of household

Note: These results are not weighted.
The distribution of monthly household net income is represented in Figure 2.3.

Figure 2.3:
Distribution of monthly household income after tax in Kc
Note: The 25 answers from the pilot questionnaire are not included. The results are valid for 124 respondents. These results are not weighted.

Figure 2.4:
Distribution of monthly net income per person
Note: These results are not weighted.
The income data in the survey can be compared to the official income data from the second quarter of 1999. In the second quarter of 1999 the monthly net income was 6,774 Kc per person. This can be compared to the monthly average of 5,936 Kc per person in the stated preference survey. When comparing the figures it should be kept in mind that the average from the survey is calculated by using the midpoint of each interval, and is collected in the third quarter rather than the second. A majority of the respondents experienced an increase in the income during the last two years. 17% of the household have experienced a decrease in the income that amount to between 5 and 70% of the previous income, and 20% did not have any change in their income. The change in income is equally distributed among different age groups.
Political observance
Table 2.5 compares the votes of the respondents in the 1998 municipal election with the results for the 1998 regional election in Brno. The column showing the municipal election is the one from the stated preference survey.
The results are very close for the main political parties, which indicate that the stated preference survey is politically representative to the inhabitants of Brno.
Table 2.5:
Brno 1998 municipal (stated preference sample) versus 1998 regional election

Note: These results are not weighted.
Some of the respondents did not want to reveal their votes in the 1998 municipal and 28% answered that they did not vote. In the 1998 regional election in Brno 61% did not vote.
Almost half the respondents (46%) think that the Czech Republic should join EU in 2003 as planned. 17% think that it should be later. Only 12% do not think that the Czech Republic should join EU in 2003.
Environmental concern
More than three-quarters of the respondents recycle waste. They mainly recycle paper, glass and plastics. 19% of the respondents states that they agree with various environmental organisations like Greenpeace, Children of the Country, Rainbow Movement, and Veronica. Half of the respondents do not have an opinion towards the organisations.
2.4.2 Public services
For the respondents the most important public services to improve are health and police and prisons. These services are followed by protection of local environment, public transport, local roads and housing. Treatment of wastewater and supply of cold water are in the low end. However, most consumers find protection of the local environment important, and a large group is aware that the lack of wastewater treatment results in local environment problems.
For all these services the majority states that improvements are important or very important to them.

Figure 2.5:
Level of importance for improving the public services
Note: Data are weighted by the age and gender distribution of Brno, census 1998.
The consumers are generally dissatisfied with all utilities in terms of value for money, cf. Figure 2.6. They are also quite dissatisfied with the value for money of cold and wastewater services.

Figure 2.6:
Ranking utilities in terms of value for money
Note: Data are weighted by the age and gender distribution of Brno, census 1998.
2.4.3 Water and wastewater services
Water consumption
The average monthly water consumption is approximately 9 m3 per household. On the top of this consumption, two thirds of the respondents buy bottled water. The weekly purchase per household is 11 litres, which amounts to 3.5 litres per person. 7% of households buy more than 20 litres per week. The large amount of bottled water consumed indicates that a large proportion of the consumers do not drink the tap water directly from the tap.
Around half of the respondent changed their consumption of cold tap water in the last two years. 30% reduced the tap water consumption and 20% increased the tap water consumption. The main reasons for these changes were to save money (45%) and because of a change in the number of people in household (30%).
35% of the respondents find themselves able to reduce their water consumption while most consumers find that they cannot reduce consumption any further, Table 2.6. The highest ability to reduce consumption of water is found among consumers that are not aware of the change in consumption during the two years.
Table 2.6:
Possible reduction in water consumption 
Note: The data have been weighted
The main proposals made for reducing the cold water usage are a more economical way of washing dishes, toilet use, and to take shower instead of bath.
Water payment
More than two thirds of the households have separate cold water meter, and almost al households with a meter are billed according to the meter. Half of the households pay the bill for cold water and the wastewater is with other items, and the other half pay the water bill separately.
Table 2.7 shows the consumers perception of the increase of the cost per cubic meter for cold water and wastewater treatment during the last two years.
Table 2.7:
Increase of the cost per cubic meter for cold water and wastewater treatment in the
last two years
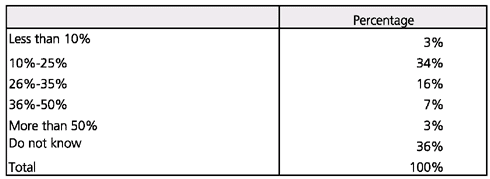
Note: Data are weighted by the age and gender distribution of Brno, census 1998.
In fact between 1997 and 1999 price have increased of 27% for water and 33% for wastewater. A lot of consumers are underestimating the real increase. Also, a majority is not aware of what part of the bill is for cold water supply and what part of the bill is for wastewater treatment.
The average amount paid by the consumers is illustrated in Figure 2.7. The amount has increased from 260 Kc in 1997 to 279 Kc in 1999.

Figure 2.7:
Average household payment for cold water and wastewater, Kc per month
Note: Data are weighted by the age and gender distribution of Brno, census 1998.
The distribution of the monthly water bill is shown in the table below for 1999. Most households pay less than 300 Kc. per month.

Figure 2.8:
Distribution of the household water bill in Kc per month, 1999
Note: The figure is based on 144 consumers, 6 did not state the amount they paid. From the final questionnaire 87 consumers brought their water bill to the interview and 32 gave an estimate. Data are weighted by the age and gender distribution of Brno, census 1998
The consumers' attitude towards non-payers was also examined. 64% of the respondents think that non-payers of water charges should be disconnected.
The average payment for water services is just below 2% of the household net income. The distribution of the proportion of the income spent on water services is shown in Figure 2.9. More than a third of the consumers pay less than 1% of the income, while less than 5% pays more than 5% of the net household income.

Figure 2.9:
Distribution of the household water bill in Kc per month, 1999
Note: Data are weighted by the age and gender distribution of Brno, census 1998
Water quality and standard of wastewater treatment
The consumers are divided into equally sized groups concerning the quality of cold tap water. A third of the consumers find the water quality good and another third find the water quality poor; the rest find that the water quality is neither good nor poor. The ranking of the quality of cold tap water and wastewater treatment is shown in Figure 2.10.
It is more difficult for the consumers to rank the standard of wastewater treatment. Almost half of the consumers (47%) cannot rank wastewater standard. This is quite a lot compared to the few consumers that cannot rank the cold water quality. For wastewater, the consumers who state their opinion have an opinion in favour of good quality.
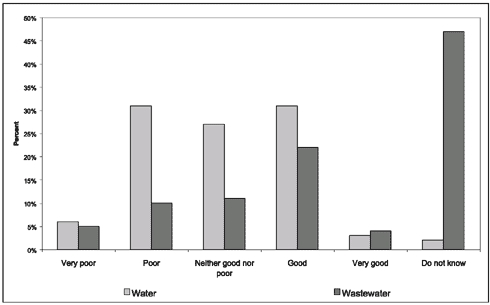
Figure 2.10:
Ranking of the cold tap water quality and wastewater services
Note: Data are weighted by the age and gender distribution of Brno, census 1998.
Half of the respondents did not notice any change in the quality of cold water in the last few years and one-third think that quality has improved. For wastewater, only 16% think that quality has improved and 36% did not notice any change.
One-third of the respondents thinks that the wastewater treatment results in local environment problems and 46% have no opinion. The following table describes the type of environment problems they have in mind.
Table 2.8:
Local environment problems due to wastewater treatment

Note: The table is based on the 31% of the respondents who do think that the current wastewater standard causes problems to the local environment. The data have been weighted
Comparing the Czech standard for wastewater to EU standard, 20% of the respondents think that waste water treatment in the Czech Republic are the same as EU standard, 32% do not know and 43% think that Czech standard is worse than EU standard. Only 7% state that the Czech standard is better than EU standards.
In fact the new instruction of government no. 82/1999 from 22 March 1999 that sets up new acceptable indicators of water quality from Czech wastewater treatment plant is stricter than the current EU standard. The wastewater treatment plant in Brno satisfies all except one of the indicators. So the inhabitants are not aware of the difference between Czech and EU standards, and have a perception that differs from the facts.
The most important reasons for improving wastewater standard are to protect the environment, cf. Figure 2.11.
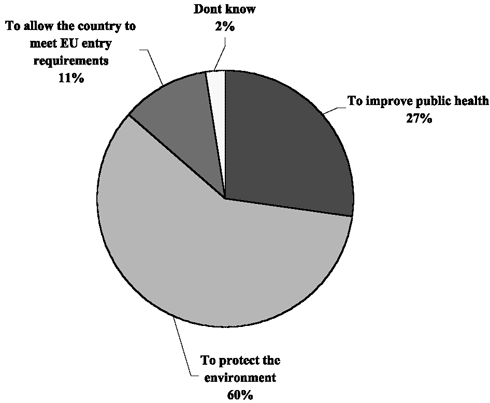
Figure 2.11:
The most important reason for improving wastewater treatment
Note: The data have been weighted.
Attitude towards BVK
Most consumers are aware that BVK is the organisation responsible for the cold water supply and wastewater treatment in Brno. The consumers find that the water company in Brno should be own by the municipal authorities, cf. Table 2.9. Only 13% are in favour of the present ownership, that is a combination of public and private ownership, and domestic and foreign.
Table 2.9:
Who should be responsible for providing cold water?

Note: The data have been weighted.
The perception of BVK's corporate policy is that they are more interested in profits and in servicing consumers. 64% of the consumers think that the BVK cares more about profits than customers and only 4% have the opposite opinion.
Information
A fifth of the consumers do not receive any information about the water services. Another fifth get information from BVK whereas the media such as newspapers, television and radio provides most information.
Table 2.10:
Sources of Information about BVK, or water and wastewater services
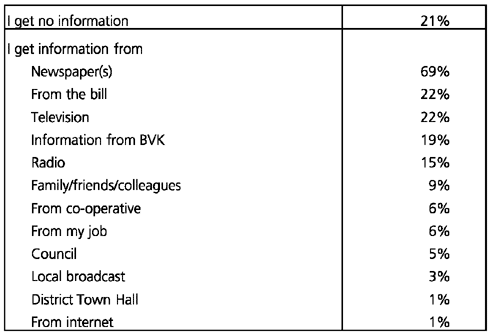
Note: The data do not sum up to 100% as the respondents can refer to more than one source of information. The data have not been weighted
As an example of the information level among the consumers 53% of the respondents know that a new wastewater plant was planned in Brno.
2.4.4 Willingness to pay to improve water and wastewater servicesAlthough consumers are buying a lot of bottled water only 15% are in favour of increasing charges and improving quality and 60% would like to keep the charges and the quality as it is now, cf. Figure 2.12. More consumers are in favour of reducing prices and quality than improving quality and increasing prices.
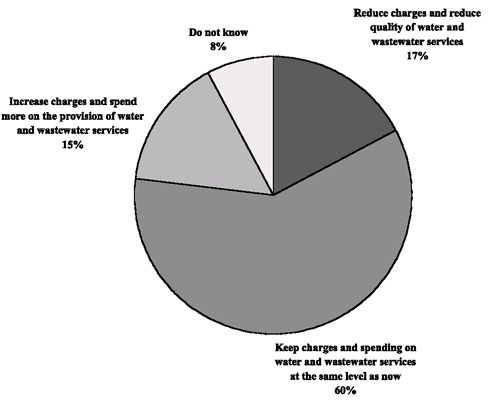
Figure 2.12
Preferred strategy concerning water services and water charges
Note: Data are weighted by the age and gender distribution of Brno, census 1998.
Among the 77% of the respondents who are in keeping or reducing the price levels the reasons are presented in Table 2.11.
Table 2.11:
Reasons for not increasing charges for cold water and wastewater treatment
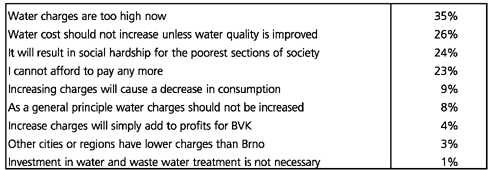
Note: The percentages do not sum up to 100% because respondents were allowed to state more than one reason. The data have been weighted.
The purpose of the stated preference analysis is to find the willingness to pay for improvements of the services. The factors included in the analysis are:
| The quality of the cold water supplied, | |
| The standard of the wastewater treatment, | |
| Wastewater treatment meets EU standard. |
For the quality of the cold water two possible changes suggested to the respondents:
| The water is drinkable but with a chlorine taste, | |
| The water is as good as bottled water. |
According to the results the perception among consumers is that the present water quality is superior to the first change proposed, i.e. water is drinkable and without a chlorine taste. However, the quality is not as good as bottled water. The notion of bottled water is easy to handle for the respondents. It both guarantees quality of taste and healthiness.
For the quality of the wastewater treatment there is only one improvement proposed in the first factor:
| The wastewater treatment means that the surrounding rivers and reservoirs are clean enough for a wide variety of fish and to be able to swim safely |
In order to examine the importance of meeting EU requirements a factor is included where the standard of wastewater treatment either meets or do not meet the EU standard. The change presented to the consumer is:
| Wastewater treatment meets EU standards. |
This factor enables the analysis to identify a willingness to pay for meeting EU-standard that is not due to the improvement in the environment.
The ranking of the factors included in the stated preference analysis is shown in Figure 2.13. The ranking is presented in prioritised order with the most important improvement at the top. The most important improvement is to meet the EU-standard. Half of the consumers find it important to keep the charges as now.
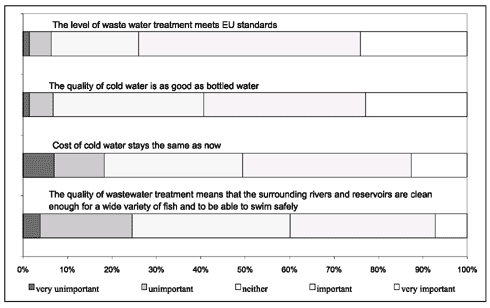
Figure 2.13:
Ranking of the factors included in the stated preference game
Note: The data have been weighted.
There is a willingness to pay for improvements, both for improvements to the water quality and the wastewater treatment. The average willingness to pay is illustrated in Figure 2.14 as extra payment per cubic meter.
On average the consumers are willing to pay about 3 Kc extra per cubic meter to have water as good as bottled water. This indicates that respondents do not find the present tap water quality as good as bottled water.
There is an even greater willingness to pay to avoid "drinkable water with a chlorine taste". The willingness to pay is ca. 11 Kc per cubic meter, which indicates that consumers find the present quality better than that description.
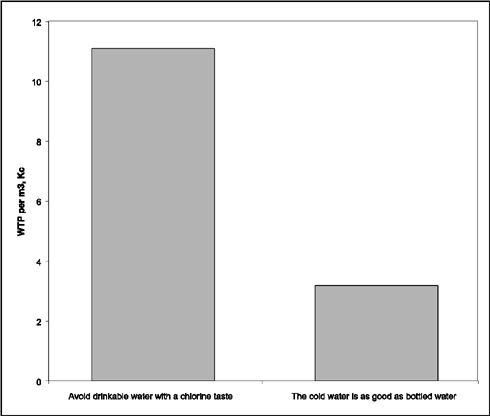
Figure 2.14:
Average willingness to pay to avoid drinkable water with a chlorine taste,
and to have a water quality as good as bottled water
Note: Data are weighted by the age and gender distribution of Brno, census 1998.
Consumers are also willing to pay more to get an improvement in the wastewater treatment. They are willing to pay 6 Kc more if the better wastewater treatment leads to an improvement to the environment.
Hence, a cleaner environment can be used as an argument for increasing water charges.
Also there is a willingness to pay if wastewater treatment meets the EU standards. This indicate both that consumers find it important to meet the standards per se - a majority think that the Czech Republic should join EU - and that the perception is that the EU standard is higher than the Czech standard.
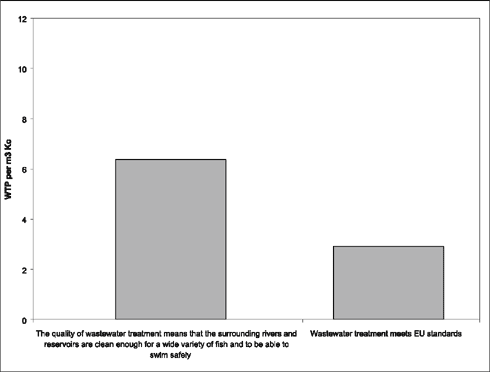
Figure 2.15:
Average willingness to pay to have an improved environment and for meeting EU standard
Note: Data are weighted by the age and gender distribution of Brno, census 1998.
The willingness to pay differs for different socio-economic groups. In general:
| women have a higher willingness to pay than men; | |
| consumers with a low income have a lower willingness to pay than other consumers; and | |
| young consumers are willing to accept a higher increase to get an improved environment. |
The willingness to pay as a percentage of the present charges for various groups is presented in Table 2.12.
Table 2.12:
Willingness to pay per cubic meter
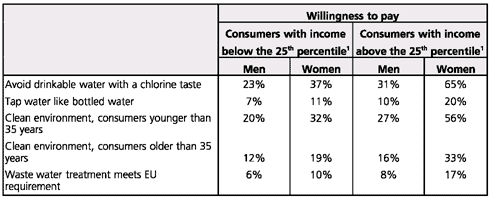
Note: (1) Monthly household income per person. Data are weighted by the aged and gender distribution of Brno, census 1998.
The consumers have been divided into two groups according to the income per person: Consumers having an income lower than the 25th percentile of the sample and consumer having a higher income (4,200 Kc after tax). There is a difference in the willingness to pay for these income groups but a correspondingly higher willingness to pay cannot be found among consumers in the highest 25th percentile.
This result indicates that the water charges are perceived high for the 25% of the population that is less well off economically.
Consumers aged younger than 35 years are willing to pay more in order to have a "clean environment" than older respondents are. This indicates that young consumers will be more willing to accept increases if a cleaner environment can be the result.
Furthermore, it was examined if consumers with a meter installed are willing to accept higher charges than consumers without a meter. The reason for this could be that consumers with a meter are able to adjust water consumption as a reaction to higher charges per cubic meter. However, this hypothesis could not be affirmed and hence installing individual meters does not seem to lead to a higher acceptability of an increase. Finally, it was examined if consumers in favour of EU membership are willing to pay more for the wastewater treatment in order to meet the EU standard than other consumers are. This is not the fact.
2.5 Estimation of price and income elasticitiesIn order to analyse the relation between tariffs, income and water demand, detailed information on these issues is needed, on a household level. Macro-economic data on income, water consumption and tariffs can also be used if a sufficiently long time series is available. However, microeconomic models often give a more precise description of the customers' behaviour.
The price sensitivity can be found by using both revealed preference data (RP) and stated preference data (SP). SP data should be used if good RP data is not available. In Brno some RP date were available. The case study used a combination of RP and SP data to estimate the price (and income) sensitivity of water demand as described below.
No registered data was available on water demand and income in Brno. Therefore, the respondents were asked to bring their water bills for the last three years to the interview. These water bills were used to obtain data on the amount spent on water by each of the households. In cases where the respondents did not have the water bills, the amount was estimated. Furthermore, the respondents were asked to state the changes in their income over the past three years.
Two specific changes in the water tariff were presented to the respondents as SP questions. The respondents were asked to state the expected consumption for each of the tariffs. This was done in order to obtain an assessment of the sensitivity of water demand to changes in price.
For each household in the sample we collected data on the water consumption, tariffs and income for the last three years. The data were collected by asking the respondents to bring their water bills to the interview. Further, we collected SP data by asking the respondents if they would change the amount of water consumed if the tariff was changed by a specific amount. See the table below for an overview of the data collected.
Table 2.13:
Data for calculation of price and income elasticity of water demand

It is assumed that respondents who answer "don't know" to the change of income have had unchanged income. Furthermore, the price changes within the last two years were "estimated" 31% (equivalent to de facto price change) for people who state that they do not know the change and to the perceived price changes for those who do "know" the change.
The sensitivity is measured by elasticities. The price elasticity is defined as:
| the percentage change in water demand in response to a 1% increase in the price per cubic meter. |
This elasticity is assumed to be negative, as the consumption is expected to decrease in response to higher tariffs. Furthermore, it is expected that the elasticity is low, i.e. numerically less that one. This means that the water consumption decreases by less than 1% in response to an increase in the water tariff of 1%.
This is anticipated because water is a necessity that most households would continue to consume even if the tariff increases. A decrease in water consumption can be due to more water efficient installations, changed habits, etc.
The response in water consumption is expected only if the tariff is paid per cubic meter. If, instead, the tariff is paid per household member, the price elasticity of demand is expected to be zero, i.e. no change in water demand as a result of a price change.
The income elasticity is defined as:
| the percentage change in water demand in response to a 1% increase in income. |
The income elasticity is assumed to be positive, as consumers are expected to increase their consumption as they become wealthier. The general income elasticity may change over time and differ among income groups.
In economies with high incomes, most consumers have satiated their demand for water, and a further increase in water consumption is therefore not likely. In this case, the income elasticity is low. On the other hand, in economies where water consumption is a significant item in the household budget, an increase in income is likely to have greater impact on water consumption. In this case, the income elasticity is high.
It is plausible that the income elasticity changes for households with different levels of income. For instance, a poor family might increase its water consumption more than a wealthy family in response to an increase in the family income. This is because the wealthy family has reached a threshold where it uses the amount of water it wishes to use without considering the price.
To benefit from historical data collected in Brno, a model is estimated. To compute the price and income elasticity, it is necessary to know how the respondents will react to an increase in price, other things being equal. Therefore, a demand model including all data collected is estimated.
![]()
The prefix ln indicates that a logarithmic transformation has been made, b is the price elasticity and g is the income elasticity. eit is the unexplained part. The index i is the household, while index t indicates that there are more observations for each household.
The price elasticity is estimated at -0.18, which means that a price increase of 10 per cent results in a 1.8 per cent decrease in water consumption. The income elasticity is estimated at +0.33, which means that an increase of 10 per cent in income results in a 3.3 per cent increase in water consumption.
Hence, the water consumption of the respondents is, quite insensitive to price, but the income elasticity is relatively high. The results show that the households are not likely to reduce their water consumption very much in response to an increase in price, but that they will use more water if their income increases. The low sensitivity to price is expected since households in Brno have already ready reduced their consumption to a level that is similar to that of West European cities with low per capita water consumption.
2.6 ConclusionsThe consumers in Brno are not, in general, dissatisfied with either the cold water quality or the standard of wastewater treatment. However, two thirds of the consumers buy bottled water. More than three-quarters of the interviewed respondents are not willing to pay higher tariffs to improve quality. 17% prefer lower quality of service combined with lower tariffs.
However, the stated preference analysis reveals a willingness to pay for improving the water quality and wastewater standard. The willingness to pay to avoid a worsening of the present water quality is higher than the willingness to pay for an improvement. In particular, this applies to the taste. Also, consumers are willing to pay for better wastewater treatment in order to improve the environment.
The willingness to pay varies between different gender, age, and income groups. Consumers in the low income group are willing to pay less than other consumers, and women are willing to pay more than men are. The group of consumers younger than 35 years are willing to pay more for an improvement of the wastewater treatment leading to a better environment than older consumers are.
The following policy guidelines can be derived from the analysis:
| Environment is an argument for price increases (for wastewater services); | |
| To make wastewater treatment meet the EU demand is a good argument; | |
| Tap water as good as bottled water is also an argument that is appreciated: | |
| Different information approaches for different age groups; | |
| Avoid chlorine taste is very important argument for price increases; and | |
| Metering will not increase WTP. |
Qualitative research
| The in-depth interviews worked well and did provide valuable information about the water services in Brno. |
Quantitative research
| The respondents in the qualitative work reveal somewhat higher willingness to pay than found in the quantitative research. | |
| It is possible to find willingness to pay for environmental improvements, and the connection between wastewater treatment and environment was well understood. | |
| It is possible to estimate elasticities from survey data by collecting the most important determinants for water demand. This includes water consumption, income and number of persons in household. |