|
| Front page | | Contents | | Previous |
Time Series Study of Air Pollution Health Effects in COPSAC Children
Appendix D
Effect of Temperature and Time in GAM Model
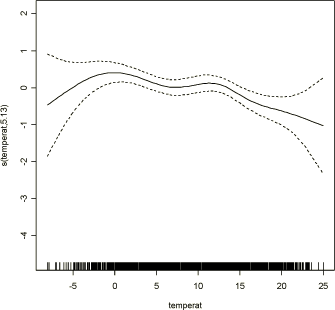
Figure D.1: Temperature effect on Respiratory symptoms modeled with smoothing spline, 5 degres of freedom, GAM model (Section 3.1)

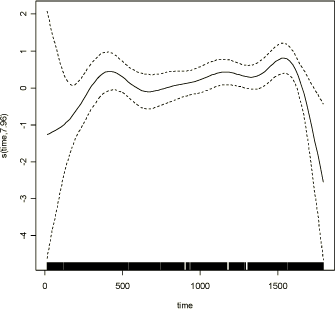
Figure D.2: Effect of real time on the Respiratory symptoms modeled with smoothing spline, 7 degrees of freedom, GAM model (Section 3.1)

| Front page | | Contents | | Previous | | Top |
Version 1.0 Maj 2005, © Danish Environmental Protection Agency
|