|
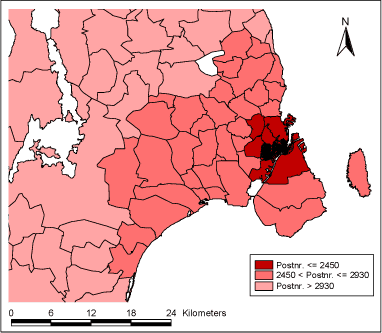
Time Series Study of Air Pollution Health Effects in COPSAC Children 2 Data2.1 The COPSAC Cohort Data for this project include the COPSAC cohort, which provided data on the incidence of respiratory symptoms in small children, air pollution data and meteorological data provided by the Danish National Environmental Institute (DMU), and Influenza epidemics data provided by Staten's Serum Institute (SSI). 2.1 The COPSAC CohortThe COPSAC (COpenhagen Prospective Study on Atopy in Children) cohort was designed to study childhood asthma, eczema and allergy with focus on epidemiological, clinical, cellular and molecular research with consideration to environment and lifestyle factors. COPSAC is unique as it consists of a large group of high-risk children and has long-term continuous data registration. Clinical data are collected prospectively, and biological materials collected into a data bank, which enables par clinical analysis during, before, and after disease development. COPSAC is therefore a unique resource for studying causes and development (course) of asthma, eczema and allergy in children. Details about design of the COPSAC cohort are published elsewhere (Bisgaard, 2004). The COPSAC cohort consists of 411 children genetically predisposed to atopic illnesses (children of mothers with asthma) living in Denmark. COPSAC children were enrolled in the study at birth and followed until 3 years of age. The first child was enrolled in the cohort on 02.08.1998 and the latest on 29.12.2001. Daily registration of airways symptoms via dairies is carried out by parents for all three years. The presence of the registered symptoms (ICD-10 diagnosis R068) is the outcome in this study. R068 diagnosis includes airways symptoms such as wheezing, apnoeic episode, breath-holding attacks, etc. R068 diagnoses were defined by their starting and finishing date. Most children had R068 diagnoses that lasted more than one day. For this project, data on incidence of respiratory disease in COPSAC children up to 18 months of age are available. Due to study design where air pollution data are available from a single measuring station located in the centre of Copenhagen (HCØ Institute), three populations of COPSAC children were created according to their home vicinity to the HCØ. By this design it is assumed that air pollution exposure from central monitoring station is most representative exposure for children living in the centre of the city defined by postal code 2450. This, Population 1, is thus the primary study population. Further, Populations 2 and 3 are created, representing those who live in Copenhagen suburbs (2450 < and 2930) and those living in rest of Sealand (2930 < and 5000), as illustrated in Figure 2.1.1. These three populations allow us to study a geographical gradient of centrally measured air pollution's effect on the development of respiratory symptoms in small children, with a hypothesis that this exposure has strongest effect on children living in the centre of the city and this effect gradually diminishing further away from the Copenhagen city centre into the rural areas of Sealand. Geographical distribution of COPSAC children and definition of three populations according to children's' home address postal code can be seen in Table 2.1.1 below. A number of children changed their home address during the first 18 months of life, due to which those children fall into two or all three populations at the different relevant time periods, and the totals do not add up to 411. Table 2.1.1: Definition of study populations according to postal code of COPSAC children's home address
Figure 2.1.1: Postal code area definition of the three study populations
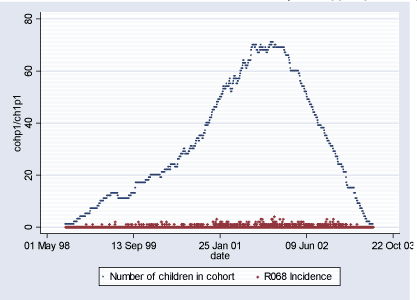
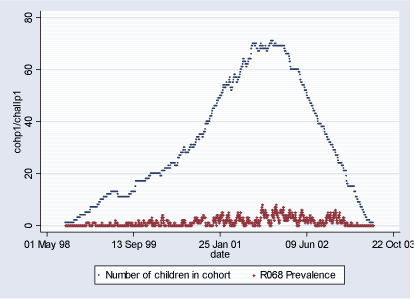
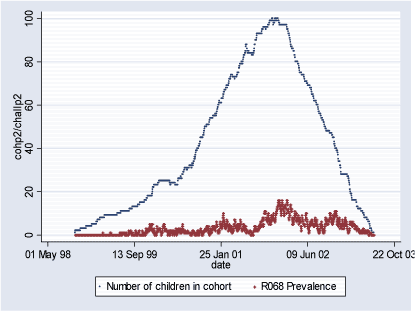
Population 1 consists of 115 children who during some of or the whole period of their first 18 months of life lived in Inner City of Copenhagen (postal code 2450). The follow-up period starts with the earliest child's birthrate 16.08.1998 and ends with the latest 18-month follow-up date on 29.06.2003 totaling in 1.779 days. During this period total of 346 new (incident) cases of R068 diagnoses were observed and 2.332 total (prevalent) cases. Table 2.1.2 and Figures 2.1.2 and 2.1.3 below describe Population 1. Table 2.1.2: Population 1 - Definition of the outcome
Figure 2.1.2: Daily count of incident cases and number of children in COPSAC Cohort in Population 1 during study period (16.08.1998-29.06.2003)
Figure 2.1.3: Daily count of prevalent cases and number of children in COPSAC Cohort in Population 1 during study period (16.08.1998-29.06.2003)
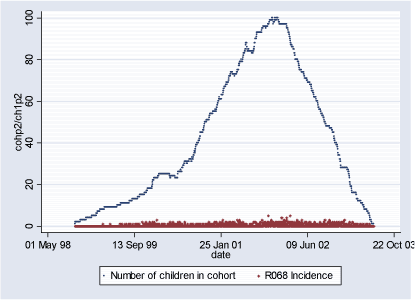
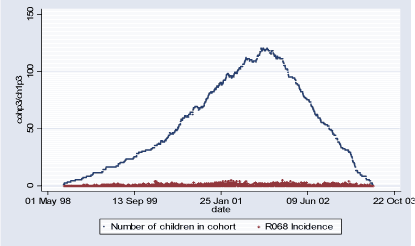
Population 2 consists of 134 children who during some of or the whole period of their first 18 months of life lived in the suburbs of Copenhagen (2450 < postal code 2930). The follow-up period starts with the earliest child's birthrate 06.10.1998 and ends with the latest 18-month follow-up date on 28.06.2003 totaling in 1.727 days. During this period total of 691 new (incident) cases of R068 diagnoses were observed and 5.663 total (prevalent) cases. Table 2.1.3 and Figures 2.1.4 and 2.1.5 describe Population 2. Table 2.1.3: Population 2 - Definition of the outcome
Figure 2.1.4: Daily count of incident cases and number of children in COPSAC Cohort in Population 2 during study period (06.10.1998-28.06.2003)
Figure 2.1.5: Daily count of prevalent cases and number of children in COPSAC Cohort in Population 1 during study period (06.10.1998-28.06.2003)
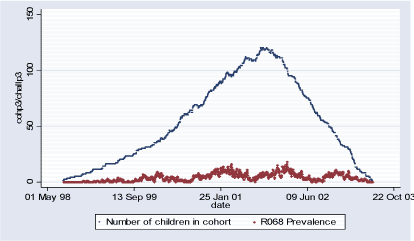
Population 3 consists of 186 children who during some of or the whole period of their first 18 months of life lived in the rest of Sealand (2930 < postal code 5000). The follow-up period starts with the earliest child's birthrate 02.08.1998 and ends with the latest 18 month follow-up date on 22.06.2003 totaling in 1.786 days. During this period total of 914 new (incident) cases of R068 diagnoses were observed and 7.098 total (prevalent) cases. Table 2.1.4 and Figures 2.1.6 and 2.1.7 describe Population 3. Table 2.1.4: Population 3 – Definition of the outcome
Figure 2.1.5: Daily count of incident cases and number of children in COPSAC Cohort in Population 3 during study period (02.08.1998-22.06.2003)
Figure 2.1.6: Daily count of prevalent cases and number of children in COPSAC Cohort in Population 3 during study period (02.08.1998-22.06.2003)
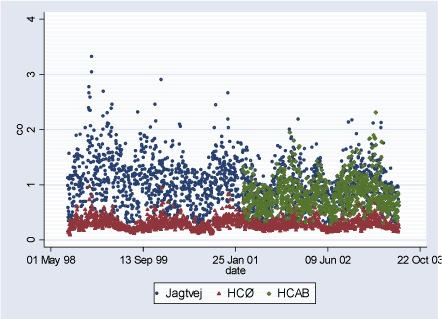
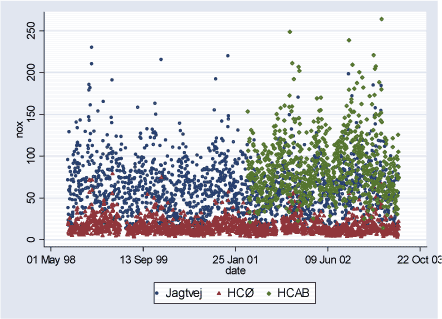
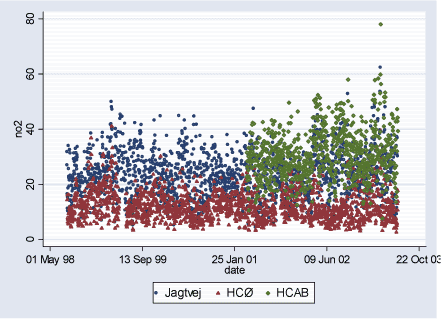
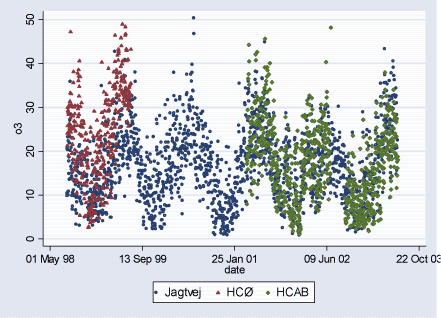
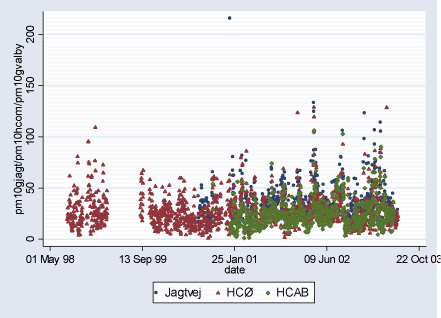
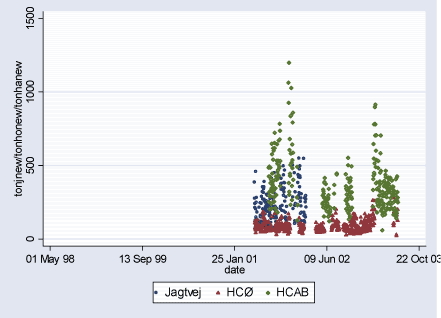
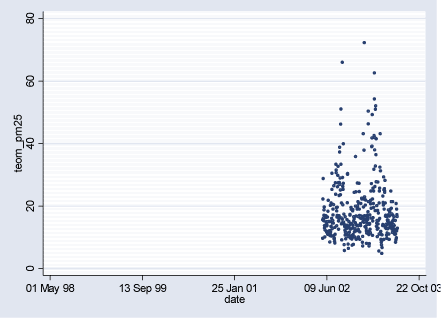
2.2 Air PollutantsAir pollutant data are available as daily averages of air pollutant levels from following measuring stations in Copenhagen: HCØ Institute (city background pollution levels), Jagtvej and H.C.Andersen's Boulevard (HCAB) (street level pollution levels). From all measuring stations measurements are available for the following pollutants: CO (ppm), NOx (ppb), NO2 (ppb), O3 (ppb), PM10 (g/m³), and TON (part./m³). PM10 at street level measuring stations Jagtvej and HCAB was measured by SM200 gravimetric method. PM10 city background level variable (HCØ) is combined with PM10 measurements from HCØ (SM200 gravimetric method) and values extrapolated from PM10 measurements at Jagtvej (beta method), corrected for traffic contribution using NOx measurements from HCØ and Jegtvej and the ratio 0.144*(PM10 /NOx). The extrapolation of PM10 values was done for the study periods where HCØ measurements were missing, to obtain more complete variable. Furthermore, PM2.5 (µg/m³) measurements are available from HCAB measuring station, and PM10 (g/m³) measurements (SM200 gravimetric method) from Lille Valby (rural Zealand pollution levels). Three high PM10 values measured at HCØ were excluded (176.6 g/m³ on 01.01.2000, 248.5 g/m³ on 01.01.2001, and 283.7 g/m³ on 10.08.2000). Furthermore, a PM10 value of 215.5 g/m³ measured at Jagtvej on 01.01.2001 was excluded. Description of air pollutants can be seen in Table 2.2.1 below, and Figures 2.2.1-2.2.7. Pearson correlation coefficients between pollutants measured at the same station can be seen in Tables A.1 - A.3 in Appendix A. Table 2.2.1: Air pollutant levels during study period
Figure 2.2.1: CO (ppm) daily levels during study period (02.08.1998-29.06.2003)
Figure 2.2.2: NOx (ppb) daily levels during study period (02.08.1998-29.06.2003)
Figure 2.2.3: NO2 (ppb) daily levels during study period (02.08.1998-29.06.2003)
Figure 2.2.4: O3 (ppb) daily levels during study period (02.08.1998-29.06.2003)
Figure 2.2.5: PM10 (g/m³) daily levels during study period (02.08.1998-29.06.2003)
Figure 2.2.6: TON(part./m³)/100 daily levels during study period (02.08.1998-29.06.2003)
Figure 2.2.7: PM2.5 (g/m³) daily levels measured at HCAB during study period (02.08.1998-29.06.2003)
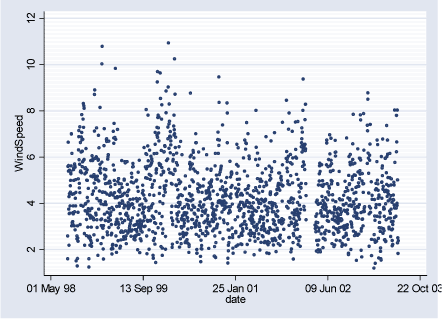
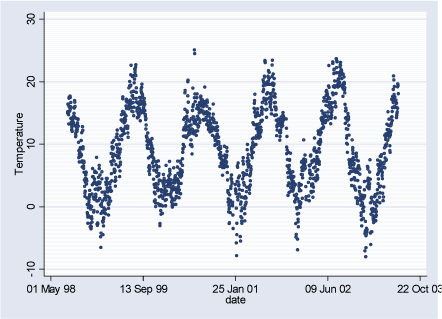
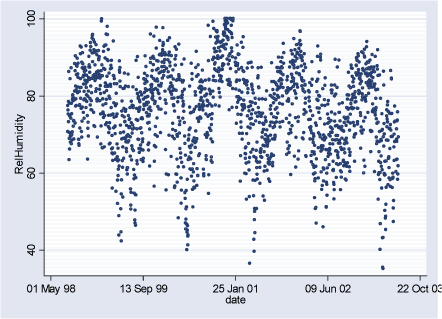
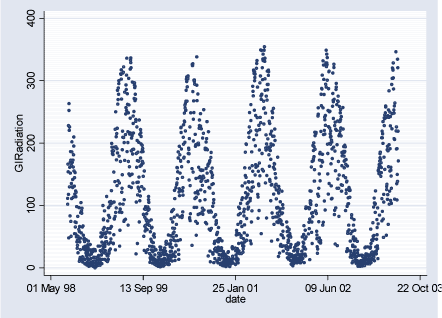
2.3 Meteorological DataMeteorological data are available as daily hour averages measured at HCØ and include: wind speed (m/s), temperature (C), relative humidity (%), and global radiation (W/m²). Description of meteorological data can be seen in the Table 2.3.1 and Figures 2.3.1 – 2.3.4 below. Pearson correlation coefficients between meteorological variables can be seen in Table 2.3.2. Pearson correlation coefficients between air pollutants measured at HCØ and weather variables can be seen in Table A.4 in Appendix A. Gennemsnit m.h.t. vindhastighed, temp og fugtighed er vel uinteressant, her er fx kvartiler vel mere beskrivende. Table 2.3.1: Meteorological data level during study period
Figure 2.3.1: Wind Speed daily averages during the study period (02.08.1998-29.06.2003)
Figure 2.3.2: Temperature daily averages during the study period (02.08.1998-29.06.2003)
Figure 2.3.3: Relative Humidity daily averages during the study period (02.08.1998-29.06.2003)
Figure 2.3.4: Global Radiation daily averages during the study period
Table 2.3.2: Correlation of meteorological variables during the study period in Copenhagen (02.08.1998 - 29.06.2003)
* p < 0.01 - significance level for the Pearson correlation coefficients In the Table 2.3.2 above it can be seen that there is statistically significant positive association between wind speed and relative humidity, and temperature and global radiation. There is negative and statistically significant correlation between wind speed and temperature, wind speed and global radiation, temperature and relative humidity and global radiation and relative humidity. This table shows that all meteroloigcal variables are mutually correlated, which implies that fitting them in the model together could cause some colinearity. Therefore, we chose only temperature in the final model, as the strongest predictor of the incident respiratory cases in small children.
|
||||||||||||||||||||||||||||||||||||||||||||||||||||||||||||||||||||||||||||||||||||||||||||||||||||||||||||||||||||||||||||||||||||||||||||||||||||||||||||||||||||||||||||||||||||||||||||||||||||||||||||||||||||||||||||||||
