Establishment of a basis for administrative use of PestSurf

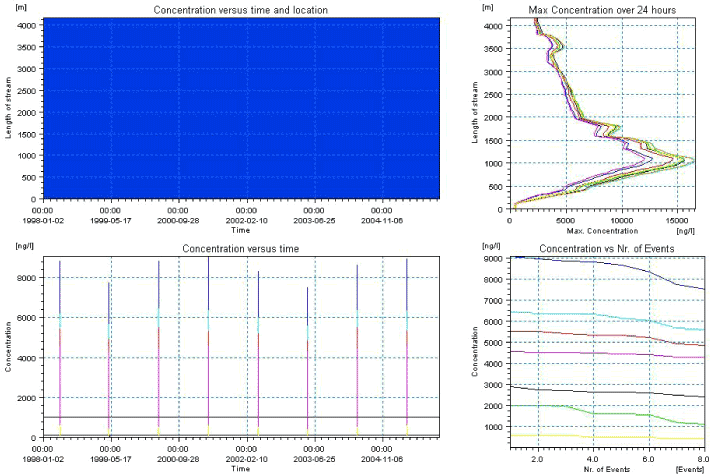
Figure 6.6. Overview for metamitron in the sandy catchment generated by the PestSurf excel template. The max concentrations generated over the 24 hours are similar to the overview in Figure 6.2. The graph to the lower right shows how many events have concentrations higher than a given value for the selected monitoring points. Detection value was set to 10 ng/l.
Figur 6.6. Oversigt for metamitron i det sandede opland genereret med PestSurf-excel-skabelonen. Den maximale koncentration genereret over 24 timer svarer til oversigten i Figur 6.2. Grafen nederst til højre viser hvor mange hændelser, der har koncentrationer højere end en given værdi i et udvalgt punkt. Detektionsgrænsen var sat til 10 ng/l.
Version 1.0 December 2006, © Danish Environmental Protection Agency