Establishment of a basis for administrative use of PestSurf

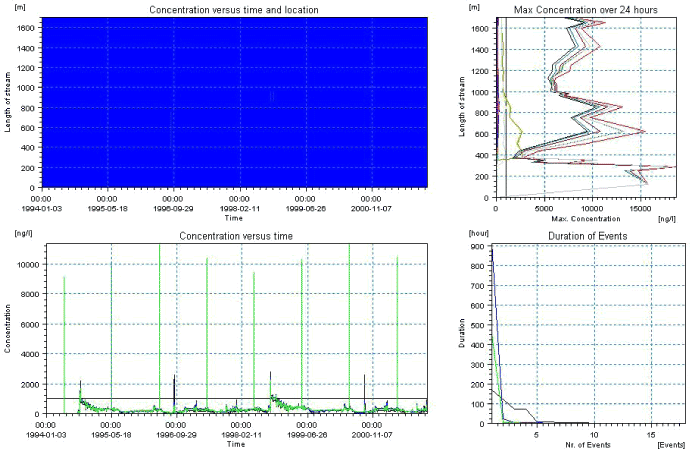
Figure 11.27. Overview for terbutylazin in the sandy loam catchment generated by the PestSurf excel template for the upstream part of the catchment. The detection value for the graph to the lower right was set to 1000 ng/l. The figure to the lower right differs from Figure 11.26.
Figur 11.27. Oversigt for terbutylazin genereret med PestSurf-excel-skabelonen for den opstrøms del af morænelersoplandet. Detektionsgrænsen for grafen nederst til højre er sat til var sat til 1000 ng/l. Figuren nederst til højre er forskellig fra figur Figur 11.26.
Version 1.0 December 2006, © Danish Environmental Protection Agency