Establishment of a basis for administrative use of PestSurf

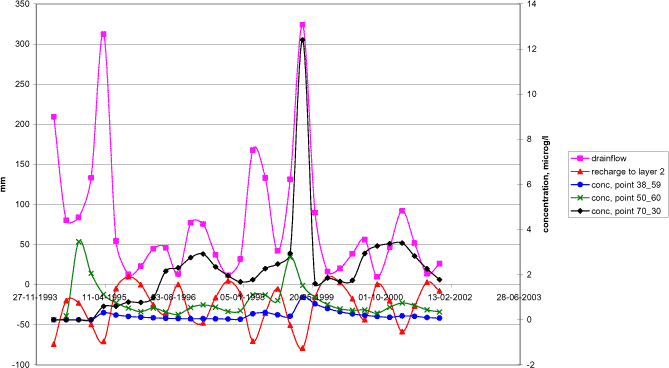
Figure 4.56. Comparison between the flow components and the concentration levels in three points for the spring-applied bentazon. The three concentration curves show a maximum during the drainage period of the winter 1998-1999.
Figur 4.56. Sammenligning mellem strømningskomponenter og koncentrationsniveau I tre punkter for forårsudbragt bentazon. De tre koncentrationskurver viser et maximum i drænperioden i vinteren 1998-99.
Version 1.0 December 2006, © Danish Environmental Protection Agency