Establishment of a basis for administrative use of PestSurf
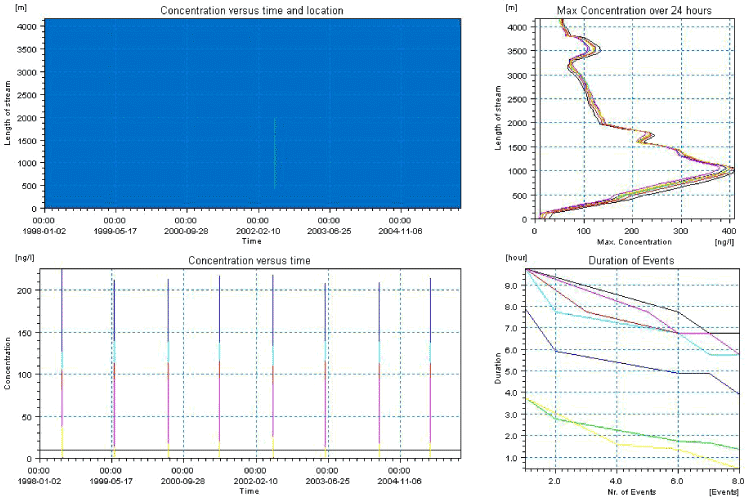
Figure 1.9. Same as Figure 1.8, but with a limiting value of 10 ng/l. The graph to the lower right shows how many events (above 10 ng/l) have a duration longer than the value on the Y-axis for the selected monitoring points.
Figur 1.9. Mage til figure Figur 1.8, men med en begrænsende værdi på 10 ng/l. Grafen nederst til højre viser hvor mange hændelser (over 10 ng/l) med længere varighed end værdien på Y-aksen, der er for udvalgte lokaliteter.
Version 1.0 December 2006, © Danish Environmental Protection Agency