[Forside] [Indhold] [Forrige] [Næste] [Bund]
Denmark´s Second National Communication on Climate Change
3.1 National circumstances for Denmark
The Kingdom of Denmark comprises Denmark, Greenland and the Faroe Islands. The Danish government has ratified the UN Framework Convention on Climate Change on behalf of all three parts og the realm. Unless otherwise indicated, the tables, figures, policies and measures etc. presented in this report only relate to Denmark, though.
3.1.1 Population and total area
The population of Denmark amounts to nearly 5.2 million inhabitants and the total area to 43,000 km2.
Low population increase
In the 1970s and the 1980s the annual population increase was very low, averaging 0.39% and 0.03% respectively.
| Year | 1970 | 1975 | 1980 | 1985 | 1990 | 1993 | 1995 |
| Population in million. | 4.9 | 5.1 | 5.1 | 5.1 | 5.1 | 5.2 | 5.2 |
Table 3.1. Population 1970 - 95.
Projections
The latest projections, based on the population for 1 January 1995, indicate very small annual increases until 2008 and thereafter very small decreases.
Ageing population
Like other developed countries, Denmark has an ageing population. The number of women of 67 years and older is considerably higher than the number of men in the same age group due to the greater life expectancy of Danish women.
Some 85% of the population inhabits urban areas, i.e. towns of 200 or more inhabitants. The population of the Copenhagen metropolitan area amounts to 26% corresponding to 1.3 million.
3.1.2 Geography and land use
Land use
Of the total Danish area, 64% is agricultural land, 10% is forest and 10% is natural areas such as moors, marsh, bogs, lakes and streams. The Danish lakes comprise less than 1% of the total area and the largest lake is 39 km2. The total length of watercourses is 40,000 km and the longest watercourse stream is 158 km. The built-up areas (urban areas, summer residence areas, traffic infrastructure etc. ) occupy about 15%. 4.3% of the total land area is preserved and 10% of the metropolitan region.
The coastline
The Danish coastline stretches for 7,330 km. The coast is mainly made of "soft" materials deposited during the last ice age and are therefore easily formed by waves and currents. The coastline is consequently subject to erosion and at various locations protected by constructions such as groynes and/or revetments.
Approx. 500 km of the coastline is protected by dykes. Some of the dykes protect human settlement areas and some merely flood-endangered green areas such as farmland or areas of recreational value. The dykes along the Wadden Sea coast in southwest Jutland protect the rich farmlands of the marshes and the marshland settlements from the frequently occurring storm floods. In other parts of the country, mainly on the island part of Denmark, dykes protect areas reclaimed by embankment and drainage and which are partly located below sealevel.
Dykes, breakwaters and revetments are designed to withstand the normal range of storm tides. In the most exposed areas, the fortifications are designed for a sea level statistically occurring once in 200 years while in less exposed areas they are designed for a once in 50 years situation. A rise in sea level caused by climate change will therefore diminish the capability of these constructions to withstand the sea during storm tides.
Agriculture
During the last 30 years, the agricultural area has diminished from 72% (30,900 km2) of the total area in 1960 to 63% (27,300 km2) in 1992. The crop patterns for the last 25 years are given in Table 3.2.
| 1970 | 1980 | 1985 | 1990 | 1992 | 1995 | |
| Cereals | 59 | 62 | 56 | 56 | 59 | 53 |
| Pulses and seeds for industrial use | 2 | 4 | 12 | 14 | 11 | 8 |
| Root crops | 10 | 8 | 8 | 8 | 7 | 6 |
| Grass and green fodder in rotations | 17 | 14 | 13 | 12 | 13 | 15 |
| Permanent grassland | 10 | 9 | 8 | 8 | 8 | 15 |
| Other crops incl. fallow | 2 | 3 | 3 | 2 | 2 | 3 |
Table 3.2. Distribution of agricultural area by crop type, in percent of total cultivated land.
Declining areas with grass
The proportion of agricultural land with grass and green fodder in rotation as well as with permanent grass has declined considerably since the 1950s.
The consumption of nitrogen has grown considerably during the last 30 years, especially during the first part of the period, and is now 3½ times greater than in 1960. However, the consumption of nitrogen in commercial fertiliser decreased by 25% from 1990 to 1996. The growth in consumption of nitrogen is due to a change in agricultural practice which has resulted in higher crop production. The consumption of phosphorus has declined since 1970 as has the consumption of potassium. During the last three years, the use of fertiliser has fallen, as mentioned in Chapter 4.
Livestock
The number of cattle declined by more than 25% from 1970 to 1995, whereas the number of pigs has grown by 1/3 in the same period. The number of poultry declined until 1985, but has now grown to nearly the same level as in 1970.
Forest areas
As mentioned above, 10% or 4,170 km2 of Denmark's total area is forest (1990), of which 1/3 consists of broadleaf and 2/3 of conifers. In the eastern part of the country broadleaf is predominant (61% of the wooded area), while in the western part, Jutland, conifers dominate(77%). During the last 70 years the forest area in Denmark has increased by 30%, exclusively with conifers. 350 km2 is considered to be natural forest by origin.
3.1.3 Climate
The Danish climate is mildly temperate with precipitation falling throughout the year.
Temperature
Winters are prevailingly mild and summers cool. The annual mean temperature is 7.7° C, ranging from 7° C to 9° C. January mean temperatures range from -1° C to +2° C and July mean temperatures from 15° C to 17° C.
The number of heating degree days for the country as a whole is 3175 (base: 17° C), ranging from 2975 to 3375 over the country.
On the whole, annual average temperature decreased slightly (0.1°C) from the period 1931 - 60 to the period 1961 - 90. In particular, it has become colder in the summer months of July and August, but also in early winter in December. It has become somewhat warmer in the last part of the winter in February and March, and also in October.
Precipitation
The annual precipitation in Denmark is 712 mm, ranging from 500 to 900 mm over the country. November has the largest amount of precipitation with 80 mm, while February is the driest month with less than 40 mm.
For the year as a whole, the precipitation has increased more than 5% from the period 1931 - 60 to the period 1961 - 90. In particular, the increase has taken place in the spring and early winter, while the precipitation has reduced in the summer months proper.
Hours of sunshine
The normal hours of bright sunshine is 1,670 for the whole year. The number of clear days (cloud cover less than 20% ) is 31, and the mean cloud cover is 67%.
The number of hours with sunshine has decreased by approx. 5% from the period 1931 - 60 to the period 1961 - 90. In absolute terms as well as in percentage, the decrease is most pronounced in spring and early summer, June - July, and in September. November and December received more than 25% more sunshine than before, however.
Wind
The normal annual mean wind velocity is 6.6 m per sec, and the winds are normally from westerly directions.
The frequency of hurricane force storms (only related to mean wind speed exceeding 25 m per sec) covering more than 40% of the country over a hundred year period is on average one in every four years.
3.1.4 Gross Domestic Product
High per capita income
The Danish Gross Domestic Product amounted to USD 172,741 million (in 1995 current market prices), corresponding to a per capita income of USD 33,042, giving Denmark one of the highest per capita incomes in the world (USD 1 corresponds to DKK 5.61 in 1995).
Agriculture, forestry and fishery accounts for 3.8% of the total GDP, manufacturing 20.1% and services, including Government services, 69.4%.
| DKK, million | USD, million | % | |||||||||||||||||
|
|
||||||||||||||||||
| Manufacturing, total |
|
||||||||||||||||||
|
|
||||||||||||||||||
| Gross Domestic Product, total |
|
||||||||||||||||||
Table 3.3. Gross Domestic Product at factor cost, apportioned by origin, 1995.
The development since 1970 has been an increase in total GDP (1980 prices) of 68% whereas agriculture has increased by 111%, manufacturing by 60% and services by 75%.
|
|||||||||||||||||||||||||||
|
|
||||||||||||||||||||||||||
| Total | 100 | 112 | 130 | 147 | 162 | 168 | |||||||||||||||||||||
Table 3.4. Gross Domestic Product at factor cost, apportioned by industrial origin. 1980 prices. Index 1970 = 100.
Employment
In 1994 the total active population was 2,471,000, of which 121,000 were employed in agriculture, forestry and fishery, 477,000 in manufacturing and 1,693,000 in services.
|
|||||||||||||||||||||||||||||
|
|
||||||||||||||||||||||||||||
| Total |
|
Table 3.5. Distribution of employment by industrial origin, unit 1,000 persons.
3.2 Energy
3.2.1 Available energy resources, kind and level
Oil and natural gas
Denmark's main indigenous resources of energy, apart from renewables, are the North Sea oil and natural gas fields.
The assessment of reserves shown in Fig. 3.1 refers to the amount of oil and gas that can be recovered by means of known technology under the prevailing economic conditions. This assessment only includes reserves in structures where the presence of hydrocarbons has been conclusively established through drilling and testing.
Oil production in 1996 amounted to 12 million m3 which represents a 10% increase compared to 1995. Gas production increased 21% in 1996 to a level of approx. 6,100 million Nm3.
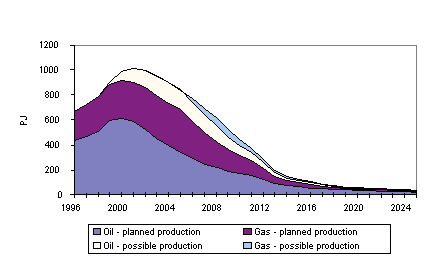
Fig. 3.1. Prognosis for oil and gas production from the Danish North Sea fields with the actual production in 1996.
The combined reserves presently corresponds to 15 times the current domestic primary energy demand, 25 times the current domestic oil and gas demand and about 1.3 ‰ of the world's total reserves of oil and gas (not including nonconventional reserves in oil sand, tar sand etc.).
About one third of the gas presently extracted is exported, mainly to Sweden and Germany.
According to the latest short-term prognosis, oil and gas production will continue to increase in the near-term, but will decline after the turn of the century if no new fields are discovered.
The growth of oil and gas production combined with the decrease in oil demand, has made Denmark a net exporter of both oil and gas since 1993.
Renewables
With the present known reserves of oil and natural gas, energy from renewable sources will be Denmark's main energy resource in a 15 - 20 year time span. Estimates indicate a potential of approx. 540 PJ per year (Denmarks Energy Futures, Ministry of Environment and Energy 1996).
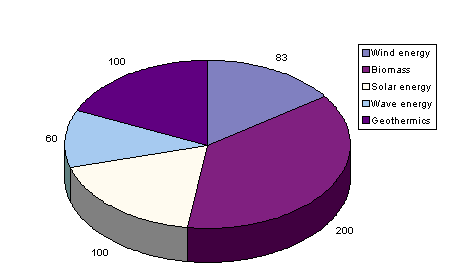
Fig. 3.2. Potential energy resources from renewables in Denmark.Unit: PJ per year.
Renewable energy resources are shown apportioned by source in Fig. 3.2. By far the main resource is biomass, including energy crops and residual products of agriculture, forestry, industry and households. Accounting for 57 PJ per year, biomass is also the main renewable resource utilized at present.
The potential for wind energy comprises both terrestrial and off-shore wind turbines. Although present exploitation of the vast potential for offshore wind turbines is still limited, technical obstacles for their exploitation have largely been overcome. The Danish Energy Agency has already received formal applications for approx. 4000 MW wind power capacity sited offshore, which installed would cover more than one third of present electricity consumption.
The three remaining resources - geothermal, solar and wave energy - are presently the least exploited resources. Danish energy policy aims at stimulating the technological and economical preconditions for further exploitation of these resources, however.
3.2.2 Energy supply and consumption
The general picture
Primary energy consumption increased rapidly in the 1960s, but essentially stabilised at a level of 800 PJ (values excluding international bunkers corrected for electricity exchange and outside temperature variations) from 1972 to 1995 as a result of the two oil crises and implementation of rigorous energy policy instruments during the last 20 years (Fig. 3.3).
There are several structural changes to note in relation to the past 20 years development.
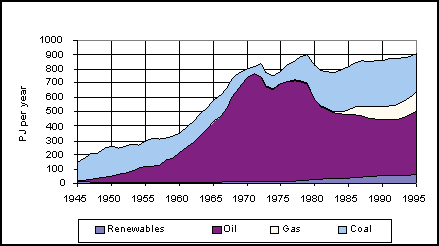
Fig. 3.3. Total primary energy consumption including international bunkers.
Note: Not corrected for electricity exchange and inter-annual variations in outside temperature.
Coal substituted for oil
As a result of the oil crises, oil was substituted by coal at the power and heat plants.
All coal used in Denmark is imported, and 94% is used in power plants. The import of roughly 13 million tonnes coal constitutes a relatively large share of internationally traded steam coal, as most coal in the world is used in the producing countries. Due to excellent harbour facilities coal can be imported on very large bulk carriers (150,000 tonnes) directly to the major plant sites. The sources change from year to year, but major sources have been the United States, Columbia and Australia, with other supplies coming from the UK, Poland, the former USSR, Canada and South Africa.
The decline in the use of oil is also due to changes in the supply system and consumption pattern in all sectors.
Natural gas
The introduction of natural gas from domestic sources around the mid 1980s has resulted in a significant increase in the use of natural gas. In 1995, almost 16% of primary energy consumption derived from natural gas.
Natural gas is utilised in individual heating as well as in the heat and power sector.
Renewable energy
Renewable energy sources account for an increasing share of the total primary energy supply and consumption, amounting to about 8% in 1995.
Since the mid 1980s biogas and wind energy have evolved substantially. Municipal waste,
forest and wood residuals and surplus straw still account for 85% of the total renewable
energy supply, however.
Fig. 3.4. Contribution of renewable energy sources in primary energy consumption.
Wind energy accounts for presently about 4% of final domestic electricity consumption
(Fig. 3.5).
Fig. 3.5. Contribution of wind energy to net electricity production.
Electricity and heat sector
District heating has a long tradition in Denmark. Following the oil crises, many district heating plants as well as power plants converted to coal. The flexibility of district heating has subsequently been used to make an almost complete switch away from coal to renewables and especially natural gas, except for the large cities supplied by large co-generated heat and power plants which are still coal fired. Present plans, however, foresee a gradual change to natural gas and renewables also at these plants, in step with replacement of capacity.
Since the mid 1980s focus has increased on the environmental and efficiency gains of co-production of heat and power. The development of the power sector and especially the heat sector is also closely tied to the priority accorded natural gas and renewables in the Danish energy policy.
District heat production currently accounts for close on 50% of energy demand for space heating compared with 30% in 1972. 70% of the district heating production is now based on combined heat and power plants.
When electricity is produced at a typical condensing power plant, only 35 - 40% of the fuel input is utilized, while the remaining energy input is turned into waste heat. By augmenting the fuel input slightly, it is possible to produce district heat instead of waste heat. Typically, more than 2 GJ of district heat can be produced each time the fuel input is augmented by 1 GJ. Thus, the "marginal efficiency" of producing district heat instead of waste heat is more than 200%.
The improvement in the total thermal efficiency of Danish power plants due to the supply of district heating instead of producing waste heat to the environment is illustrated in Fig 3.6.
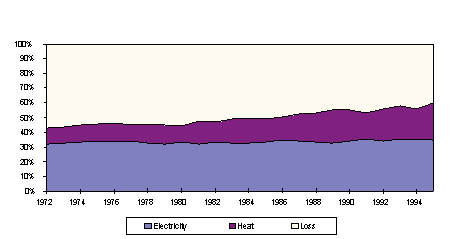
Fig. 3.6. Efficiency at Central Power Plants as output in percent of fuel used.
End-use efficiency
Efficiency gains in end-use and conversion systems, have played an important role in stabilising primary energy consumption.
As an example, Fig. 3.7 shows that final energy for heating (energy supplied to the buildings for heating purpose) per square meter of building area has more than halved from 1972 to 1995. Strict standards for new buildings and extensive insulation improvements in the existing stock of buildings as well as the increased use of district heating are the main explanations for this marked improvement.
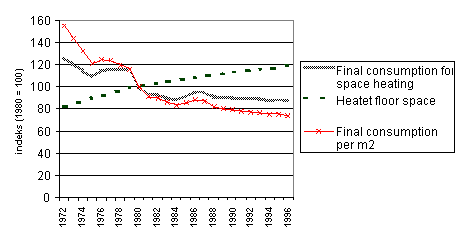
Fig. 3.7. Final energy consumption for space heating, climate adjusted, 1972 - 95.
Final energy consumption
Denmark has a relatively mild marine climate, an extensive public service sector and an industrial system dominated by light industries and manufacturing of food products. This combines to give a spectrum of final energy consumption that compared with other industrialised countries is characterized by a relatively large share going to space heating and services, and a relatively small share going to industry.
Final energy consumption shows the same pattern of stabilisation since 1972 as primary energy consumption, remaining at a level of approx. 600 PJ per year.
The development in final energy consumption apportioned by energy type is shown in Fig.
3.8. The shift away from oil in primary energy recurs in final energy consumption. Besides
natural gas and renewable energy, final energy consumption has shifted towards the
secondary energy types, electricity and district heating. The percentage accounted for by
electricity more than doubled to 26% in 1995. In recent years, however, electricity
consumption has shown signs of decreasing growth.
Fig. 3.8. Final energy consumption apportioned by energy type.
Note: Oil products related to transportation and non-energy use are not included.
The practically constant final energy consumption conceals interesting shifts in the sectoral composition as illustrated in Fig. 3.9.
Overall, the sectoral composition of final energy consumption shows a decrease in the residential sector and an equivalent increase in the transport sector.
The above mentioned improvements in energy consumption for heating purposes are reflected in Fig. 3.9. Besides the residential sector, heating purposes account for a large share of total energy consumption in the institutional and commercial sectors. However, increased energy consumption of primarily electricity in these two sectors has - in contrast to the residential sector - neutralised the improvements in heating.
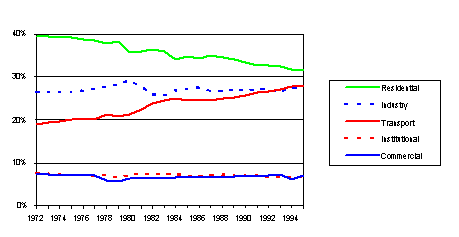
Fig. 3.9. Final energy consumption apportioned by sector.
3.2.3 Energy intensity and average CO2 content
Energy intensity
As shown in Fig. 3.10, primary energy consumption per capita stabilised during the period, and energy intensity (primary energy consumption per GDP) markedly decreased.
Fig. 3.10. Primary energy consumption per capita and per unit GDP.
CO2 content of the fuel mix
The CO2 content of the fuel mix increased until the mid 1980s, mainly due to the increasing share of coal (Fig. 3.11).
Thereafter the trend has reversed, actually with an accelerating tendency in recent years.
Increased efficiency in the conversion sector as well as the increased use of natural
gas and renewables are primary contributory causes to this decreasing trend. 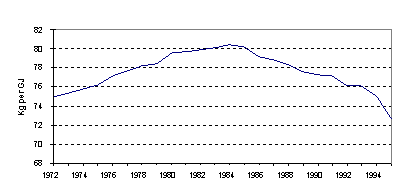
Fig. 3.11. CO2 content of the fuel mix.
Note: Oil products related to transportation and non-energy use are not included.
3.2.4 Transport
CO2 and energy consumption
In 1995, the energy consumption for national transportation amounted to 163 PJ. In 1980 the figure was 121 PJ. These amounts, however, include a considerable contribution from off-roaders such as agricultural and construction equipment etc., the energy consumption of which cannot in present statistics be distinguished from energy consumed in the transport sector proper.
The 35% increase in energy consumption in the transport sector in the period is above the average consumption growth in other sectors. This means that the transport sector's share of the total energy consumption has grown from approx. 15% to well over 20%.
Also worth noting is that energy consumption for other purposes is based increasingly on natural gas and renewable energy sources, whereas consumption in the transport sector is based almost exclusively on oil. Thus, the transport sector's share of the total oil consumption has increased markedly.
Transport capacity increase
In Denmark the number of passenger cars increased 55% from l970 to 1995. At the same time, there has been an increase in individual passenger transport of 84% from 33,400 million person-km to 61,500 million person-km. Goods transport by road has increased by 40% from 7,800 million tonnes-km in 1970 to 10,900 million tonnes-km in 1995. Vans have changed fuel from petrol to diesel and there has been an increase both in the number of passenger cars and in the number of vans and lorries using diesel.
|
||||||||||||||||||||||||||||||||||||
|
|
|||||||||||||||||||||||||||||||||||
|
|
Table 3.6. Passenger transport by mode of transport. Unit: Thousand million person-km.
|
|||||||||||||||||||||||||||||
|
|
||||||||||||||||||||||||||||
| Total |
|
Table 3.7. Goods transport by mode of transport. Unit: Thousand million tonnes-km.
Note: Goods transportation by air is a minor form of goods transportation.
3.3 National circumstances for Greenland
Greenland is a geographically separate part of the Danish realm covering an area of 2,175,600 km2. Of this, the ice cap covers 1,700,000 km2. The population mainly consists of an indigenous people (1995: 48,600 inhabitants ) with language and culture distinct from that of the Danes. The total population is 55,800.
The Danish Constitution applies to all parts of the Danish realm. Since 1953, Greenland has been represented by two permanent members in the Danish Parliament.
The Home Rule Act of 1978 enabled Greenland to take over responsibility in almost all fields of society appertaining exclusively to this community.
Greenland Home Rule is an extensive type of self-government. By the Greenland Home Rule Act, the Danish Parliament has delegated legislative and executive powers to the Home Rule Authority consisting of a popularly elected legislative assembly: The Greenland Home Rule Parliament (Landsting) and the Greenland Home Rule Government (Landsstyre).
The responsibilities of the Home Rule authorities include transport and communication, environmental protection and conservation of nature.
Greenland is not a member of the European Union.
3.3.1 The climate of Greenland
Greenland has a polar, arctic climate.
Due to the large geographical spread of the country, from 60° N to almost 85° N, and the large variation in topography, the climate within Greenland differs considerably. During the winter months the mean temperature in January at sea level varies between -35° C in Peary Land in the north and -3° C at the south-west coast. In July the mean temperatures ranges from 1° C to 10° C with the extremes more often situated between the outer coasts and the interior fjords than between northern and southern parts.
On the Greenland ice-sheet the temperature is much lower, and over the area as a whole the annual mean temperature ranges from 1°C at the southernmost west coast to about -30° C in the interior.
The distribution of precipitation ranges from more than 2,000 mm in the Cape Farewell region, the southernmost tip of Greenland, to less than 150 mm at places in north Greenland. In general, the north-western part of Greenland receives its precipitation maximum during the summer months, and the south-eastern part during the autumn and winter months.
The number of heating degree days of the main town Nuuk in south-western Greenland is approx. 6,500 (base: 19° C).
High wind speeds occur in some fjords as either Foehn or as Katabatic winds, especially coming from the ice cap. In general, storms with hurricane force are most frequent along the coasts of the southern part of Greenland.
3.4 National circumstances for the Faroe Islands
The Faroe Islands are situated in the North Atlantic 430 km southeast of Iceland, 600 km west of Norway and 300 km northwest of Scotland. Of the 18 islands in the Faroes, 17 are inhabited, the total number of inhabitants being 45,300. The total land area is 1,399 km2 and the largest island is Streymoy with an area of 373.5 km2.
In 1948 an agreement was made under which the Faroe Islands were granted home rule status within the Kingdom of Denmark. Internal affairs are governed by the 27-member Løgting (Parliament).
The Faroe Islands are not a member of the European Union.
International treaties concluded by the Danish Government bind Greenland and the Faroe Islands to the same extent as they do the Danish Government unless derogations have been specially requested.
3.4.1 The climate of the Faroe Islands
The climate of the Faroe Islands is mildly oceanic with plenty of precipitation.
The annual mean temperature at sea level is close to 6.5° C. The mean temperature for January is about 3° C and for July 10° C.
The number of heating degree days for the Faroes is roughly 3,900 (base, 17° C).
The annual precipitation ranges from 1,500 mm to 3,000 mm, falling mostly in October (150 to 400 mm). Precipitation is lowest in June (60 to 120 mm).
The frequency of hurricane force storms (only related to mean wind speed exceeding 25 m
per sec) is generally high, more than two per year.