[Front page] [Contents] [Previous] [Next] |
Modern Windships; Phase 2
4. The High-Lift Wing Mast
High-Lift Alternatives
Choosing a Rig
Wind Tunnel Tests
Results and Conclusion
The Performance of the Sail Mast Compared with the Wing mast
Relation between Performance and Price
Conclusion
Aeroplanes need to increase the lift of the wings during landing and take off. For this purpose a slat is protruded from the leading edge of the wings and one or two flaps from the trailing edge. Small air slots are thereby created between the wing and the slat / flaps.
The idea is to prevent separation by directing air from the lower side of the wing to the upper side through backward-directed slots, thus adding kinetic energy to the low-energy boundary layer on the upper side of the wing.
The slot in front of the flap will delay turbulent separation over the flap. The slot aft of the slat will prevent permanent laminar separation over the forward portion of the wing. This lead to a new idea: The high-lift wing mast, see Figure 18 below.
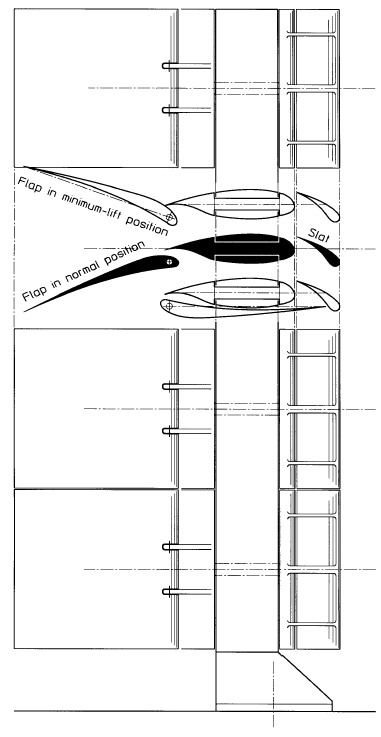
Figure 18. The high lift wing mast.
The mast consisted of the following main parts:
| A load carrying symmetrical central mast. | |
| An asymmetrical trailing edge of the central mast. | |
| An asymmetrical leading edge of the central mast. | |
| An asymmetrical flap hinged at the trailing edge. | |
| An asymmetrical slat fixed to the leading edge. |
The principle for shifting the profile from side to side was adopted from the NACA 63-412 wing mast. All the asymmetrical parts were divided into 4 horizontal sections. A horizontal shaft through the central mast coupled the trailing- and leading edges to each other. The profile was shifted from side to side by turning these 4 shafts 180° .
The height of the wing mast was 43.1 m and the cord length with the flaps in their normal working-positions was 20.6 m, giving a total active sail area of about 890 m2.
High-Lift Alternatives
Increasing the lift of a wing by boundary layer control can be done in many different ways. Two methods are described below in more detail:
| Backward-directed blowing slots with air supplied by a blower is an alternative to the kind of slots used in the high-lift wing mast. | |
| The kinetic energy of the layers of air close to the upper surface of a wing can also be increased by removing low-energy air through suction slots or a porous surface. |
Figure 19 shows a NACA 641A212 wing section with a leading edge slat, a suction slot in the upper surface of the wing and a double-slotted flap at the trailing edge. This combination of high-lift devices gives a maximum lift coefficient of nearly 4.0.
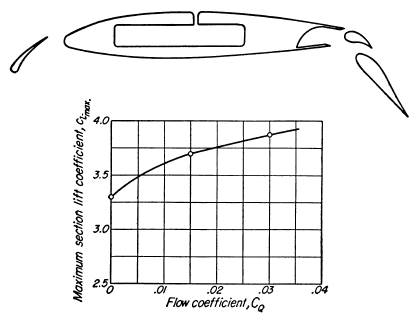
Figure 19. Boundary layer suction principle. Reproduced from Ref. 27.
Very thick wing sections with large leading-edge radii and suction slots may have lift coefficients of over 5.0 but at much higher drag coefficients than the thin sections, see Figure 20 below.
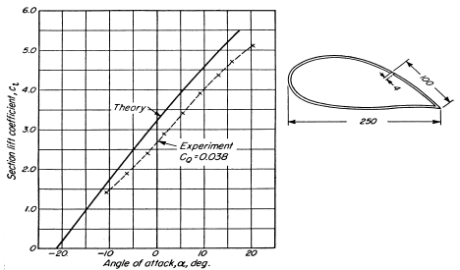
Figure 20. Thick profile lift coefficient, with boundary layer suction. Reproduced from Ref. 27.
Although active suction or blowing by fans might improve the lift, the fans need energy, require maintenance, and they are not free of charge. The conclusion was to use a thin high-lift wing profile without blowers.
Choosing a Rig
Among the alternatives, Pelmatic Knud E. Hansen chose to proceed with, the two most promising for further wind tunnel tests. The first alternative was the combination of a steel mast and sailcloth - hereafter called "the sail mast". The second alternative was the high-lift wing mast - hereafter called "the wing mast".
Wind Tunnel Tests
The wind tunnel tests of the two alternatives were conducted in a closed circuit tunnel at the Danish Maritime Institute with models in scale 1:125. See Figure 21 below.
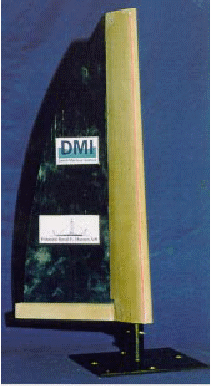
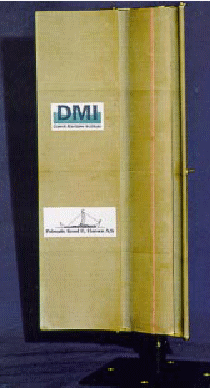
Figure 21. Mast sail and Wing Mast wind tunnel models.
The tests and the results were described in details in Ref. 4 "Report No.1, Single Rig Performance". The sail mast used for the test had a fixed sail profile. The wing mast had a movable slat and flap to optimise the position in relation to the centre mast, the width of the air slots and the total depth of the profile, see Figure 21. Using CFD to determine the properties of high lift profiles is not recommended. The most reliable results still come from wind tunnel measurements.
Because of the limited test budget the masts were manufactured of a relatively soft plastic material. The wing mast was a little too flexible causing some vibrations and mast bending during testing. The wind speed in the tunnel thus had to be limited to about 30 m/s for the sail mast and 25 m/s for the wing mast.
The scaling factor used when performing wind tunnel tests is referred to as the Reynolds number. The Re-number is defined as follows:
| Re : Reynolds number : | Equation 3 |
where:
r = density of air [kg/m3]
U = mean wind velocity [m/s]
c = cord length [m]
m = viscosity of air (1.789*10-5 [kg/m/s] at 20°C and 1013mbar).
When testing a profile in the wind tunnel the profile often has to be scaled down to fit inside the tunnel cross-section. As mentioned above, to obtain the same Re-number the wind speed in the wind tunnel should be increased. This was however not possible due to model limitations mentioned above. Instead a number of tests were performed running the wind tunnel at increasing speeds. At a certain speed the measured difference between two consecutive runs was small. The achieved Re-number was then considered sufficient. This procedure was performed at DMI/SL before the testing began, and the results were therefore deemed trustworthy.
At an angle of attack between 10 and 13° the maximum lift coefficient CL of the sail / mast combination was measured to 1.7 with a corresponding drag coefficient CD of 0.3.
If a slat was fitted on the leading edge the lift coefficient could be increased to 2.0, but at the same time the drag was doubled. The results for the wing mast were CL = 3.0 and CD = 1.0 at angles of incidence in relation to the central mast between 15 and 23° . A peak CL of nearly 3.2 was reached at a = 21° .
The conclusion was that the wing mast showed considerably higher lift coefficients than the sail mast, but also higher values of drag. The lift curves for the wing mast had wider peaks making it less sensitive to changes in the wind’s angle of incidence. The peak values generally occurred at larger angles of incidence than for the sail mast.
When sailing upwind (as close to the wind as possible) the relation between lift and drag is very important. A profile with less lift but also little drag could be better than a high lift profile with considerable drag, see Figure 22 below.
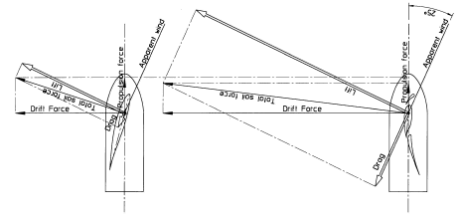
Figure 22. Lift and drag compared when sailing upwind.
At other courses with wind coming more from the aft the importance of the drag is gradually decreased until sailing at reaching and running where only one thing really counts; maximum lift.
The Performance of the Sail Mast Compared with the Wing mast
The area of the wing mast is S = 890 m2, the lift coefficient CL = 3.1, the drag coefficient CD = 1.0. The corresponding values for the sail mast are: S = 720 m2, CL = 1.7 and CD = 0.3.
For the wing mast the product S * CL = 2759 and S * CD = 890. The corresponding values for the sail mast are: S * CL = 1224 and S * CD = 216.
Figure 23 below shows these values plotted for an angle of the apparent wind of 30°.
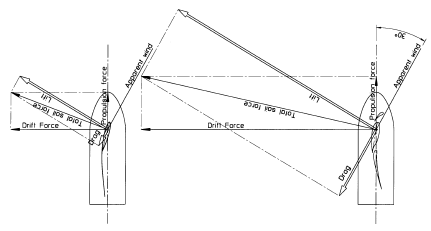
Figure 23. Performance comparison between the two different rig types.
Even at this very small angle the propulsion force from one wing mast is 1.44 times the force from one sail mast. At larger angles the importance of the drag is gradually decreased so that the advantage of the wing mast is correspondingly increased.
Table 2 below shows the force relation (propulsion force from one wing mast divided by the force from one sail mast) at different angles of the apparent wind.
Angle of the apparent wind in relation to the ship’s heading |
Relation |
30° |
1.44 |
45° |
1.85 |
60° |
2.04 |
75° |
2.15 |
90° |
2.25 |
105° |
2.33 |
120° |
2.42 |
Table 2.Performance comparison between a wing mast and a sail mast.
Table 2 shows that even at upwind courses the wing mast is considerably better than the sail mast. At reaching and running the advantages are huge and it will take more than two sail masts to substitute one wing mast.
The higher drift force of the high-lift wing mast at upwind courses will give a higher drift angle, but within the relevant small angles of drift (around 2°) this will not increase the hull resistance significantly.
Relation between Performance and Price
For a WindShip the important thing is not just pure performance but the best possible performance in relation to price. In addition, the handling and maintenance costs are major factors in the total picture. The wing mast is more expensive than the sail mast. It has more moving parts and hydraulic components. The fibreglass panels are also more expensive than the sailcloth. The calculated price for a complete wing mast with hydraulics, slewing bearing at the deck, reinforcements in the ship etc. is about 7 million DKK, see Appendix 9. The price for a sail mast without sail but with slewing bearing, boom, reinforcements in the ship etc. is estimated to about 3.5 million DKK.
The price for 15 sets of sail = 15 * 420 m2 * 1000 DKK/m2 = DKK 6.300.000,- giving a total price for one sail mast including sails for 30 years of nearly 10 million DKK. Even if the sails could be produced in large industrial scale at a price of 500 DKK/m2 the total price for one mast during 30 years would be about 6.7 million which is about the same as the price for one wing mast. It is worth noting that it would take two sail masts to substitute one wing mast.
The fibreglass panels and the structure of the wing mast may also be optimised and simplified in such a way that a price reduction of 15-20% would be realistic.
Conclusion
Based on the wind tunnel tests with one single mast and the price estimation, Pelmatic Knud E. Hansen chose to proceed with the wing mast for further tests. However, it should be noted that not all combinations and possibilities were investigated, due to limited resources. The selected wing mast was considered to provide a reliable light weight structure requiring low maintenance.
[Front page] [Contents] [Previous] [Next] [Top] |