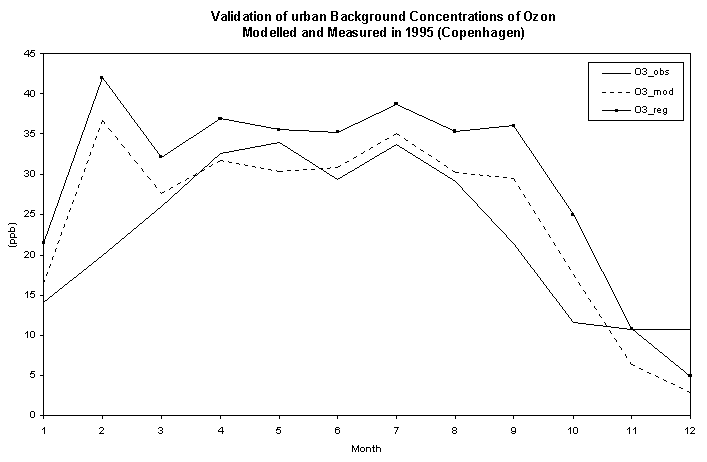
Modelled and measured urban background levels of ozone in Copenhagen. Regional background levels are also shown.
[Back]
_______________________________
Future Air Quality in Danish cities |
|
|||
| Figure 5.1 Modelled and measured urban background levels of ozone in Copenhagen. Regional background levels are also shown.
[Back] |